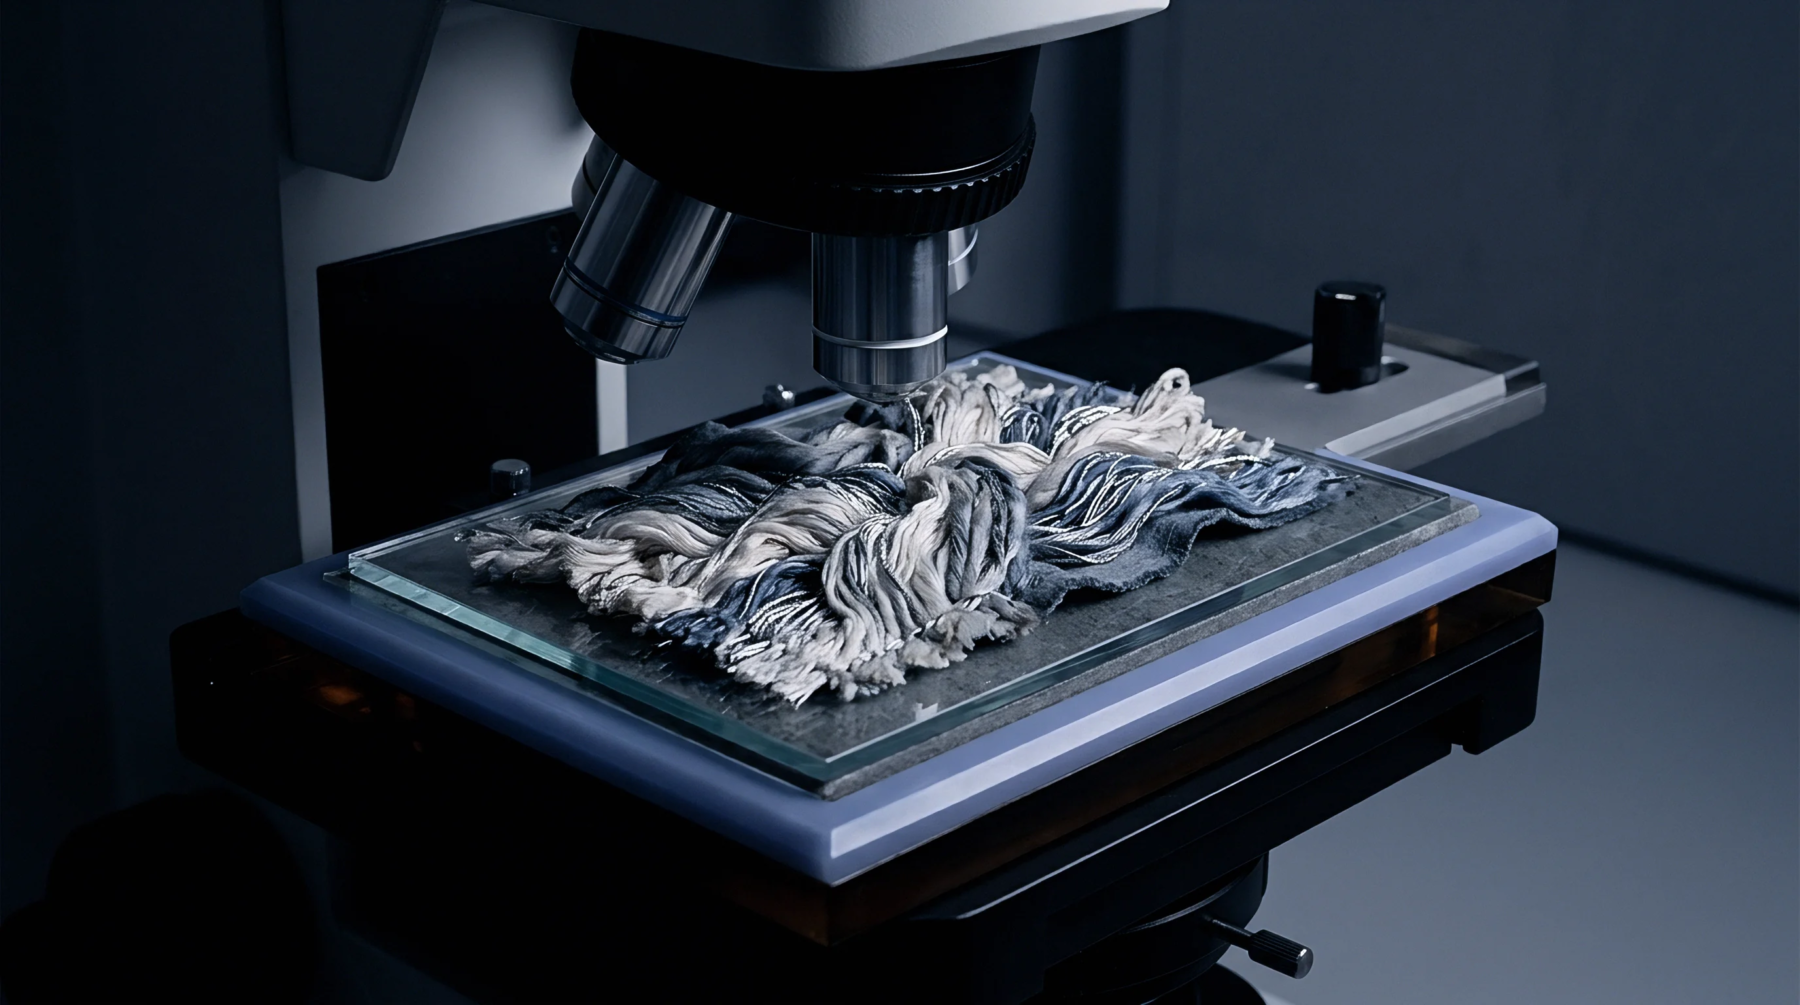
Industry Benchmark
Industry standard benchmarks quantify the frequency and type of yarn irregularities based on data collected from global spinning operations. Accessing uster defect statistics allows a mill to compare its own production quality against the performance of other top-tier manufacturers. These figures provide a percentile ranking for various parameters.
Quality Grading
Percentile levels such as the five percent or fifty percent marks indicate where a sample sits relative to global production. Relying on uster defect statistics allows buyers to specify a clear quality level in a commercial contract. A yarn meeting the five percent level is considered top-tier and suitable for high-end garments.
Laboratory Calibration
Measurement of these values requires specialized testing equipment that is standardized across the industry. Consistent uster defect statistics depend on the use of uniform test speeds and sample lengths. Such consistency ensures that a result obtained in one country is directly comparable to a result from another.
Process Control
Tracking shifts in these numbers over time helps a mill identify when its machinery needs maintenance. If the uster defect statistics for a specific line begin to climb, it may indicate worn drafting rollers or poor raw material blending. Proactive adjustments based on these data points prevent the production of sub-standard yarn and ensure the mill maintains its standing within the global quality distribution.