Cashmere Adulteration and the Test Methods That Survive a Dispute
Defending a cashmere claim demands LC-MS/MS proteomic proof tied to core samples that survive ISO 17025 cross-examination across two split lots.
Statistical variance expressed as a percentage of the average fiber thickness quantifies the level of uniformity found within a batch of raw animal hair or synthetic tow. In the context of wool and cashmere, the coefficient of variation diameter indicates how much the width of individual fibers deviates from the mean value of the entire lot. A low percentage signifies that the fibers are relatively uniform, while a high percentage suggests a mixture of very fine and very coarse fibers.
This measurement is calculated by dividing the standard deviation by the mean diameter and then multiplying by one hundred to arrive at a percentage. Grading standards for luxury fibers often set a maximum limit for this value to ensure that the material remains suitable for fine yarn production.
Yarn manufacturers rely on low variability to maintain consistent tension during the drafting and spinning processes. When the coefficient of variation diameter is too high, the presence of coarse fibers creates thick spots in the yarn, while the finer fibers create thin sections that are prone to breakage. The mechanism of failure involves the uneven distribution of twist, as the twist tends to accumulate in the thinner areas of the yarn.
This imbalance leads to frequent ends-down on the spinning frame, which reduces the efficiency of the mill and increases the amount of waste produced. High variability also forces the spinner to use a lower spinning limit, which means they cannot produce the fine counts that the mean diameter would otherwise allow. Operators must adjust the settings of the drafting zone to accommodate the widest fibers in the distribution, which often results in a bulkier yarn than intended.
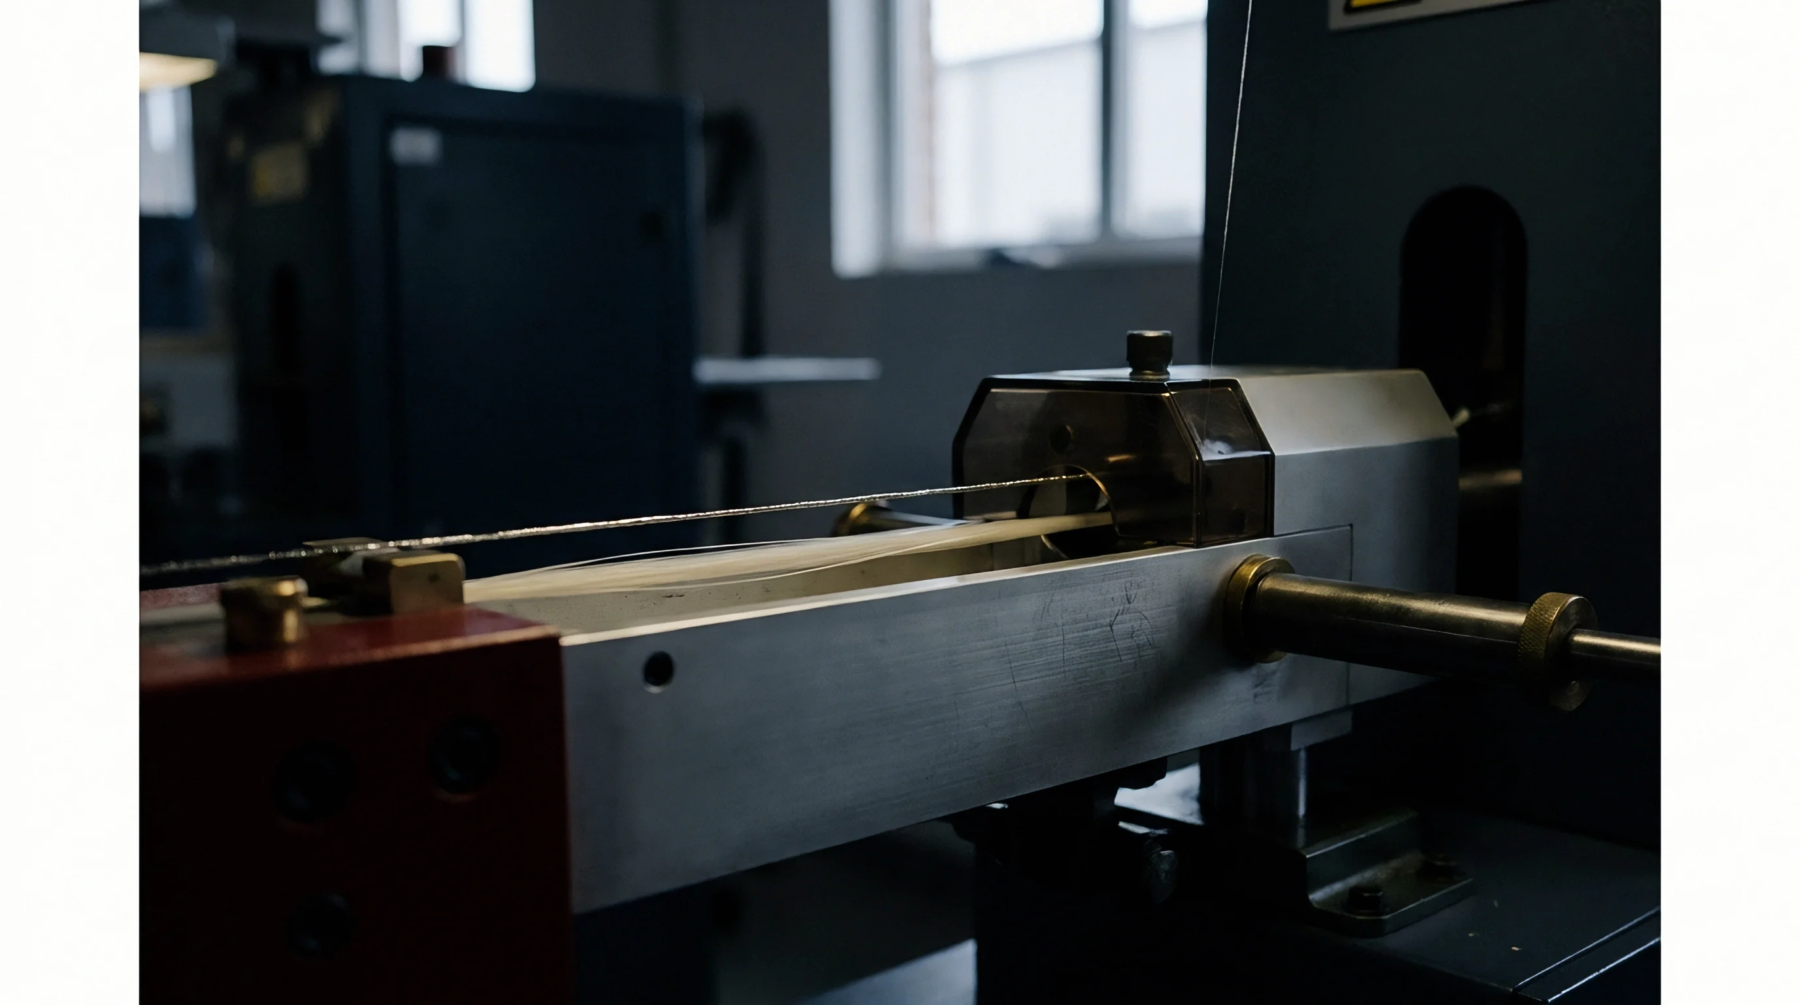
Accurate assessment of this variability requires a large number of individual measurements conducted on a representative sample of the fiber lot. The coefficient of variation diameter is typically determined using a laserscan or optical fiber diameter analyzer, which can measure thousands of fibers in a few minutes. These automated systems provide a detailed distribution curve that shows the frequency of every fiber width measured in the sample.
Operators must ensure that the fiber is properly conditioned and cleaned before testing to avoid errors caused by residual grease or moisture. The boundary of the test is defined by the number of snippets measured, with a larger sample size providing a more reliable statistical result.
Commercial value in the textile trade is heavily influenced by how uniform the fiber diameter remains across the entire purchase. A high coefficient of variation diameter often leads to a harsh hand feel in the finished fabric, even if the mean diameter is low. This coarseness occurs because the thickest fibers in the distribution stick out from the surface of the yarn and irritate the skin of the wearer.
Buyers use this metric to negotiate price discounts for lots that show poor uniformity. In the production of high-end suiting, a tight control over diameter variability is a requirement for meeting the specifications of the world’s leading weaving mills.
Defending a cashmere claim demands LC-MS/MS proteomic proof tied to core samples that survive ISO 17025 cross-examination across two split lots.
Expertise is a utility, not a secret. sentiention™ publishes its working knowledge as open reference: intelligence layer covering the materials it sources, the markets it enters, and the reference that serves both.