Spectrophotometer Color Measurement Protocols and Batch Shade Variation Limits
Enforce CIE DE2000 spectrophotometric shade tolerance limits under dual illuminants with strict fabric conditioning to prevent batch rejections.
Aperture
Integrating sphere spectrophotometers using diffuse d/8 geometry capture total reflectance by measuring light scattered inside a barium sulfate or Spectralon coated internal chamber. Standard laboratory benchtop instruments split illumination between a high-energy xenon flash lamp and an array of silicon photodiodes across the visible spectrum from 400 to 700 nanometres at 10-nanometre intervals. Measurement precision depends on matching the optical aperture diameter to the structural scale of the substrate.
A Large Area View port measuring 25 to 30 millimetres averages yarn high-spots, slubs, and weave geometry across enough surface area. Small Area View settings of 6 millimetres isolate tiny color regions, but they introduce optical noise on textured wovens, coarse knits, or slubbed linen yarns because individual thread floats dominate the optical field.
Managing specular reflectance changes shade readings dramatically on glossy or resin-finished fabrics. Specular Component Included mode captures surface gloss alongside diffuse light, isolating true pigment absorption from finish effects. Specular Component Excluded mode uses a light trap to discard directional mirror reflections, measuring color closer to how the eye sees it under ambient light.
Mercerized cotton, calendared synthetics, and heavy wax-coated canvases yield divergent spectral reflectance curves between these two settings. Standard benchtop protocols bind mill testing to one explicit specular state to prevent false batch failures.

Sphere Optics and Specular Traps
Diffuse illumination inside a barium sulfate coated chamber isolates reflected light from surface gloss. In a standard d/8 integrating sphere, light strikes the interior wall and scatters uniformly before hitting the fabric specimen at eight degrees off the normal axis. Dual-beam optical pathways continuously track flash intensity against specimen reflectance to compensate instantly for lamp output variation.
Specular ports set at eight degrees opposite the detector physically open or close to include or block mirror reflections. When testing high-lustre filament nylon or micro-denier polyester satins, specular inclusion delivers stable CIELAB coordinates despite calender pressure fluctuations during finishing.
Specular exclusion better matches how fabric looks on a retail floor. Plants applying heavy fluorocarbon oil-repellent or polyurethane coatings deal with shifts in surface refractive index. Trapping the specular beam in laboratory scans highlights these surface treatments, exposing a visual shade darkening that specular inclusion completely hides.
Aligning lab sphere settings with dyehouse procedures eliminates discrepancies between raw greige inspection and finished goods release.

Measurement Field Diameters and Sampling Error
The target viewing window determines how much fabric area contributes to a spectral reflectance curve. Coarse single jersey knits, 3/1 heavy twills, and dobby weaves have enough surface depth to cast micro-shadows inside the port. Ultra Small Area View ports measuring 3 millimetres perform poorly here, returning standard deviations over 0.45 delta E across repeated scans on the same roll.
Switching to Extra Large Area View ports measuring 30 millimetres drops variance below 0.05 delta E by averaging hundreds of yarn intersections in a single measurement cycle.
| Optical Port Size | Aperture Diameter | Illumination Area | Target Substrate Suitability | Repeatability Range (dE2000) |
|---|---|---|---|---|
| Extra Large Area View (XLAV) | 30.0 mm | 34.0 mm | Coarse knits, heavy woolens, pile fabrics | 0.02 – 0.05 |
| Large Area View (LAV) | 25.4 mm | 30.0 mm | Standard wovens, flat jersey, poplin | 0.03 – 0.08 |
| Medium Area View (MAV) | 15.0 mm | 20.0 mm | Narrow elastics, tapes, lace trim | 0.08 – 0.15 |
| Small Area View (SAV) | 6.0 mm | 10.0 mm | Yarn packages, small print motifs | 0.18 – 0.35 |
| Ultra Small Area View (USAV) | 3.0 mm | 5.0 mm | Single yarn strands, zipper teeth | 0.35 – 0.70 |
Automated inline spectrophotometers mounted over stenter frames use non-contact optical heads at fixed geometry. Fabric flutter along high-speed tentering tracks changes the reading distance, skewing signal intensity and adding artifacts. Modern non-contact sensors use laser distance tracking, triggering a capture only when the web is positioned precisely in the focal plane.
Small discrepancies between benchtop scans and inline monitor readings often come down to lint buildup on the sensor rather than optical drift.
Integrating sphere spectrophotometers using d/8 geometry capture total reflectance by collecting diffuse light while managing gloss effects through specular inclusion or exclusion ports.

Equation
Converting spectral reflectance curves into numerical color differences depends on mathematical spaces tuned to human vision. The 1976 CIELAB space established three orthogonal axes: lightness L from zero black to one hundred white, green-red opponent coordinate a , and blue-yellow opponent coordinate b. Simple Euclidean distance, expressed as scalar Delta E 1976, treats this space as a uniform sphere.
But human vision works as an asymmetrical ellipsoid: the human eye notices minute shifts in low-chroma neutral greys while tolerating wide spectral variation in vivid oranges and yellows. Basing pass/fail decisions on scalar Delta E 1976 leads to false rejections in saturated shades and unintended approvals in dull neutrals.
Modern color difference formulas fix these distortions by building dynamic, ellipsoidal tolerance boundaries around a target standard. Developed by the Color Measurement Committee of the Society of Dyers and Colourists, the CMC equation applies weighting factors for lightness and chroma based on where the batch color sits in the CIELAB volume. Commercial buyer specs often set a CMC ratio of 2:1 for fabrics, granting twice the tolerance for lightness shifts compared to chroma or hue.
Apparel sewing threads call for tighter 1.4:1 ratios to avoid noticeable seam highlights under bright store lighting.

Ellipsoidal Tolerancing and Weighting Functions
Mapping raw CIELAB coordinates into visually uniform spaces accounts for the non-linear way humans perceive color. The CIE DE2000 formula, codified in ISO 105-J03, is the current industrial standard for fabric shade verification. It adds five key adjustments: a dynamic lightness weighting SL, chroma weighting SC, hue weighting SH, a rotation term RT to correct blue-purple non-linearities, and a revised scale for low-chroma shades.
Together, these functions adjust the final delta E based on where the target shade sits in chromaticity space.
| Formula Standard | Lightness Weight (SL) | Chroma Weight (SC) | Hue Weight (SH) | Rotation Term (RT) | Primary Application |
|---|---|---|---|---|---|
| CIELAB (dE 1976) | Fixed (1.0) | Fixed (1.0) | Fixed (1.0) | Absent | Legacy historical records |
| CMC l:c (2:1) | Dynamic on L | Dynamic on C | Dynamic on Hue angle | Absent | Apparel, general woven fabrics |
| CMC l:c (1.4:1) | Scaled for seams | Dynamic on C | Dynamic on Hue angle | Absent | Sewing threads, trim matching |
| CIE DE2000 (1:1:1) | Dynamic L curve | Dynamic C curve | Dynamic Hue curve | Active in blue hue angle | Automotive, strict retail bulk |
| Methods note: CIE DE2000 calculations assume parametric factors kL, kC, and kH set to unity under standard laboratory reference viewing conditions. | |||||
Setting pass limits with CIE DE2000 removes arbitrary decisions on saturated dyeings. Lightness weighting SL grows as L moves away from neutral grey fifty, widening acceptable numerical limits along the L axis for stark whites and deep blacks. Chroma weighting SC scales with total chroma C , mirroring a reduced sensitivity to small dye variations in vivid colors.
Hue weighting SH keeps the tightest boundary across all zones, ensuring strict enforcement against hue shifts.
Rotational Factors and Hue Non-Linearity
Spectral shifts in the blue region demand specialized correction because visual tolerance ellipses curve sharply in blue color space. Between hue angles of 225 and 315 degrees, tolerance space rotates away from the radial chroma vector. The RT rotation term in CIE DE2000 calculates an interactive factor based on chroma and hue angle, compressing delta E values for blue-purple shades that eyes read as acceptable matches.
Leaving this term out forces mills to re-dye navy and violet lots that are visually fine, simply because of artificially inflated delta E numbers.
Comparing scalar delta E values across different formulas shows why contracts must state the exact equation used. A 1.2 dE 1976 reading on deep olive drill fabric can drop to 0.65 under CMC 2:1 and 0.48 under CIE DE2000. Choosing a formula that penalizes hue shifts more than lightness variations helps bulk runs match visual expectations on store display racks.
Color difference formulas that incorporate lightness, chroma, and hue weighting factors align spectral measurements far closer to human visual judgment than raw Euclidean distances.

Clamp
Sample preparation dictates measurement repeatability across test rounds. Textiles continuously absorb ambient moisture, which alters yarn diameter, surface reflectivity, and dyestuff performance. Hydrophilic fibers like cotton, viscose, and wool show distinct spectral shifts as internal moisture fluctuates.
Measuring a bone-dry roll straight off a hot stenter belt produces invalid CIELAB coordinates compared to readings taken at moisture equilibrium. Standard protocol requires exposing fabric to 20 degrees Celsius plus or minus 2 degrees and 65 percent relative humidity plus or minus 4 percent for at least four hours before scanning.
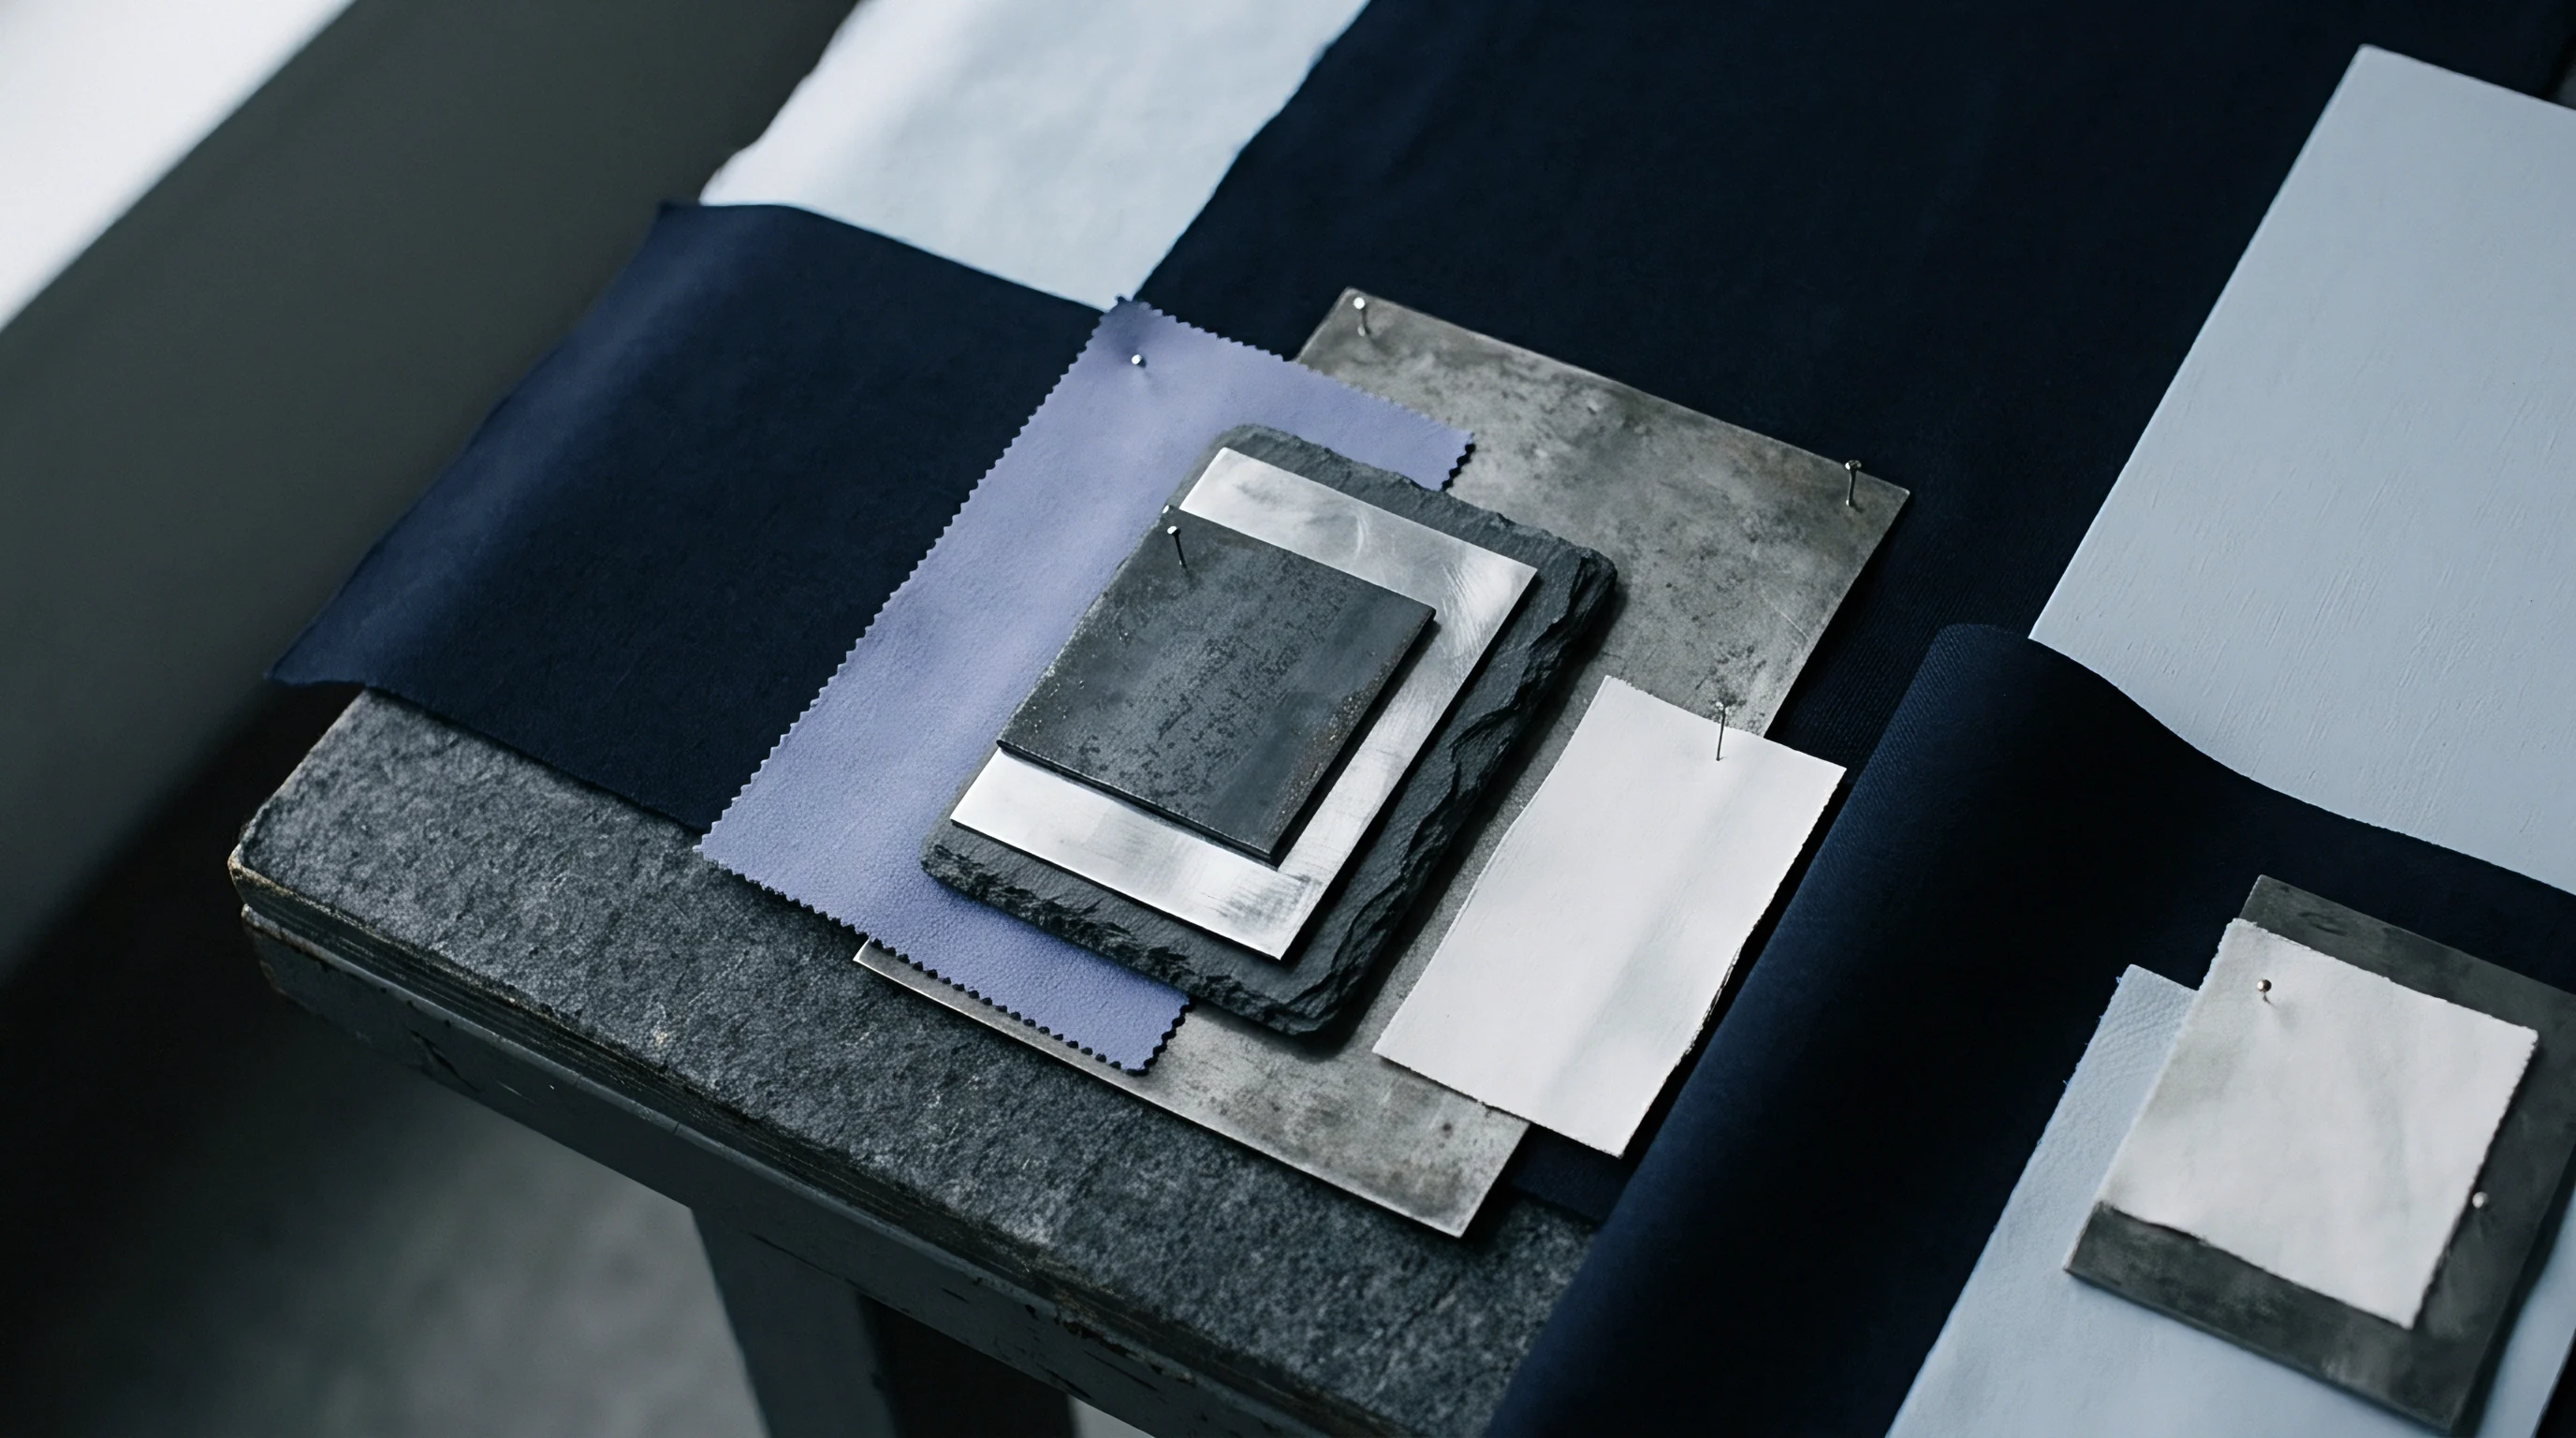
Proper backing prevents background light from bleeding through thin or open fabrics. Light passing through sheer polyesters, mesh knits, or lightweight plain weaves bounces off the instrument stage and reflects back through the sample, corrupting readings. Standard practice requires folding the fabric into enough plies that adding another layer causes no change in the spectral curve.
When sample size or elasticity makes folding impossible, technicians back the single layer with a certified white ceramic calibration tile or a stack of the un-dyed target greige fabric.
Atmospheric Conditioning and Moisture Equilibrium
Conditioning textile samples at twenty degrees Celsius and sixty-five percent relative humidity stabilizes fiber regain before scanning. Viscose rayon has a moisture regain capacity of thirteen percent under standard conditions, shifting its refractive index as water enters amorphous cellulose zones. Testing unconditioned viscose straight from drying ovens makes the color look lighter and less saturated.
While cold water restores moisture balance faster in quick bench tests, standard air exposure in a controlled room remains the only contractually defensible method.
- Purge ambient air around the conditioning rack to hold 20 degrees Celsius and 65 percent relative humidity continuously.
- Unroll test swatches and hang them on perforated wire racks for two-sided airflow across the fabric.
- Condition hydrophilic natural fibers for at least 4 hours and synthetic hydrophobic fibers for 2 hours minimum before measuring.
- Run a two-point optical calibration using the black trap and white ceramic reference tile certified under ISO 17025.
- Place the conditioned sample over the aperture, applying steady clamp pressure to flatten puckers without stretching elastomeric yarns.
- Take four separate spectral scans per sample, rotating the swatch 90 degrees between readings to average out directional highlights from warp and weft yarns.
Directional yarn layout creates errors if ignored during mounting. Twills, satins, and directional pile fabrics reflect light unevenly depending on their orientation to the optical sensors. Warp threads parallel to the light path scatter light differently than weft threads running perpendicular across the port.
Rotating the swatch ninety degrees between four successive scans and averaging the data cancels out these weave orientation artifacts.
Presentation Geometry and Backing Substrates
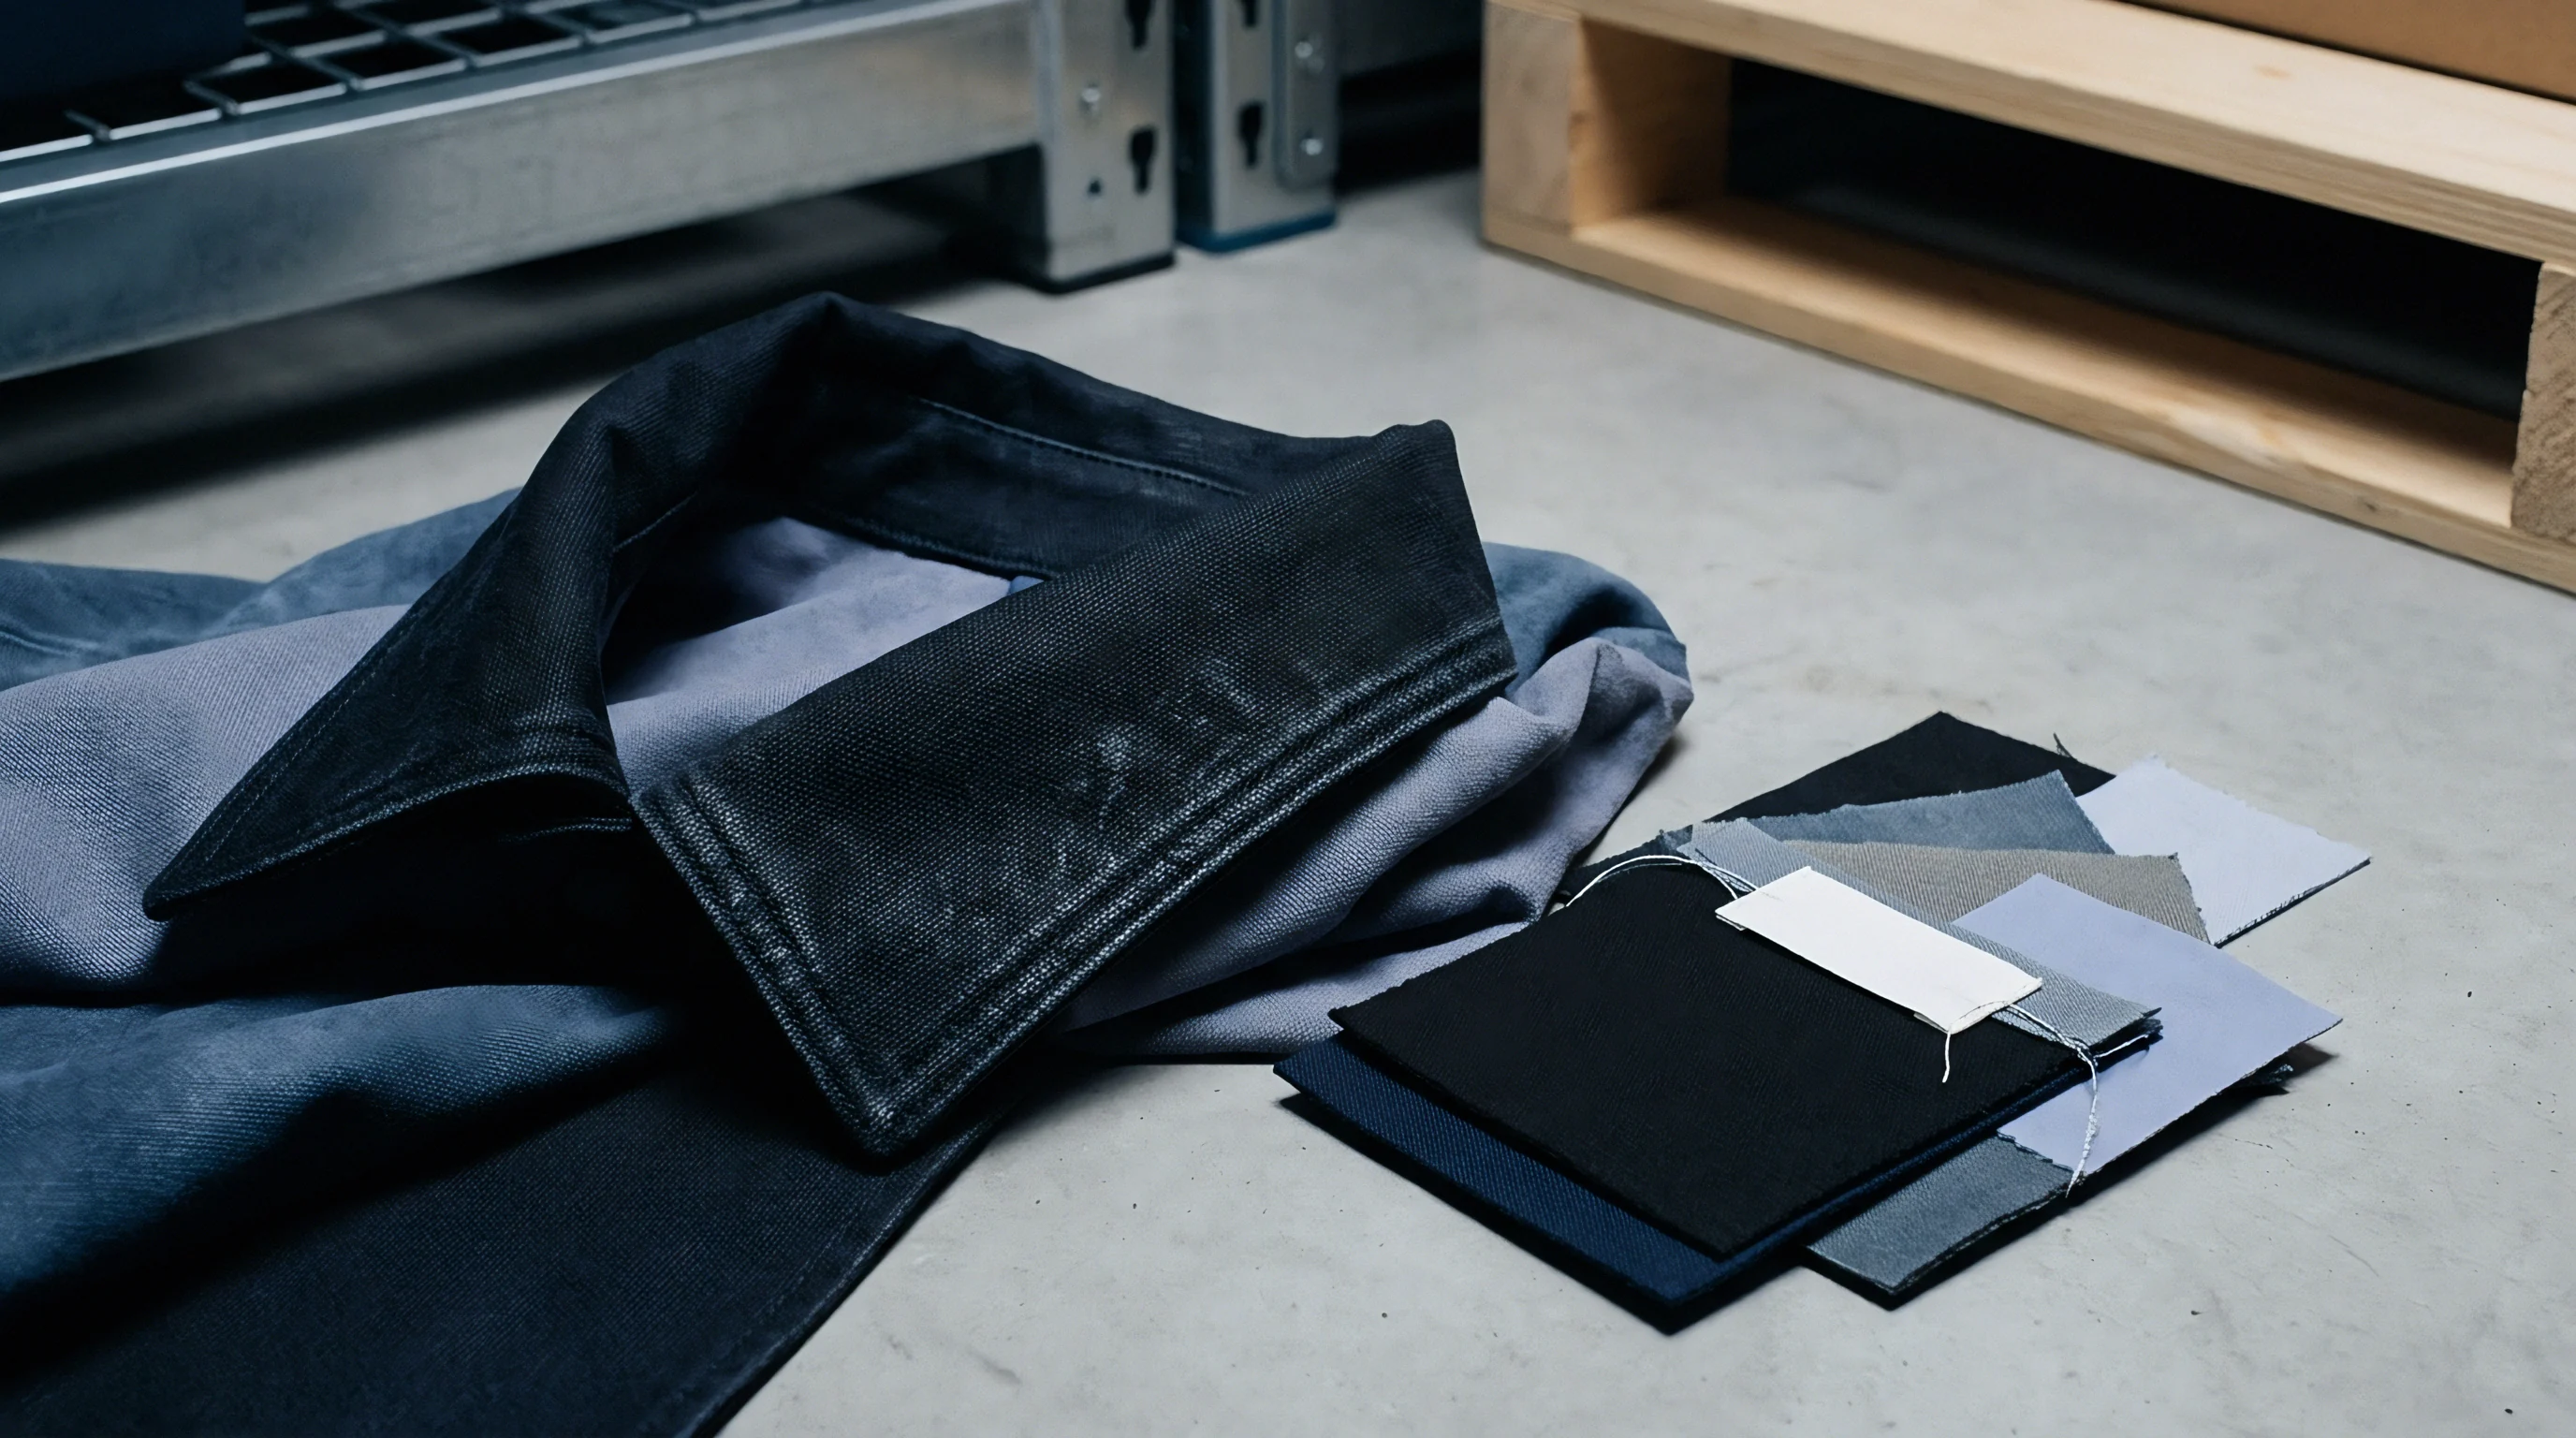
Getting an opaque measurement means folding wovens into enough plies that extra layers no longer change the reflectance curve. High-density poplins reach opacity at two to four plies, while sheer filament chiffons can take sixteen plies to block ambient light. When there isn’t enough sample to fold, technicians clamp a single layer over a standardized white ceramic tile with known spectral reflectance values.
Replacing twenty ruined rolls of silk satin cost four days of air freight re-shipment after an uncalibrated sample holder creased the fabric face during receiving tests.
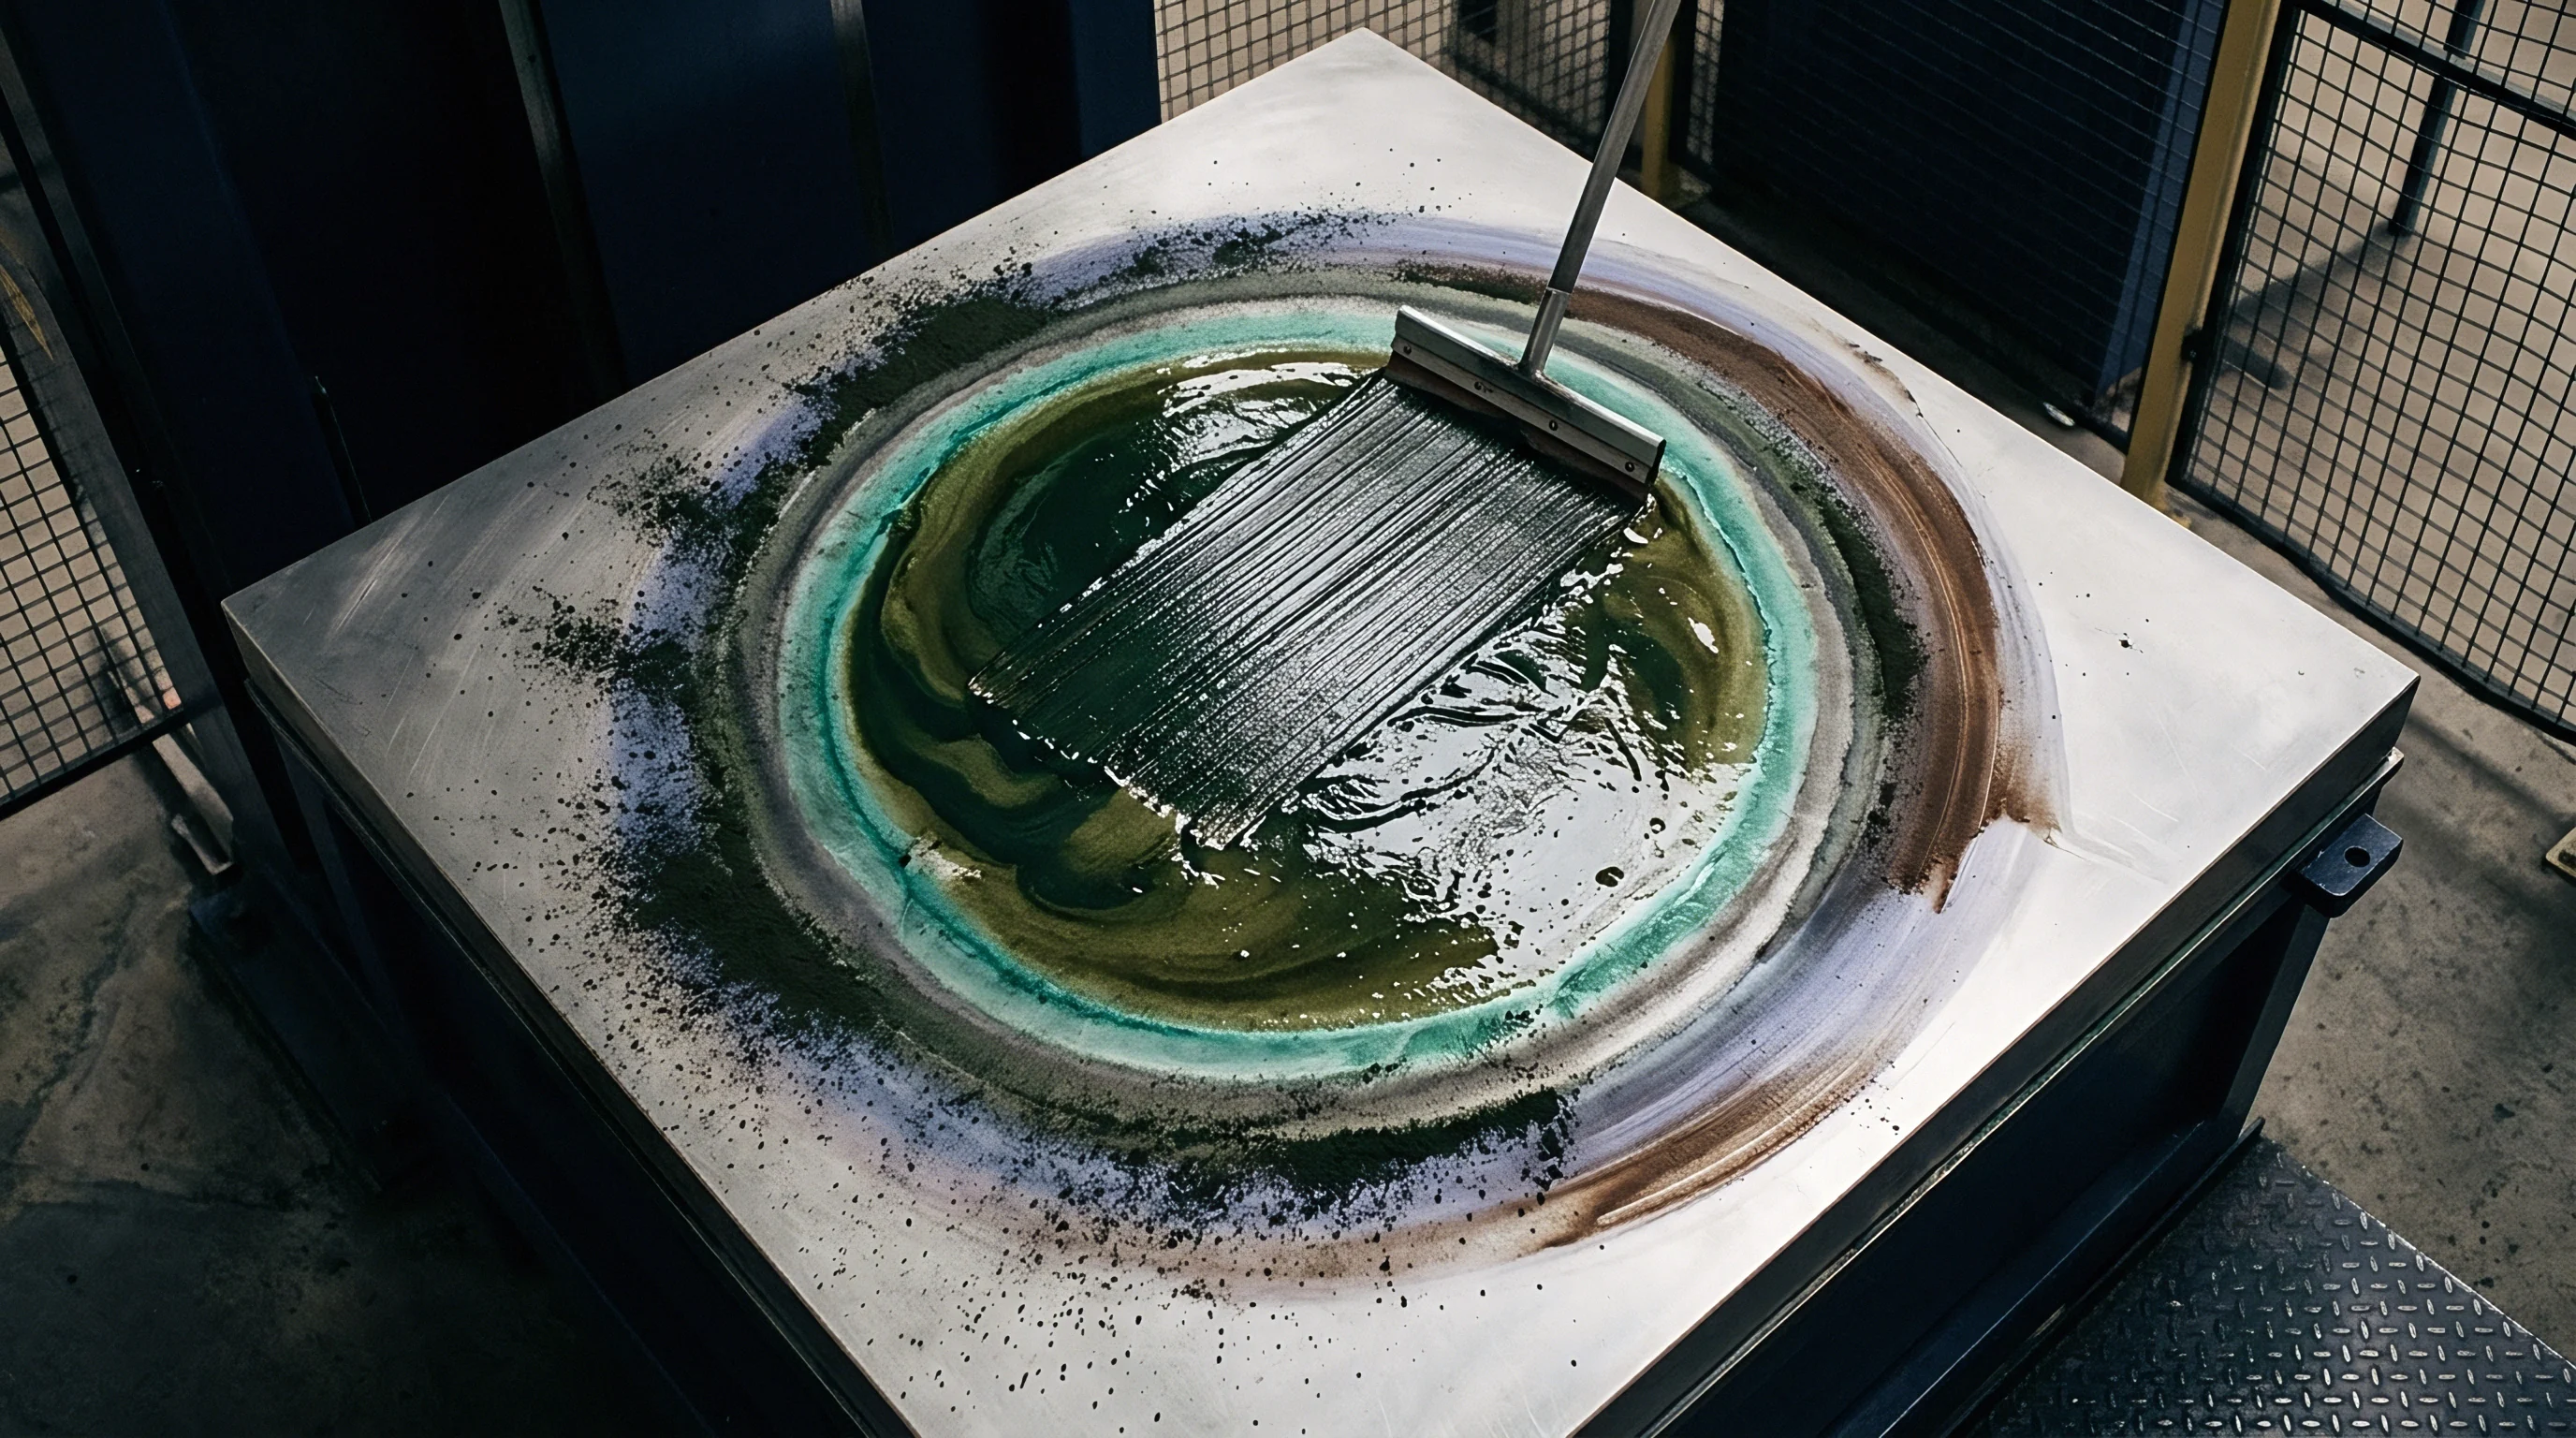
Too much clamp pressure deforms stretch and high-pile fabrics, skewing surface reflectance profiles. Spandex blend knits clamped hard against the aperture glass undergo temporary density changes that artificially darken the reading. Corduroy, velvet, and brushed fleece need distance-held or low-pressure mounting rings that present an uncompressed pile surface without crushing vertical yarns.
Tolerance
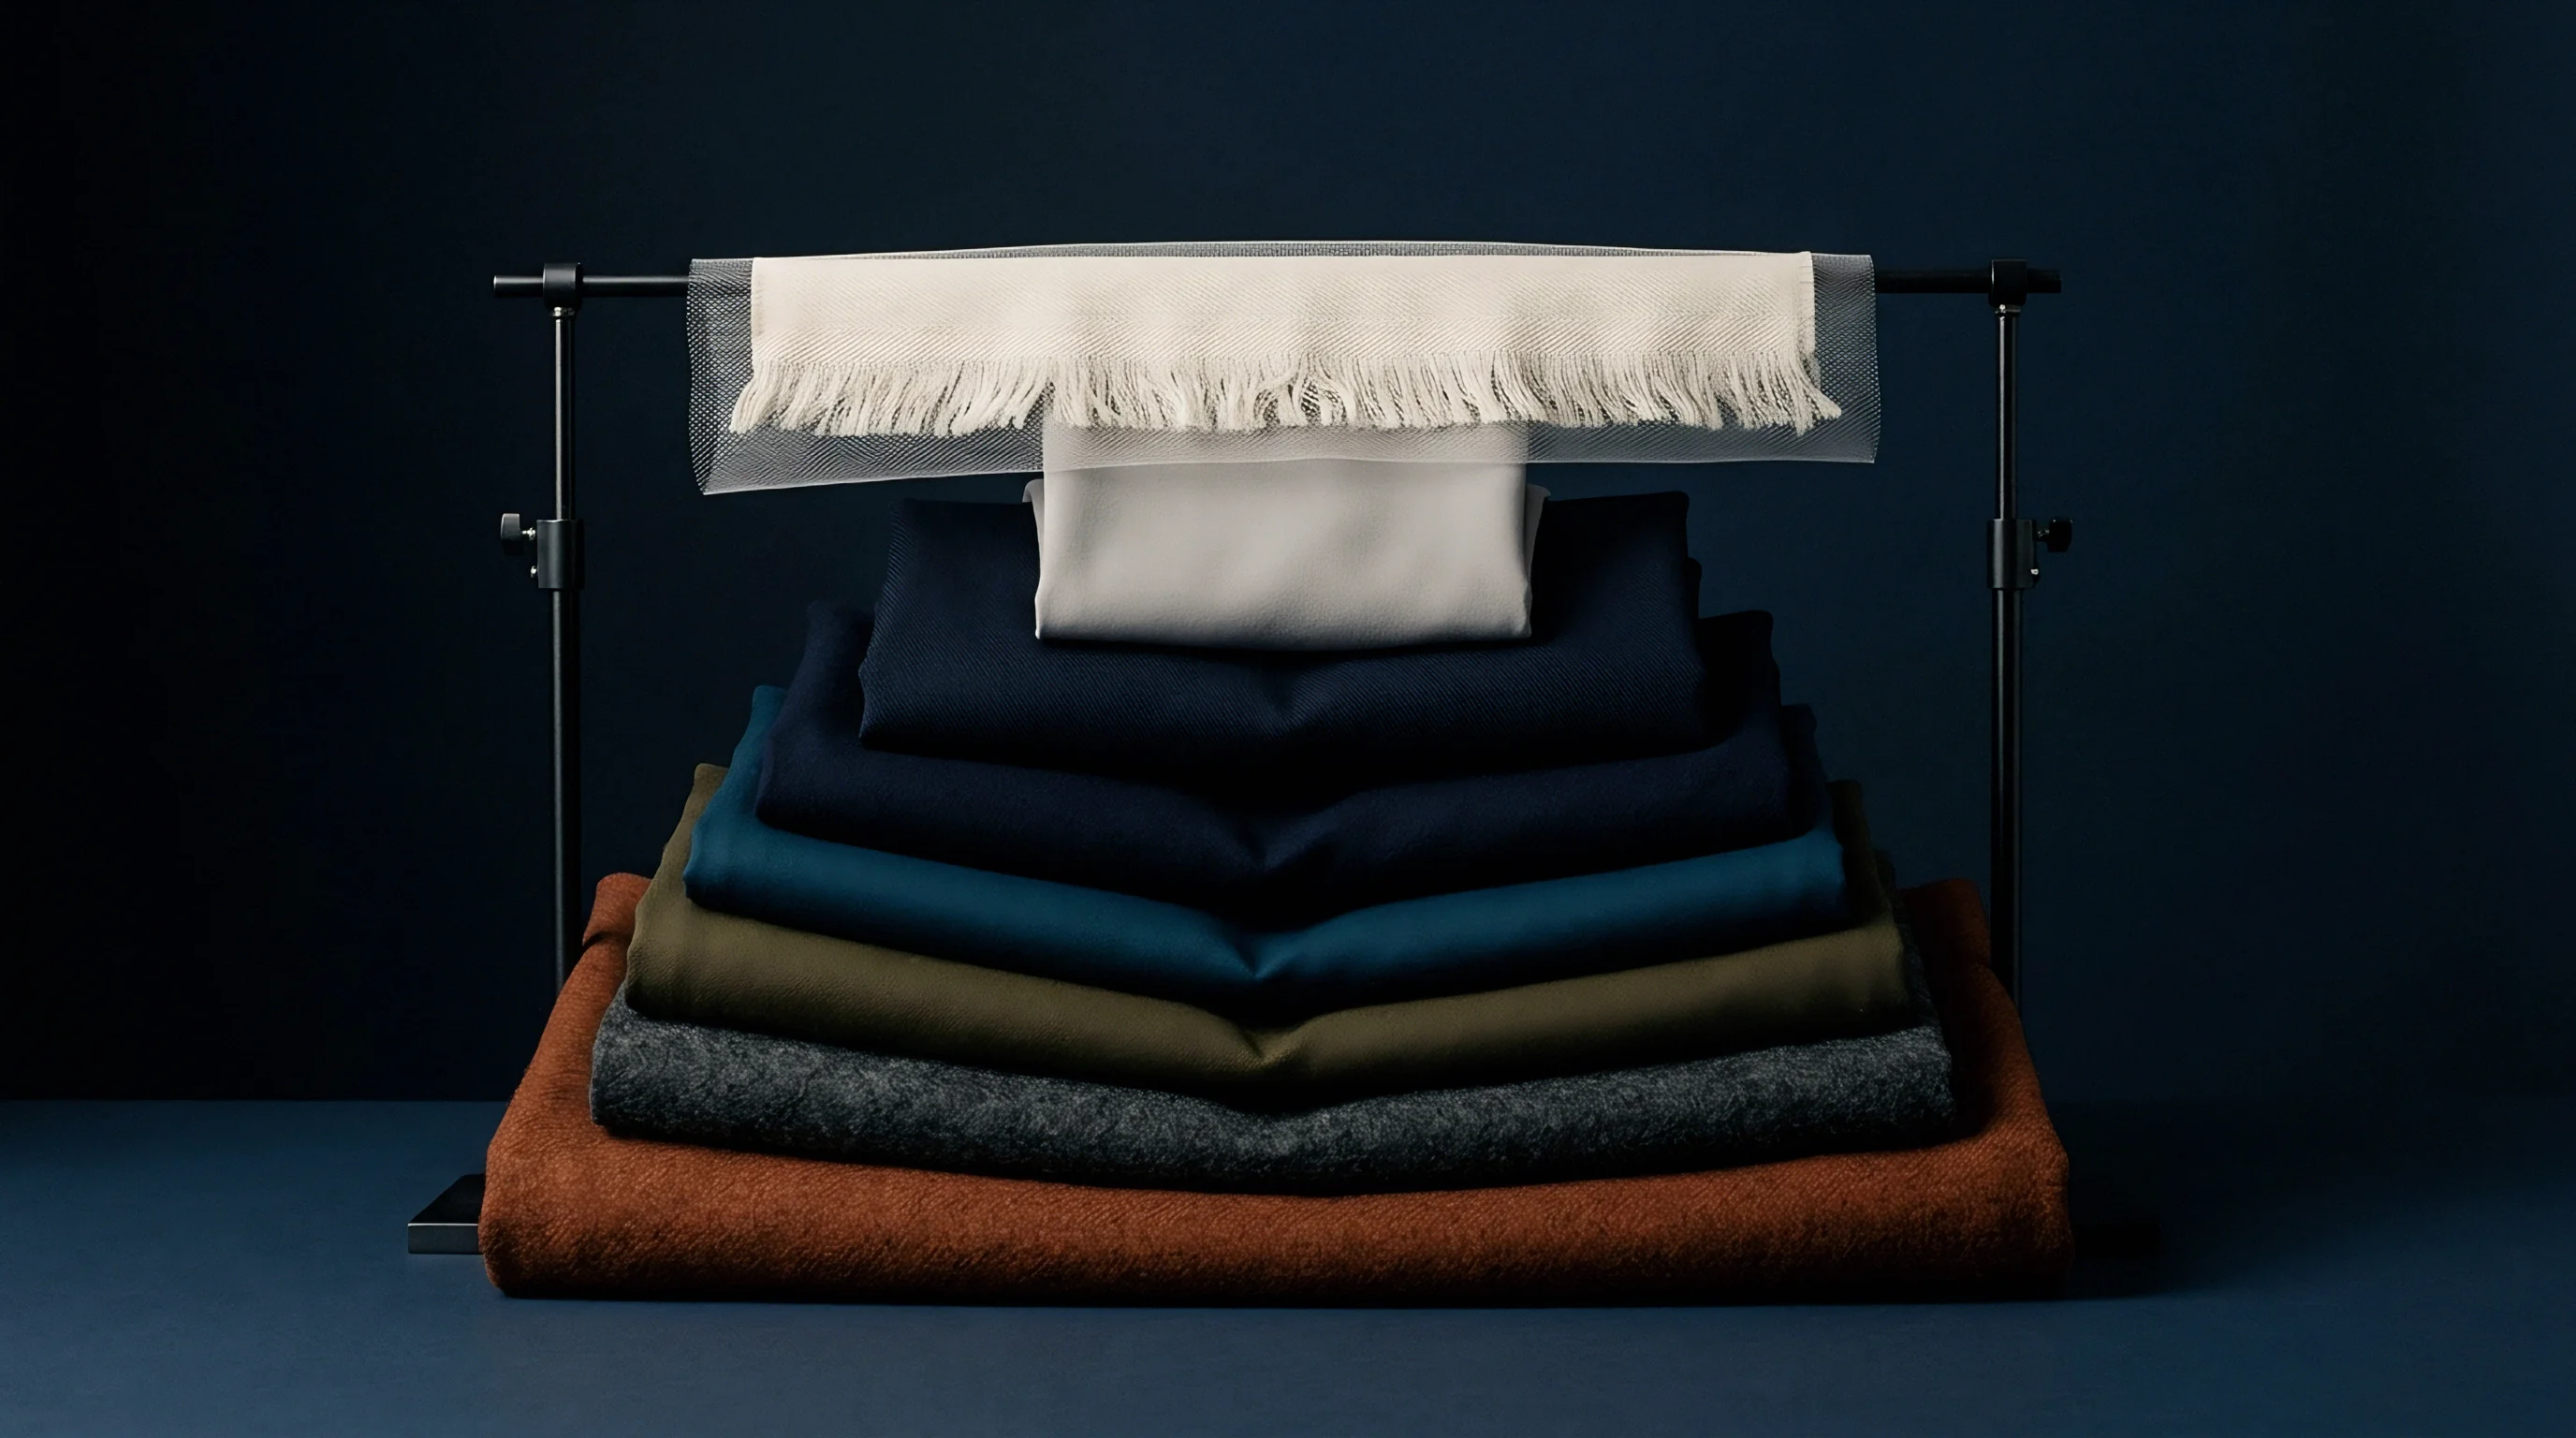
Setting commercial color tolerances means balancing aesthetic expectations against mill capabilities. Tightening numerical limits reduces visual variation between batches, but it raises scrap rates, forces strip-and-redye cycles, consumes more chemicals, and inflates lead times. Demanding an unachievable 0.3 dE2000 limit on continuous pad-steam cotton twill can push mill rejections past thirty percent.
On the flip side, setting loose limits over 1.5 dE2000 allows visible shade differences between adjacent garment panels, leading to retail rejections and markdowns.
| Fabric End-Use Category | Target dE2000 (Primary) | Max Single Roll dE2000 | Metamerism Index Limit | Light Fastness (ISO 105-B02) | Washing Fastness (ISO 105-C06) |
|---|---|---|---|---|---|
| Tailored Suitings & Blazers | 0.50 | 0.70 | < 0.50 | Grade 4-5 | Grade 4-5 |
| Athletic Apparel & Jersey | 0.80 | 1.00 | < 0.80 | Grade 4 | Grade 4 |
| Heavy Workwear & Canvas | 1.20 | 1.50 | < 1.00 | Grade 4 | Grade 3-4 |
| Intimate Apparel & Lingerie | 0.40 | 0.60 | < 0.40 | Grade 3-4 | Grade 4 |
| Outdoor Gear & Awnings | 1.00 | 1.30 | < 0.75 | Grade 7 | Grade 4-5 |
Practical tolerance bands depend on dyestuff class, fiber chemistry, and fabric construction. High-temperature jet dyeing of 100 percent filament polyester with disperse dyes gives excellent repeatability, holding within 0.5 dE2000 of approved lab dips. Exhaust dyeing un-mercerized 100 percent linen yarn with direct dyes brings natural fiber absorbency variations, requiring realistic tolerances opened up to 1.2 dE2000 under CIE DE2000.
Boundary Setting across Fabric End Uses
Workwear specs allow broader batch limits than fine tailoring because heavy-use garments face frequent washing under mixed lighting. Military contracts add strict spectral requirements beyond the visible spectrum into the near-infrared from 700 to 1200 nanometres for night-vision concealment. Automotive upholstery contracts impose the tightest limits in the industry, requiring dE2000 values under 0.30 against a single master standard maintained across international tier-one suppliers.
- Master Standard Stability anchors all shade evaluations to a single physical master swatch or central digital spectral dataset.
- Secondary Illuminant Checks enforce color consistency under retail fluorescent or LED lighting alongside primary daylight.
- Pass-Fail Spheres of Acceptance replace rigid coordinate boxes with dynamic ellipsoids calculated by CIE DE2000 algorithms.
- Batch Size Minimum Boundaries prevent mills from breaking orders into micro-lots that drive up lot-to-lot variance.
- Fastness Minimum Baselines separate color loss caused by washing, rubbing, or light exposure from initial dyeing errors.
Multi-component garments require carefully coordinated shade matching across materials. A technical winter jacket might assemble nylon face fabric, polyester lining, elastomeric rib cuffs, plastic zipper tapes, and metal snap covers. Each uses different dye chemistries and processing, yet all have to match under F11 retail store lighting.
Setting distinct CIELAB targets for each material component ~ rather than forcing every supplier to match one physical swatch ~ accounts for the optical limits of each substrate.
Commercial Yield Offsets in Continuous Dyeing
Continuous pad-steam dyeing lines drift over long runs as dye liquor depletes unequally or stenter temperatures fluctuate. During a 40,000-metre run of polyester-cotton twill, a 1.4 dE2000 shade drift was traced to an uncalibrated stenter feed roller that altered dye pick-up across the pad mangle. Tightening pad liquor temperature control to plus or minus 1 degree Celsius and installing automated dosing systems held drift below 0.6 dE2000, saving profit margins that scrap fabric would have wiped out.
Weighing financial trade-offs between tight tolerances and mill scrap rates helps guide sourcing terms. Holding a continuous dyeing line to a 0.4 dE2000 limit inflates fabric costs by fifteen to twenty-five percent to offset the mill’s re-topping and rejection risks. Opening tolerance to 0.8 dE2000 reduces yardage pricing significantly while remaining acceptable for general casual wear.
Inserting ISO 105-J03 clause six into master agreements puts commercial liability for shade rejection back on the mill if bulk orders drift past agreed delta E limits under secondary illuminants.
Standard purchase agreements referencing ISO 105-J03 color evaluation standards restrict visual dispute windows by binding both mill and buyer to instrumentally defined pass thresholds.

Disparity
Batch-to-batch shade variation is unavoidable in industrial wet processing. Variations in raw fiber affinity, water mineral content, humidity, dye lot strength, and dwell times create color shifts between production runs. Managing this requires systematic shade sorting to group finished rolls into visually uniform sub-lots before cutting.
Spreading unsorted rolls across automatic cutting tables leads to garments with mismatched sleeves, fronts, and collars, rendering the finished product unsalable.
Metamerism causes severe visual mismatches when fabric matched under artificial daylight splits into distinct shades under other light sources. Flare happens when a single dyed substrate shifts color dramatically moving from daylight to incandescent light. Dyestuff selection drives this behavior: mixing three dyes with widely separated absorption peaks to make beige creates high metameric instability.
Formulating that same beige with non-metameric trichromatic dye combinations produces stable reflectance curves under almost any light.
Metameric Indices and Light Source Transitions
Dye formulations matched under daylight often separate under incandescent spotlights when their reflectance profiles diverge. The Metamerism Index (MI) measures this split by calculating coordinate differences between two light sources ~ usually moving from primary illuminant D65 to secondary illuminant A or F11 (TL84). An MI under 0.50 dE2000 marks a non-metameric match that stays visually consistent.
Values over 1.00 dE2000 indicate severe dye mismatch, producing obvious shifts on retail displays.
| Primary Illuminant | Secondary Illuminant | Tertiary Illuminant | Max Allowed MI (dE2000) | Visual Split Severity |
|---|---|---|---|---|
| D65 (Daylight 6500K) | A (Incandescent 2856K) | F11 / TL84 (Store Fluorescent) | 0.40 | Imperceptible to consumer |
| D65 (Daylight 6500K) | F11 / TL84 (Store Fluorescent) | LED-3000 (Retail Warm LED) | 0.60 | Acceptable commercial match |
| D65 (Daylight 6500K) | F02 (Cool White Fluorescent) | A (Incandescent 2856K) | 0.85 | Moderate split, trim mismatch risk |
| D65 (Daylight 6500K) | LED-4000 (Neutral Retail LED) | A (Incandescent 2856K) | 1.20 | Severe split, rejected for retail bulk |
The shift in retail lighting from traditional fluorescents to energy-efficient LEDs creates fresh metameric issues. Narrow-band LED emissions differ sharply from broad-spectrum fluorescent light, causing established dye recipes to flare unexpectedly. Sourcing specifications now need to mandate modern retail LED illuminants like LED-3000 or LED-4000 in evaluation software to confirm stability under actual store lighting.
Where Does Digital Shade Sorting Fail inside Cutting Rooms?
Automated roll grouping fails when edge-to-edge shade variation across a single bolt exceeds the sorting step size. Digital systems use the 555 algorithm, mapping three-dimensional color space into a grid of numerical boxes around the master standard. Box 555 sits at the center as the target shade, while adjacent numbers indicate light, dark, green, red, yellow, or blue directional steps.
Rolls sharing the same 555 code can be cut together safely, ensuring panel-to-panel consistency across assembled garments.
- Boundary Value Errors occur when rolls on the outer edges of adjacent boxes get paired together despite having a larger delta E gap than rolls within a single box.
- Side-Center-Side Taper Flaws escape detection when swatches are taken only from roll end-tails, hiding cross-web shade drift caused by uneven mangle pressure.
- End-to-End Gradient Shifts affect long rolls, creating gradual shade changes from outer layer to core that single-point 555 readings miss.
- Illuminant Weighting Omissions group rolls correctly under D65 daylight but leave room for severe mismatches under retail spotlights from unmeasured metameric flare.
Automated cutting requires strict physical separation of fabric rolls once sorted into shade groups. Mixing rolls tagged 554 and 556 in a single marker causes sleeve-to-torso shade banding in tailored jackets. Buying contracts often mandate dual-illuminant evaluations to protect assembly plants from panel metamerism on retail floors.
How dye houses will reconcile spectral precision with rising energy costs as mills shift toward low-temperature reactive fixation remains an open question for the industry.
Batch shade variations exceeding 0.8 dE2000 under primary illuminant D65 create visible panel differences in structured garment assembly.
Arbitration
Resolving shade disputes commercially relies on clear contract terms, calibration logs, and independent laboratory verification. When a garment manufacturer rejects fabric over shade variation, liability depends on whether the goods break agreed spectrophotometric limits. Subjective visual checks under non-standard light carry no weight in formal arbitration.
Buyers must produce certified spectral data files, calibration records, and conditioning logs gathered strictly under international test standards.
Setting lab-to-bulk scale-up allowances protects mills from groundless claims while maintaining quality standards. Small lab beaker dyeings operating at a 10:1 liquor ratio show different exhaustion dynamics than industrial jet machines running at 5:1. Purchasing agreements handle this with scale-up offset clauses, permitting up to 0.80 dE2000 between approved lab dips and the initial bulk run ~ provided subsequent bulk batches hold within 0.40 dE2000 of that first bulk lot.
Lab Dip Scaling and Production Offsets
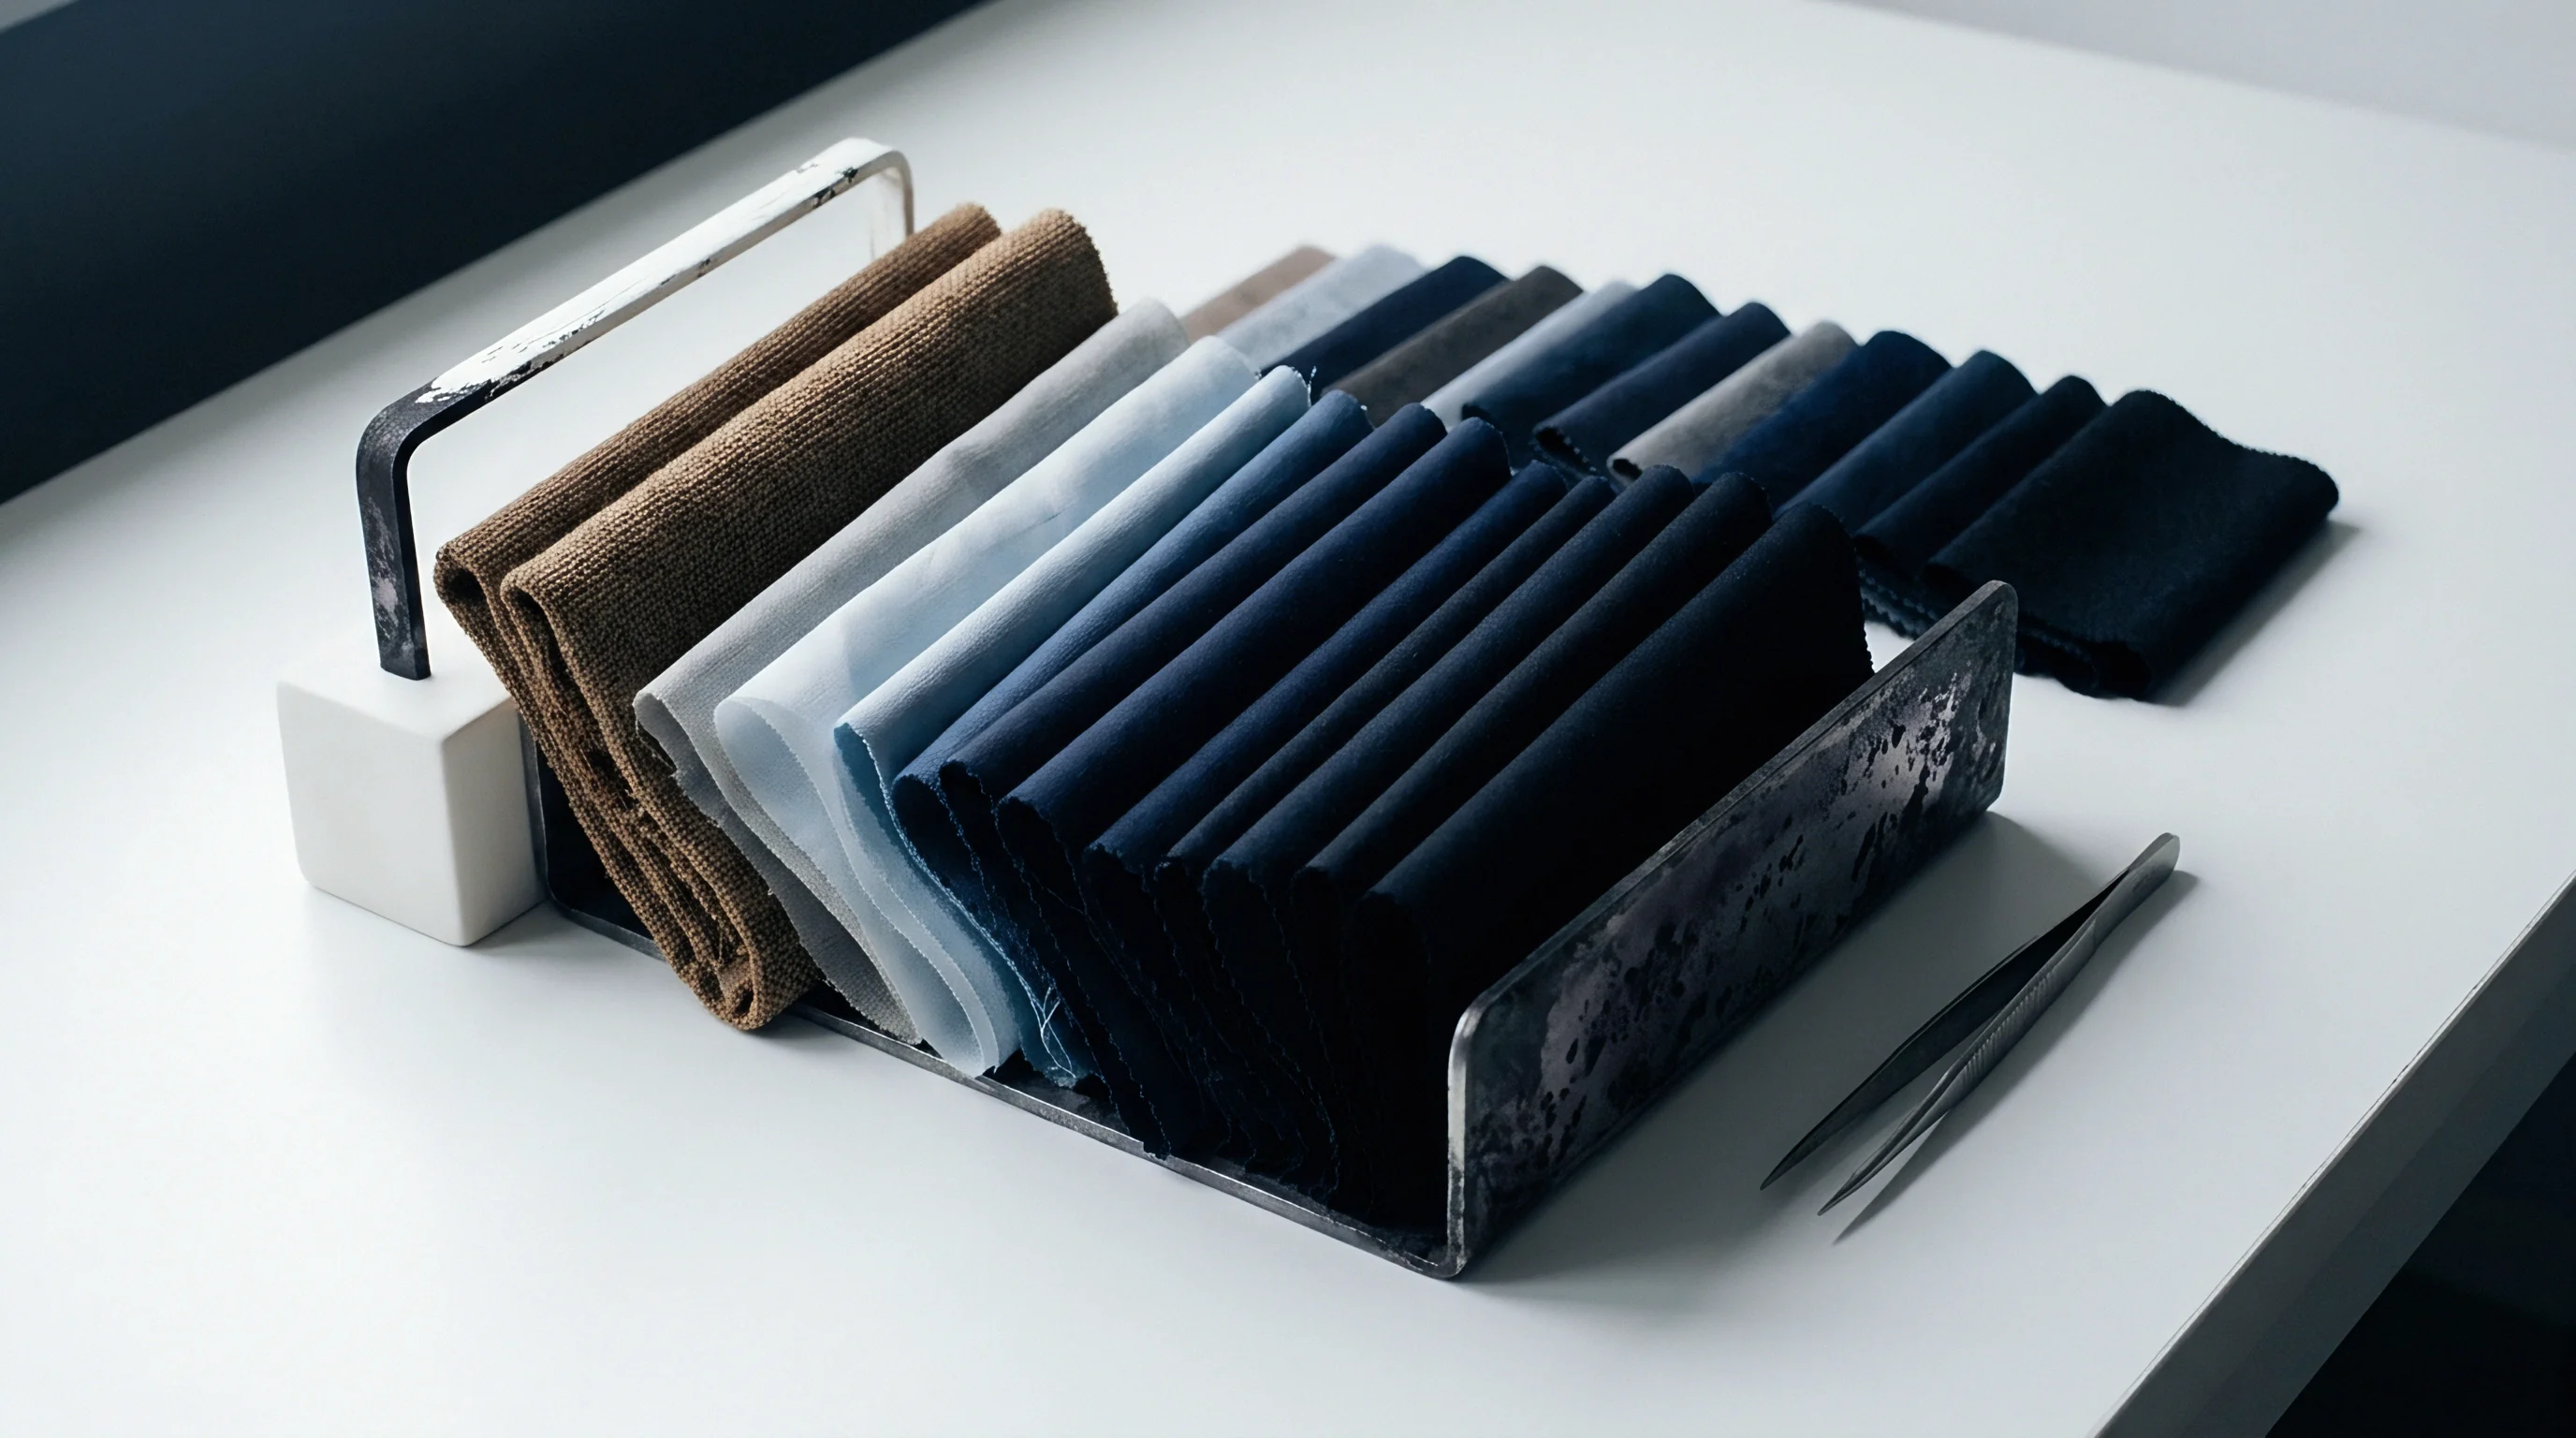
Small beaker dyeings use higher liquor ratios than industrial jet machines, creating consistent color offsets. Recipe software calculates initial dye blends from reflectance measurements on small fiber samples, but moving from a 20-gram swatch to a 500-kilogram production batch introduces different shear forces, heating rates, and liquor speeds. Contracts address this shift by evaluating bulk production against the first approved bulk roll rather than holding the mill strictly to a miniature lab dip.
Master standard protocols prevent digital shade drift over multi-year garment programs. Physical fabric swatches exposed to light, moisture, and handling naturally fade or yellow over time, distorting the reference target. Storing digital masters as fixed CIELAB coordinates or spectral reflectance arrays in a central database eliminates physical swatch decay.
Mills pull digital standards directly over secure links, aligning instruments to the exact same numerical target across global sites.
Contractual Claims and Dispute Resolution
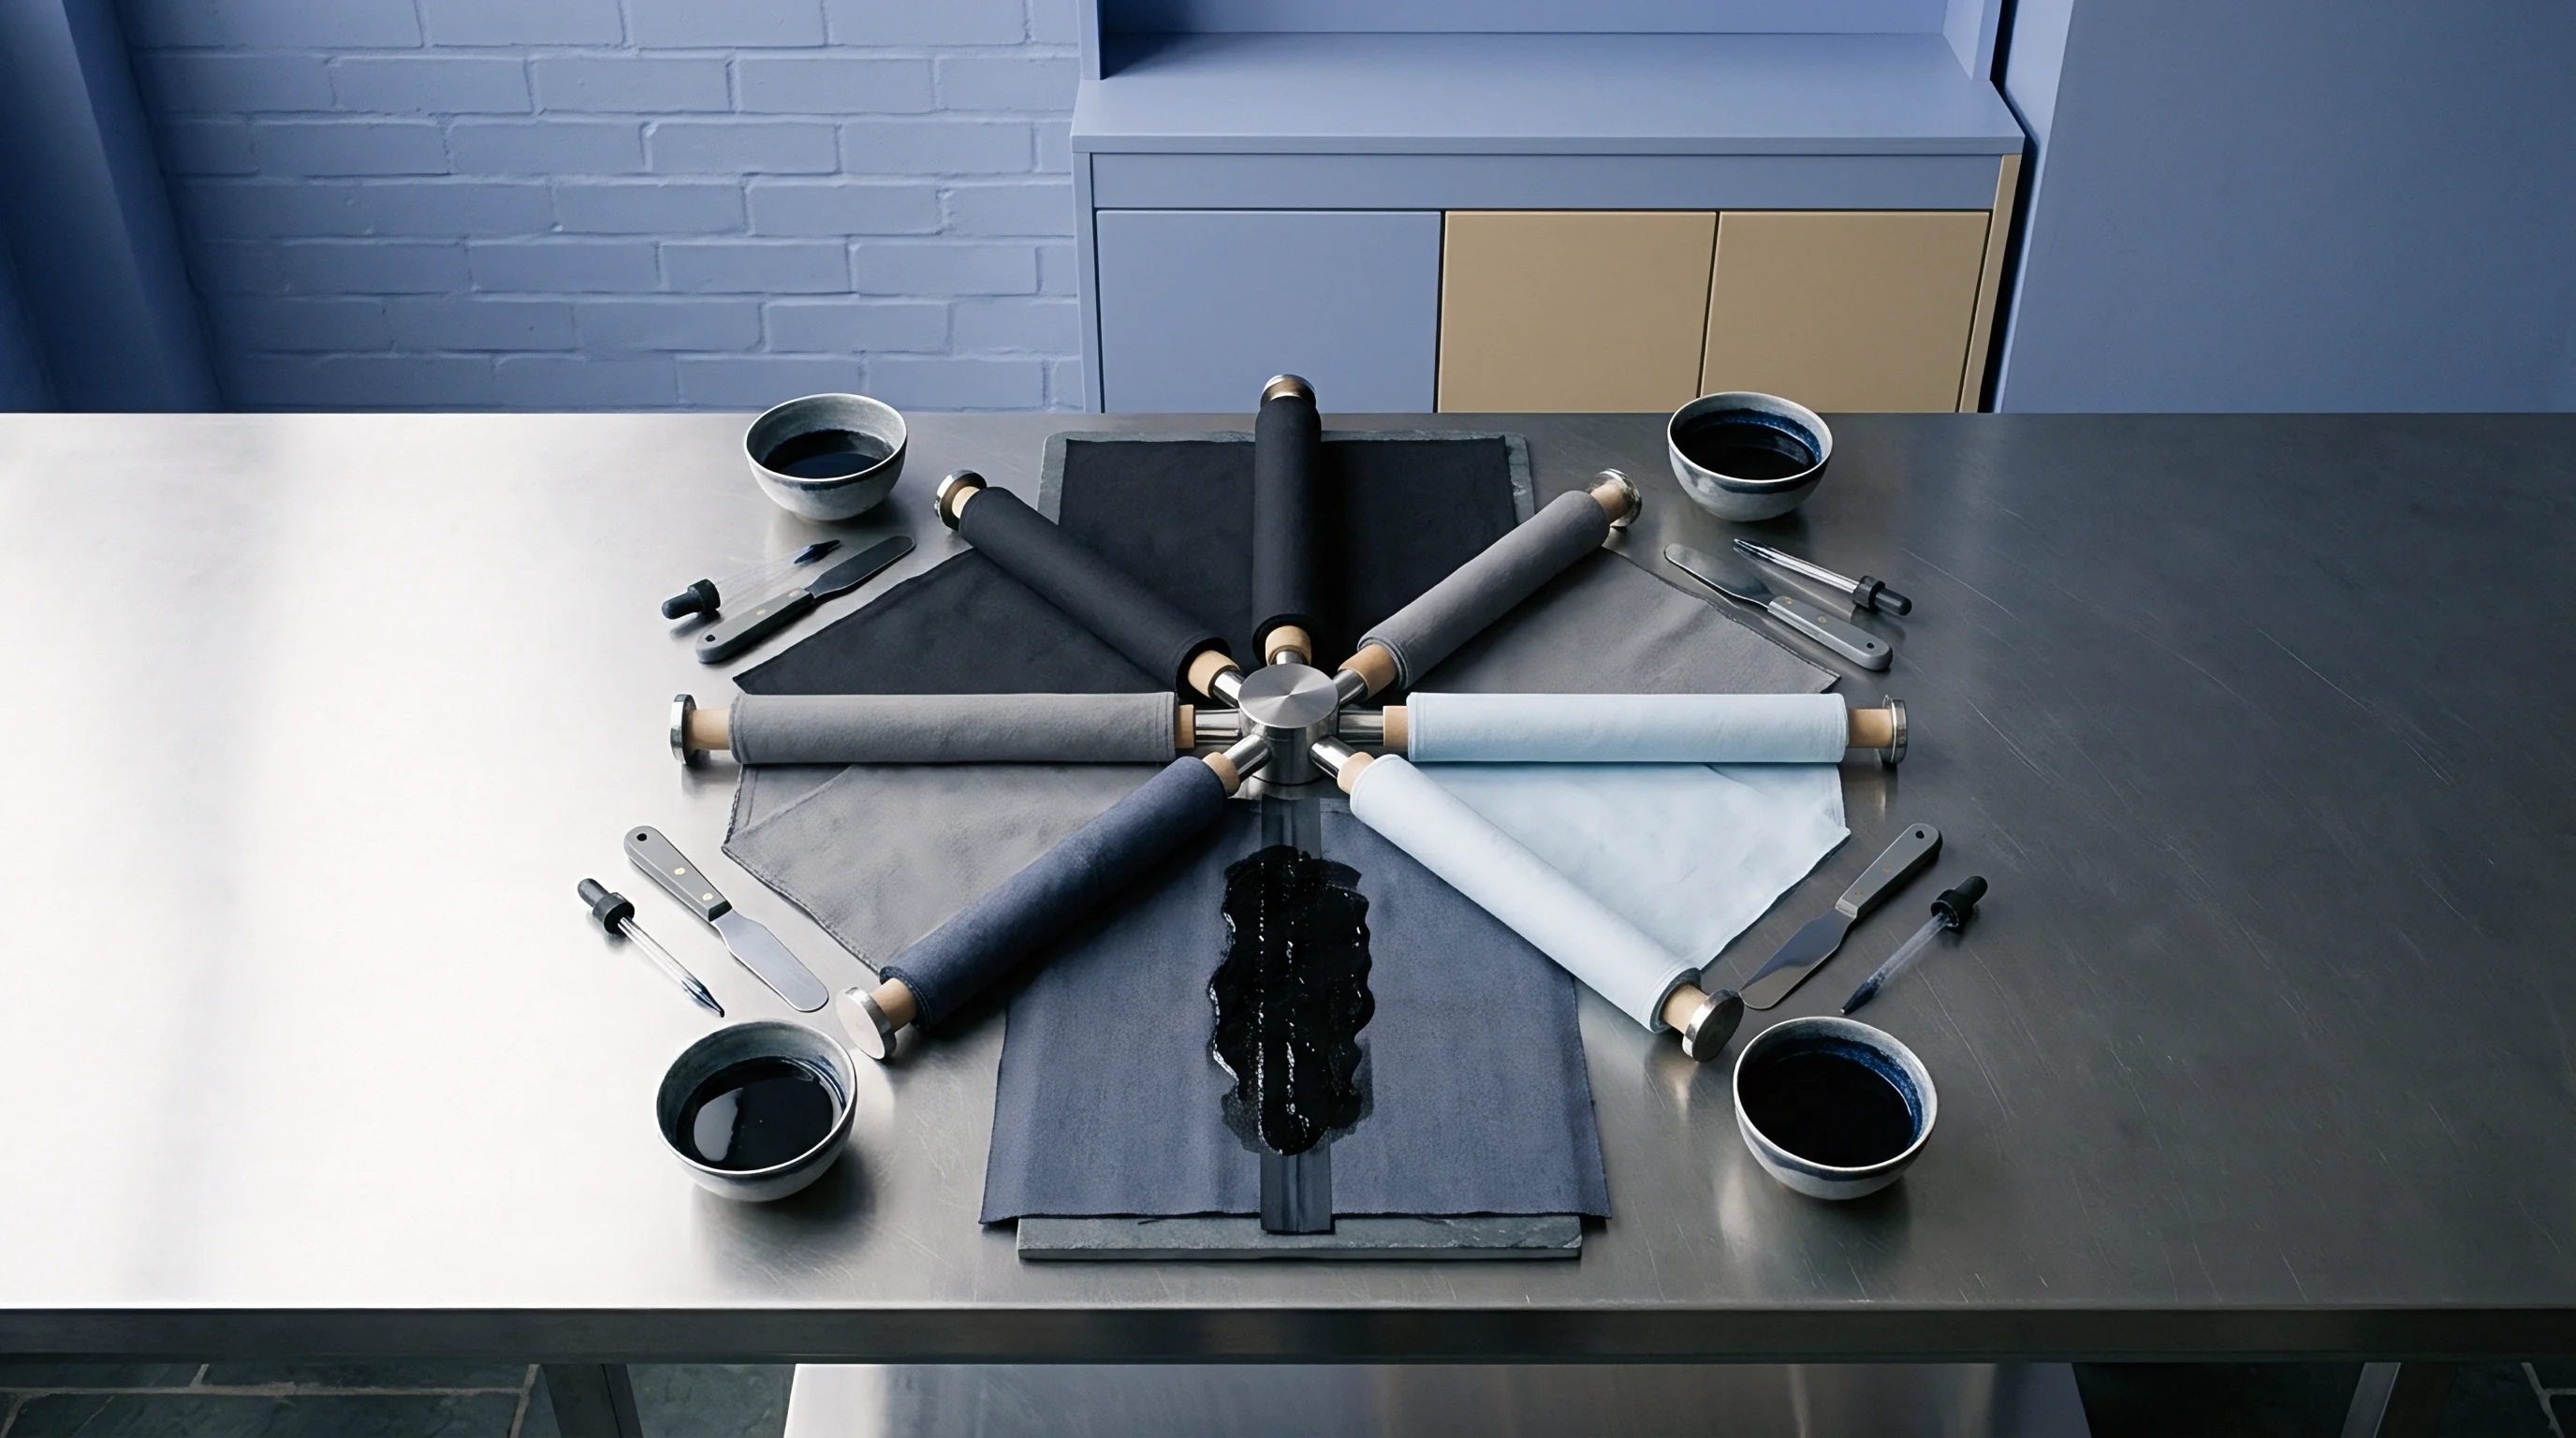
Formal commercial rejections require test reports from accredited third-party laboratories. When a dispute escalates, an independent lab randomly samples ten percent of the disputed rolls, conditions the swatches under ISO 139, and scans them on calibrated d/8 integrating sphere instruments. If third-party tests confirm CIE DE2000 values beyond contract limits under primary or secondary illuminants, the mill or converter assumes financial liability for re-dyeing, replacement freight, and factory downtime penalties.
Clear commercial contracts prevent drawn-out legal battles over shade rejections. Standard purchasing agreements specify primary and secondary illuminants, color difference formulas, dynamic tolerance limits, specular inclusion modes, aperture sizes, and conditioning steps. When mill managers pair calibrated instrument logs with batch samples, color disputes get resolved before fabric ever leaves the warehouse.