Statistical Acceptance Sampling for High Volume Instrument Quality Verification Protocols
Verify high volume raw fibre shipments using ISO 3951 variable sampling to enforce statistical bundle strength and micronaire limits before mill laydown.


Lot
Physical Bale Sampling and Sample Drawing Mechanics
Before raw cotton bales enter the blowroom for opening and blending, mills must check their physical fibre properties. Standard commercial bales weigh roughly 227 kilograms, packed in polypropylene cladding and strapped with wire. Properties drift across even a single ginning lot ~ soil composition, picking dates, gin stand speeds, and saw lint-cleaner adjustments all leave their mark.
Pulling samples from every bale in a 500-bale lot quickly overwhelms receiving docks and testing labs, which makes statistical acceptance sampling the practical route to confirm specifications.
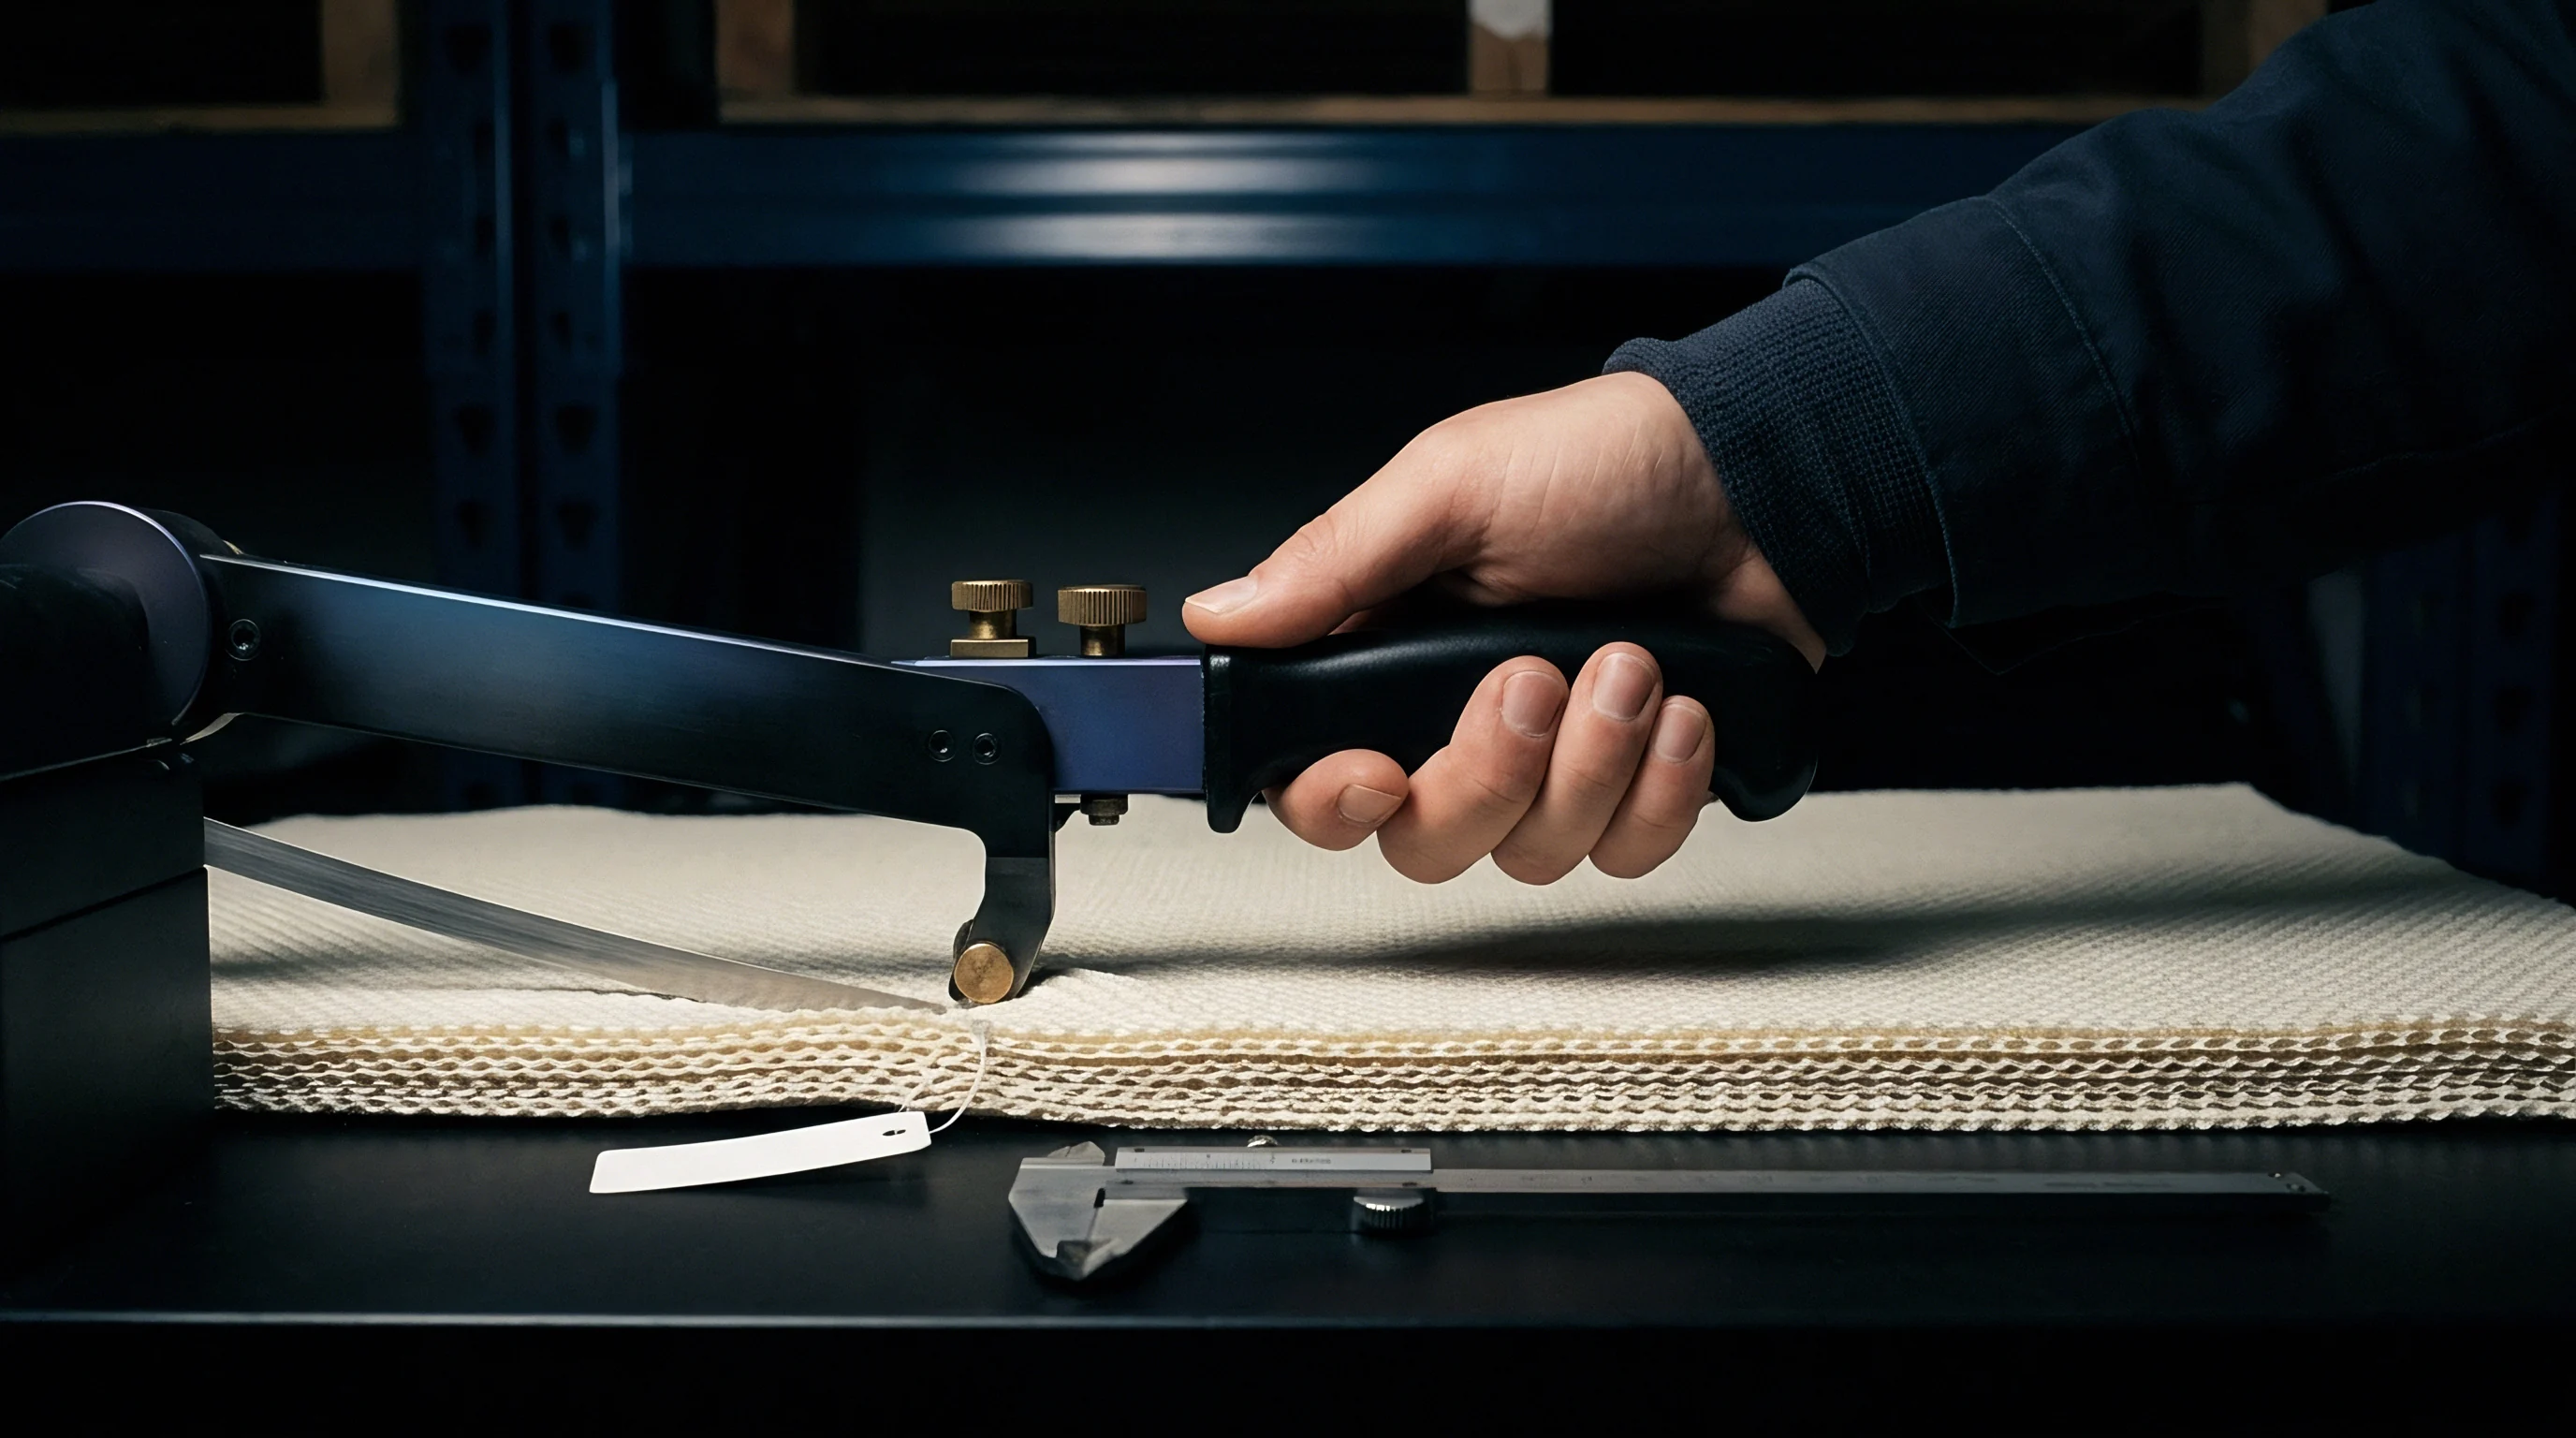
Representative samples must come from deep within the bale body. Surface cotton yields skewed test results, having picked up dust, oxidized, or lost moisture during transport and storage. Samplers drive an automated or manual coupon cutter at least 75 millimetres through the outer layer, drawing two separate coupons of roughly 100 grams from opposite sides of the bale.
Combined, these form a single 200-gram sample for that bale. Workers seal them immediately into moisture-impermeable polyethylene bags so fibre regain does not shift ahead of laboratory conditioning.

Attribute Defect Categories in Fibre Lot Inspection
Receiving protocols sort raw material defects by how severely they disrupt downstream processing, assigning different weights when deciding whether to accept or reject a lot.
- Critical Contamination Defect foreign matter such as polypropylene twine, rubber chips, or metal particles that shred during carding and contaminate entire production runs across the spinning floor.
- Major Classer Grade Outlier color or leaf grades dropping two or more steps below contract terms, pointing to weathering, field rot, or aggressive ginning that forces dyehouse reformulations.
- Minor Linear Density Variance micronaire readings drifting slightly outside the target window without triggering coarse or fine penalties, manageable through small adjustments to the laydown.
- Dimensional Length Defect upper half mean length falling short of the contractual minimum, which directly cuts yarn tenacity and spikes end-break rates on high-speed ring frames.
Without strict random sampling, pockets of defective bales slip through unnoticed. Feeding contaminated or substandard cotton straight into the blowroom triggers yarn breaks, barre streaks in dyed fabric, and line stoppages whose expense dwarfs the cost of intake testing.


Calibration

Standard Reference Materials and Environmental Conditioning
High Volume Instrument (HVI) lines require daily calibration against international standard cottons to keep measurements true. The lines determine micronaire through airflow resistance, length and uniformity with optical fibrographs, and bundle strength by breaking clamped tufts with pneumatic jaws. Laboratory atmosphere directly dictates these readings.
ISO 139 specifies 20 degrees Celsius plus or minus 2 degrees and 65 percent relative humidity plus or minus 4 percent. Any drift in ambient humidity changes fibre moisture regain, shifting measured cotton tenacity by roughly 0.6 percent for every 1.0 percent swing in moisture content.
| Fibre Property | Test Standard | Measurement Unit | Calibration Standard Range | Max Permissible System Drift |
|---|---|---|---|---|
| Micronaire | ASTM D5867 / ISO 2403 | Specific scale unit | 2.60 to 5.50 | plus or minus 0.05 units |
| Upper Half Mean Length | ASTM D5867 / ISO 6989 | Inches / Millimetres | 0.950 in / 24.13 mm to 1.350 in / 34.29 mm | plus or minus 0.012 in / 0.30 mm |
| Length Uniformity Index | ASTM D5867 | Percentage Ratio | 78.0% to 88.0% | plus or minus 0.8% |
| Bundle Strength (Tenacity) | ASTM D5867 / ISO 3060 | Grams per tex (cN/tex) | 22.0 to 38.0 g/tex | plus or minus 1.0 g/tex |
| Short Fibre Index | ASTM D5867 | Percentage by weight | 4.0% to 15.0% | plus or minus 1.0% |
Benchmark calibration cottons supplied by international cotton bodies establish base values for the optical sensors and load cells. Technicians run calibration checks at the start of each eight-hour shift and after every 200 specimens. When drift exceeds the limits in the table, testing halts immediately: operators clear the transport track, run a full calibration cycle with standard cottons, and re-test every bale processed since the previous benchmark passed.

Calibration Failure Excuses and System Verification
Receiving deadlines frequently put calibration routines under pressure. Minor drift in length or strength readings gets attributed to local room drafts rather than sensor wear, standard cottons are assumed to have picked up moisture, or scuffed optical glass is dismissed as harmless to comparative readings. Overlooking calibration drift without a rigorous system audit introduces persistent measurement bias, leading mills to accept fibre shipments that fail spun-yarn strength thresholds in production.

Curves
Operating Characteristic Mechanics and Risk Allocation
Acceptance sampling uses operating characteristic curves to balance producer risk against consumer risk. Producer risk, or alpha, is the probability that sampling variation causes an acceptable shipment meeting contract specifications to be rejected. Consumer risk, or beta, is the chance that an off-spec lot containing unacceptable defect rates passes inspection and enters production.
An operating characteristic curve plots the true defect rate of an incoming lot against its probability of acceptance under a given sampling plan.
| Statistical Metric | ISO 2859-1 Attribute Plan (Level II) | ISO 3951-1 Variable Plan (s-Method) |
|---|---|---|
| Sample Size (Bales) | 80 bales | 20 bales |
| Acceptance Quality Limit (AQL) | 1.5% non-conforming | 1.5% non-conforming |
| Limiting Quality / LTPD (Beta = 10%) | 6.5% non-conforming | 5.2% non-conforming |
| Decision Rule Mechanism | Count non-conforming units against c=3 | Calculate mean and standard deviation against k=1.82 |
| Destructive / Labor Requirement | High sample drawing labor | Low sample drawing labor |
| Measurement Information Yield | Pass or Fail binary count | Mean, variance, and distribution metrics |
Under ISO 2859-1, attribute inspection simply tallies each sampled bale as conforming or non-conforming. In contrast, variable inspection under ISO 3951-1 evaluates the actual numerical distribution, tracking the sample mean and standard deviation. Variable schemes deliver the same statistical discrimination and confidence with far fewer bales ~ cutting sample drawing and lab prep by up to 75 percent while generating detailed variance figures needed for laydown planning.
Attribute acceptance schemes require larger sample sizes than variable plans because they discard continuous measurement data in favor of binary counts.

Required Verification Plan Documentation
An audit-ready verification process depends on thorough records covering sampling, conditioning, and testing. To hold up in commercial arbitration, purchase contracts have to state the exact statistical sampling rules upfront.
- Sampling Method Specification protocol detailing probe depths, coupon weight, and moisture-barrier packaging per ISO 1130 or ASTM D1441.
- Environmental Log Summary continuous temperature and relative humidity recordings verifying compliance with ISO 139 conditions throughout the test sequence.
- Calibration Proof Dossier instrument log sheets demonstrating that sensor drift stayed within allowable tolerances immediately before and after testing the lot.
- Statistical Parameter Contract contractual terms defining the Acceptance Quality Limit, Lot Tolerance Percent Defective, alpha and beta risk levels, and the referenced standard plan.
Buying contracts that state fibre properties without specifying the statistical sampling plan offer little real protection. If a contract lists a micronaire range of 3.8 to 4.2 without stipulating sample size, test method, and an acceptance quality limit, a shipper can simply re-sample a rejected lot until random variation delivers a passing result.

Calculation

Worked Mathematical Scenario for Variable Sampling Plan
Evaluating a 500-bale delivery under a variable sampling scheme requires following strict numerical criteria. Take an HVI verification protocol for bundle strength on a 500-bale lot of combed cotton. The contract sets the lower specification limit for strength at 28.0 grams per tex.
The agreed parameters call for an Acceptance Quality Limit of 1.5 percent, using Special Inspection Level S-4 from ISO 3951-1 under the single sampling method with unknown standard deviation.
For 500 bales, ISO 3951-1 tables for Level S-4 point to Sample Size Code Letter F, requiring 20 bales. The lab draws 20 random samples from the lot, brings them to equilibrium moisture regain, and measures bundle tenacity on calibrated equipment. The 20 strength readings (in grams per tex) are: 29.2, 28.5, 30.1, 27.8, 29.5, 28.8, 27.4, 31.0, 28.9, 29.7, 28.2, 30.4, 27.9, 29.1, 28.6, 29.8, 30.2, 28.4, 27.6, 29.0.
The lot disposition follows a five-step evaluation sequence:
- Sum the 20 readings to get 578.6 grams per tex, and divide by 20 to find the sample mean: 28.930 grams per tex.
- Calculate sample standard deviation using 19 degrees of freedom. The sum of squared deviations from the mean is 18.242, giving a sample variance of 0.960. Taking the square root yields a standard deviation of 0.980 grams per tex.
- Determine the lower quality index, Q sub L, by subtracting the lower specification limit (28.0 grams per tex) from the mean (28.930 grams per tex) and dividing by the standard deviation (0.980 grams per tex). This yields Q sub L = 0.949.
- Find the acceptability constant, k, in the ISO 3951-1 tables for normal inspection under Code Letter F (sample size 20) at an AQL of 1.5 percent. The tabulated constant k is 1.620.
- Compare Q sub L against k. Acceptance requires Q sub L to be greater than or equal to k. Here, 0.949 is less than 1.620.
Because Q sub L falls short of k, the lot fails acceptance. While the sample average of 28.930 grams per tex sits comfortably above the 28.0 grams per tex cut-off, the standard deviation of 0.980 indicates that more than 1.5 percent of the bales in the shipment likely fall below the contractual minimum. The mill either rejects the 500-bale lot outright or diverts it to lower-count rotor spinning.


Arbitration

Interlaboratory Bias and Split Sample Protocols
When receiving results clash with shipper quality certificates, re-testing protocols must separate true bale variation from interlaboratory machine offsets. Merchants routinely contest buyer rejections by pointing to testing differences between labs. Settling these disputes cleanly requires a pre-established arbitration procedure using split samples evaluated blindly by neutral reference laboratories.
Split-sample testing relies on the reserve coupons pulled during original intake. Technicians divide each reserve sample into three equal portions: one stays with the buyer, the second goes to the seller, and the third is sent to an independent testing facility accredited by international cotton bodies. Before testing, all three laboratories run calibration checks against identical benchmark standard cottons.
Interlaboratory offset disputes must be governed by pre-agreed tolerance thresholds that account for inherent testing instrument variance before triggering financial penalties.

How Does Split Sample Retesting Resolve Interlaboratory Bias?
Resolving offsets means separating machine calibration bias from genuine sample variability. The referee data is compared against mill and merchant records using paired t-tests. If the average difference between the buyer’s lab and the reference facility stays within the tolerance limits laid out in ASTM D7785, the buyer’s original rejection stands.
If the reference facility confirms the merchant’s figures within those limits, the buyer takes the lot and pays the arbitration costs. For bundle strength, the permissible difference band is 1.0 gram per tex; for micronaire, it is 0.10 units.
When HVAC or conditioning systems drift during arbitration, shifting moisture regains create artificial differences between laboratories. A 5 percent fluctuation in relative humidity in the testing room changes measured tenacity by roughly 0.5 grams per tex. Whether prevailing trade rules sufficiently penalize testing facilities that let atmospheric conditions wander outside ISO 139 limits remains a recurring dispute among commercial controllers.


Disposition

Commercial Discount Schedules and Tariff Reclassifications
Deciding whether to take or reject an off-spec cotton lot usually comes down to contract discount tables and customs duties. Outright rejection and return freight carry heavy shipping, demurrage, and downtime costs that neither party wants to absorb. Spinning mills often prefer to negotiate price allowances to offset the processing penalties of running lower-grade lint.
| Fibre Attribute | Contract Spec Range | Measured Lot Level | Commercial Penalty / Price Allowance |
|---|---|---|---|
| Micronaire High | 3.80 to 4.20 | 4.30 to 4.50 | 1.5% discount on contract base price |
| Micronaire Premium Discount | 3.80 to 4.20 | Above 5.00 (Coarse) | 5.0% discount or right of absolute refusal |
| Micronaire Low (Fine) | 3.80 to 4.20 | 3.30 to 3.49 | 3.0% discount due to high nepping potential |
| Short Fibre Index High | Below 8.0% | 10.1% to 12.0% | 2.5% discount due to elevated comb waste |
| Length Deficit | Min 1.125 inches | 1.080 to 1.100 inches | 4.0% discount due to lower yarn tenacity |
Commercial contracts generally compound these allowances when a lot fails multiple quality checks at once. A shipment testing low in both micronaire and bundle tenacity triggers cumulative discounts, driving down the net fibre price to offset expected yarn breaks and reduced frame speeds.
Quality verification failures can also upset customs classifications and preferential trade claims. The Harmonized Tariff Schedule splits raw cotton subheadings by staple length, drawing sharp lines at thresholds like 28.575 millimetres. If intake sampling shows a lot entered as long-staple cotton falls short of that statutory cut-off, customs authorities reclassify the cargo into a shorter staple code.
That reclassification can trigger higher duty rates, retroactive assessments, and penalties for inaccurate declaration. Mills that tie receiving test data directly to customs paperwork protect themselves against surprise changes in landed cost.
Taking discounted off-spec bales makes economic sense only if the mill has the blending capacity and inventory depth to dilute poor fibre properties across stronger lots in the laydown.