Textile Roll Positional Sampling Basics for Incoming Compliance
Positional sampling across fabric width and core layers isolates hidden finishing gradients to prevent non-conforming textile lots from reaching production.

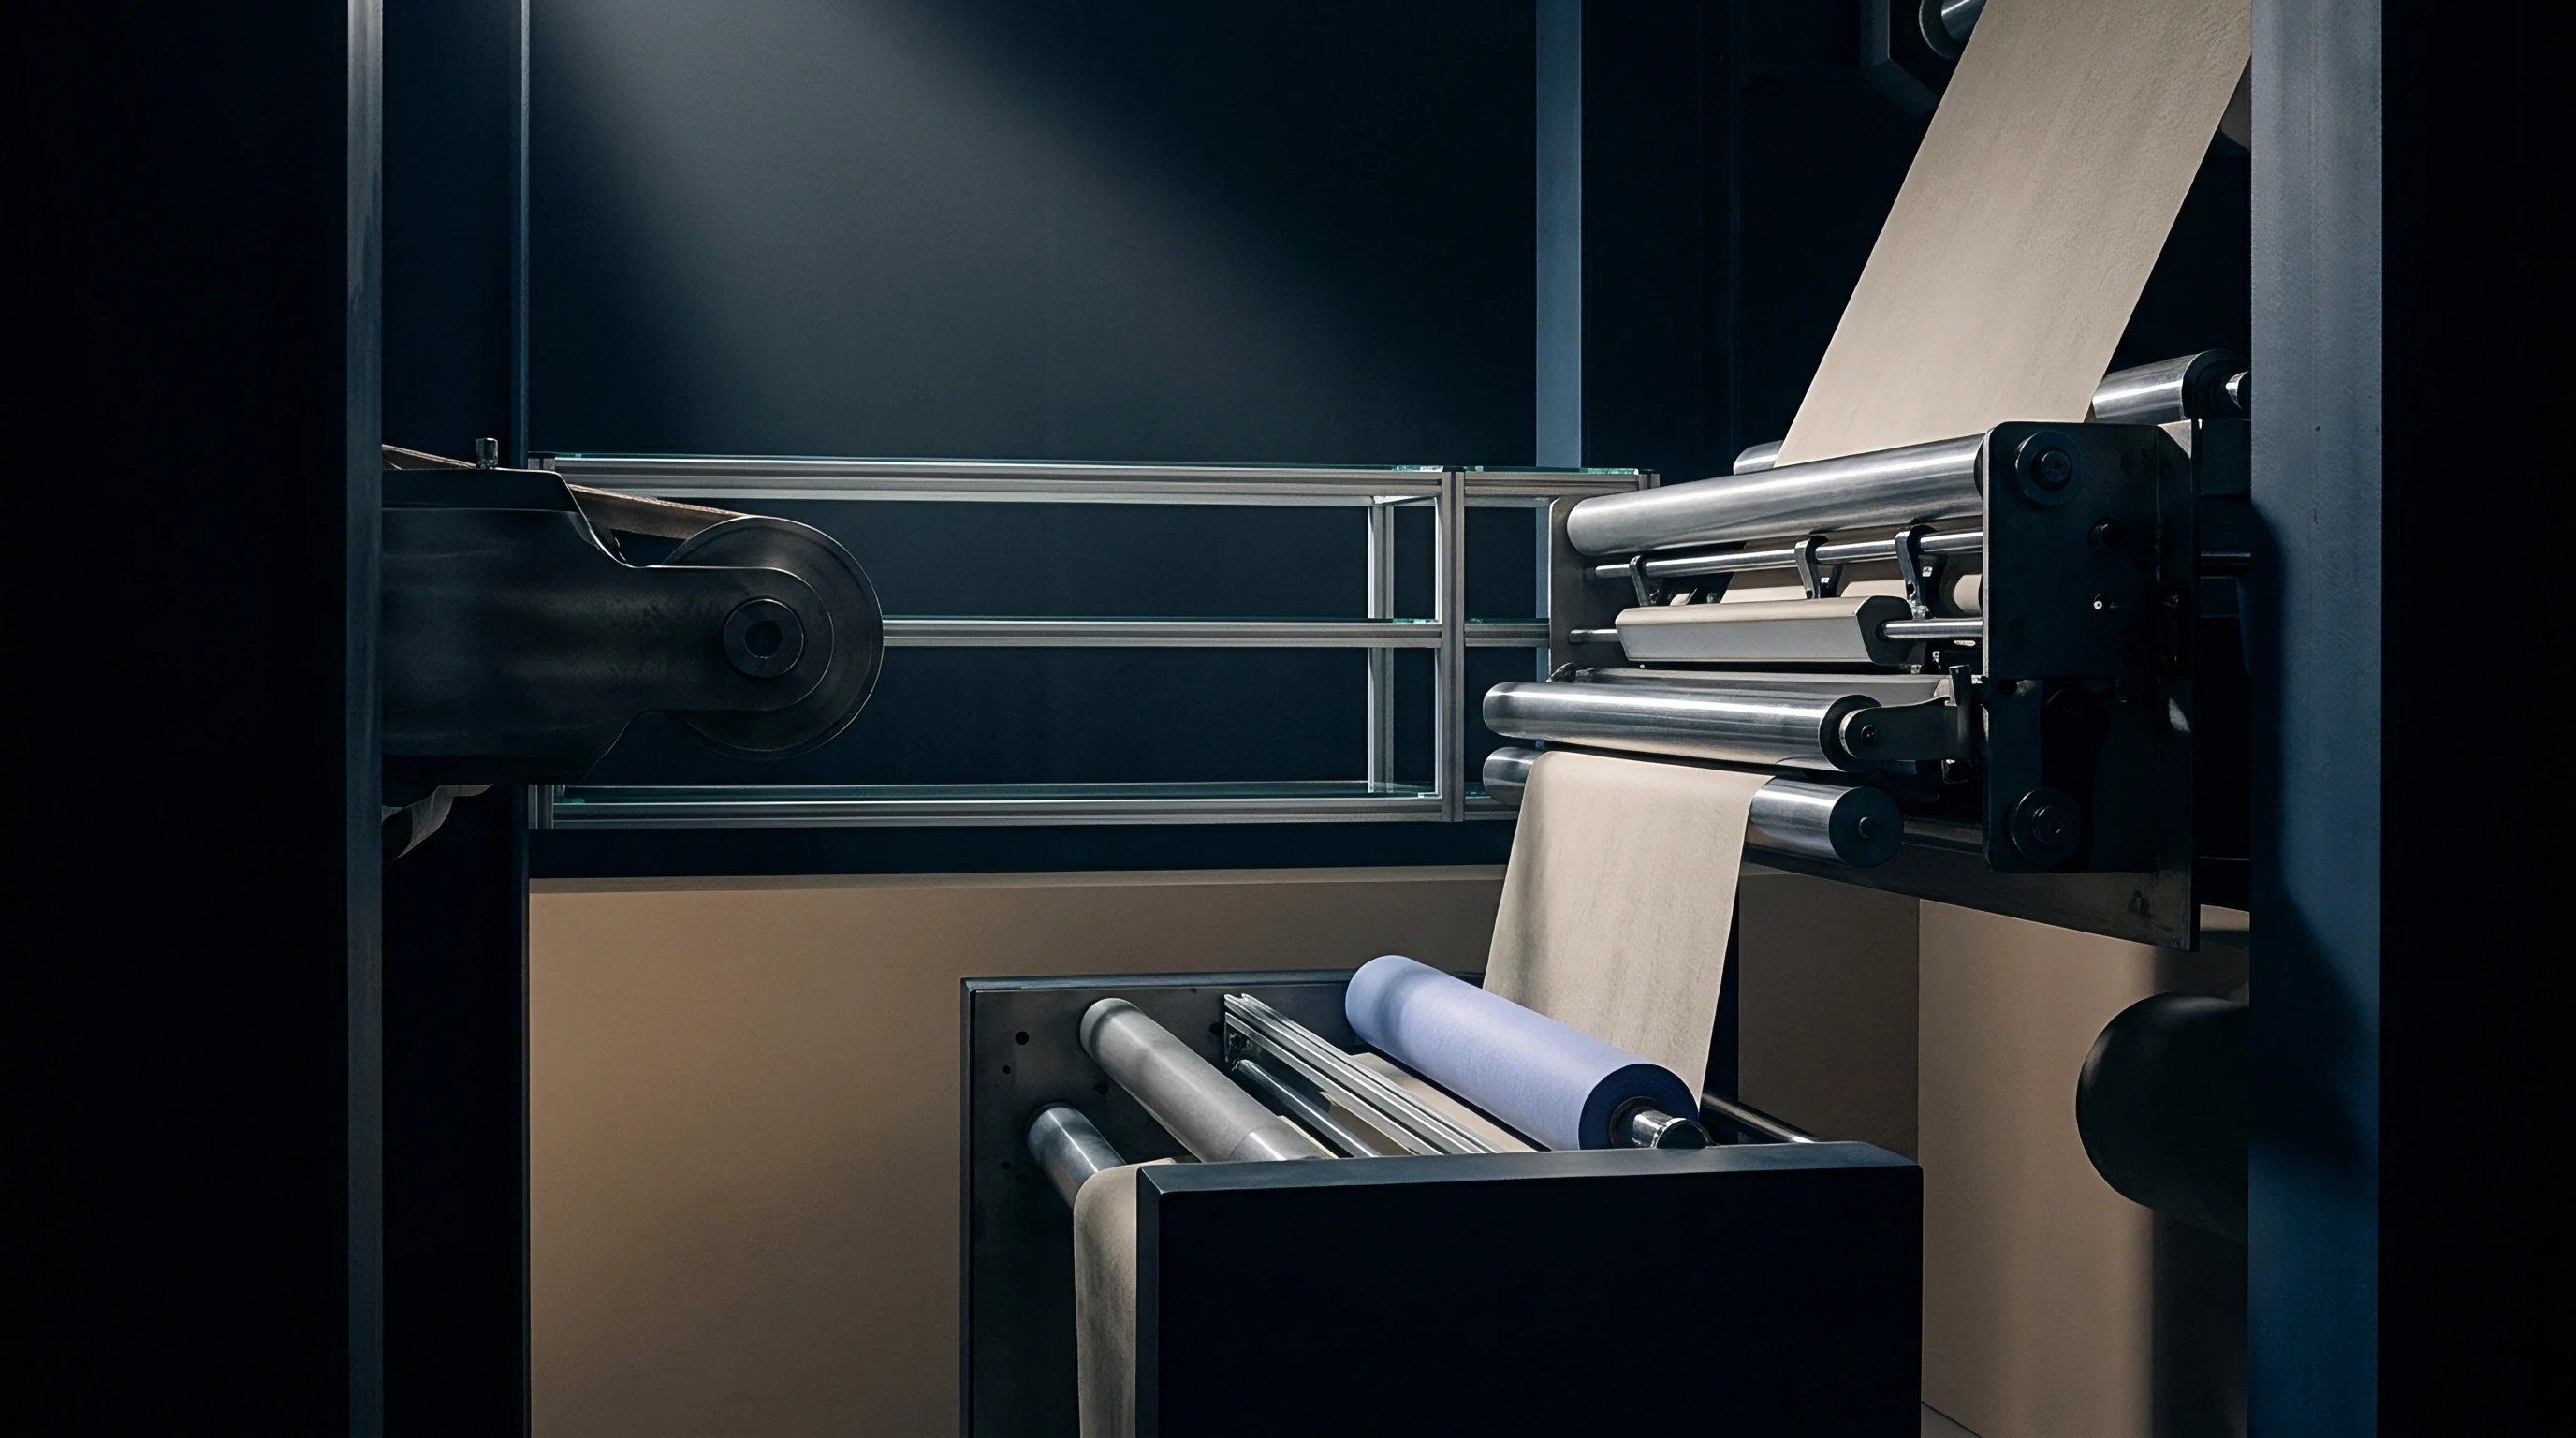
Selvedge
Fabric rolls arriving at compliance docks carry invisible chemical and physical gradients from wet finishing. Across the width of the textile web, continuous finishing equipment applies uneven physical forces. As woven or knitted fabric moves through a liquor padder into a stenter frame, liquid pickup, drying rates, and mechanical tension vary between the edges and the center strip.
Sampling only an easily reached outer corner gives data that fails to reflect the roll as a whole. Effective compliance screening requires sampling across the full fabric width to catch localized non-conformities before material reaches the cutting floor.
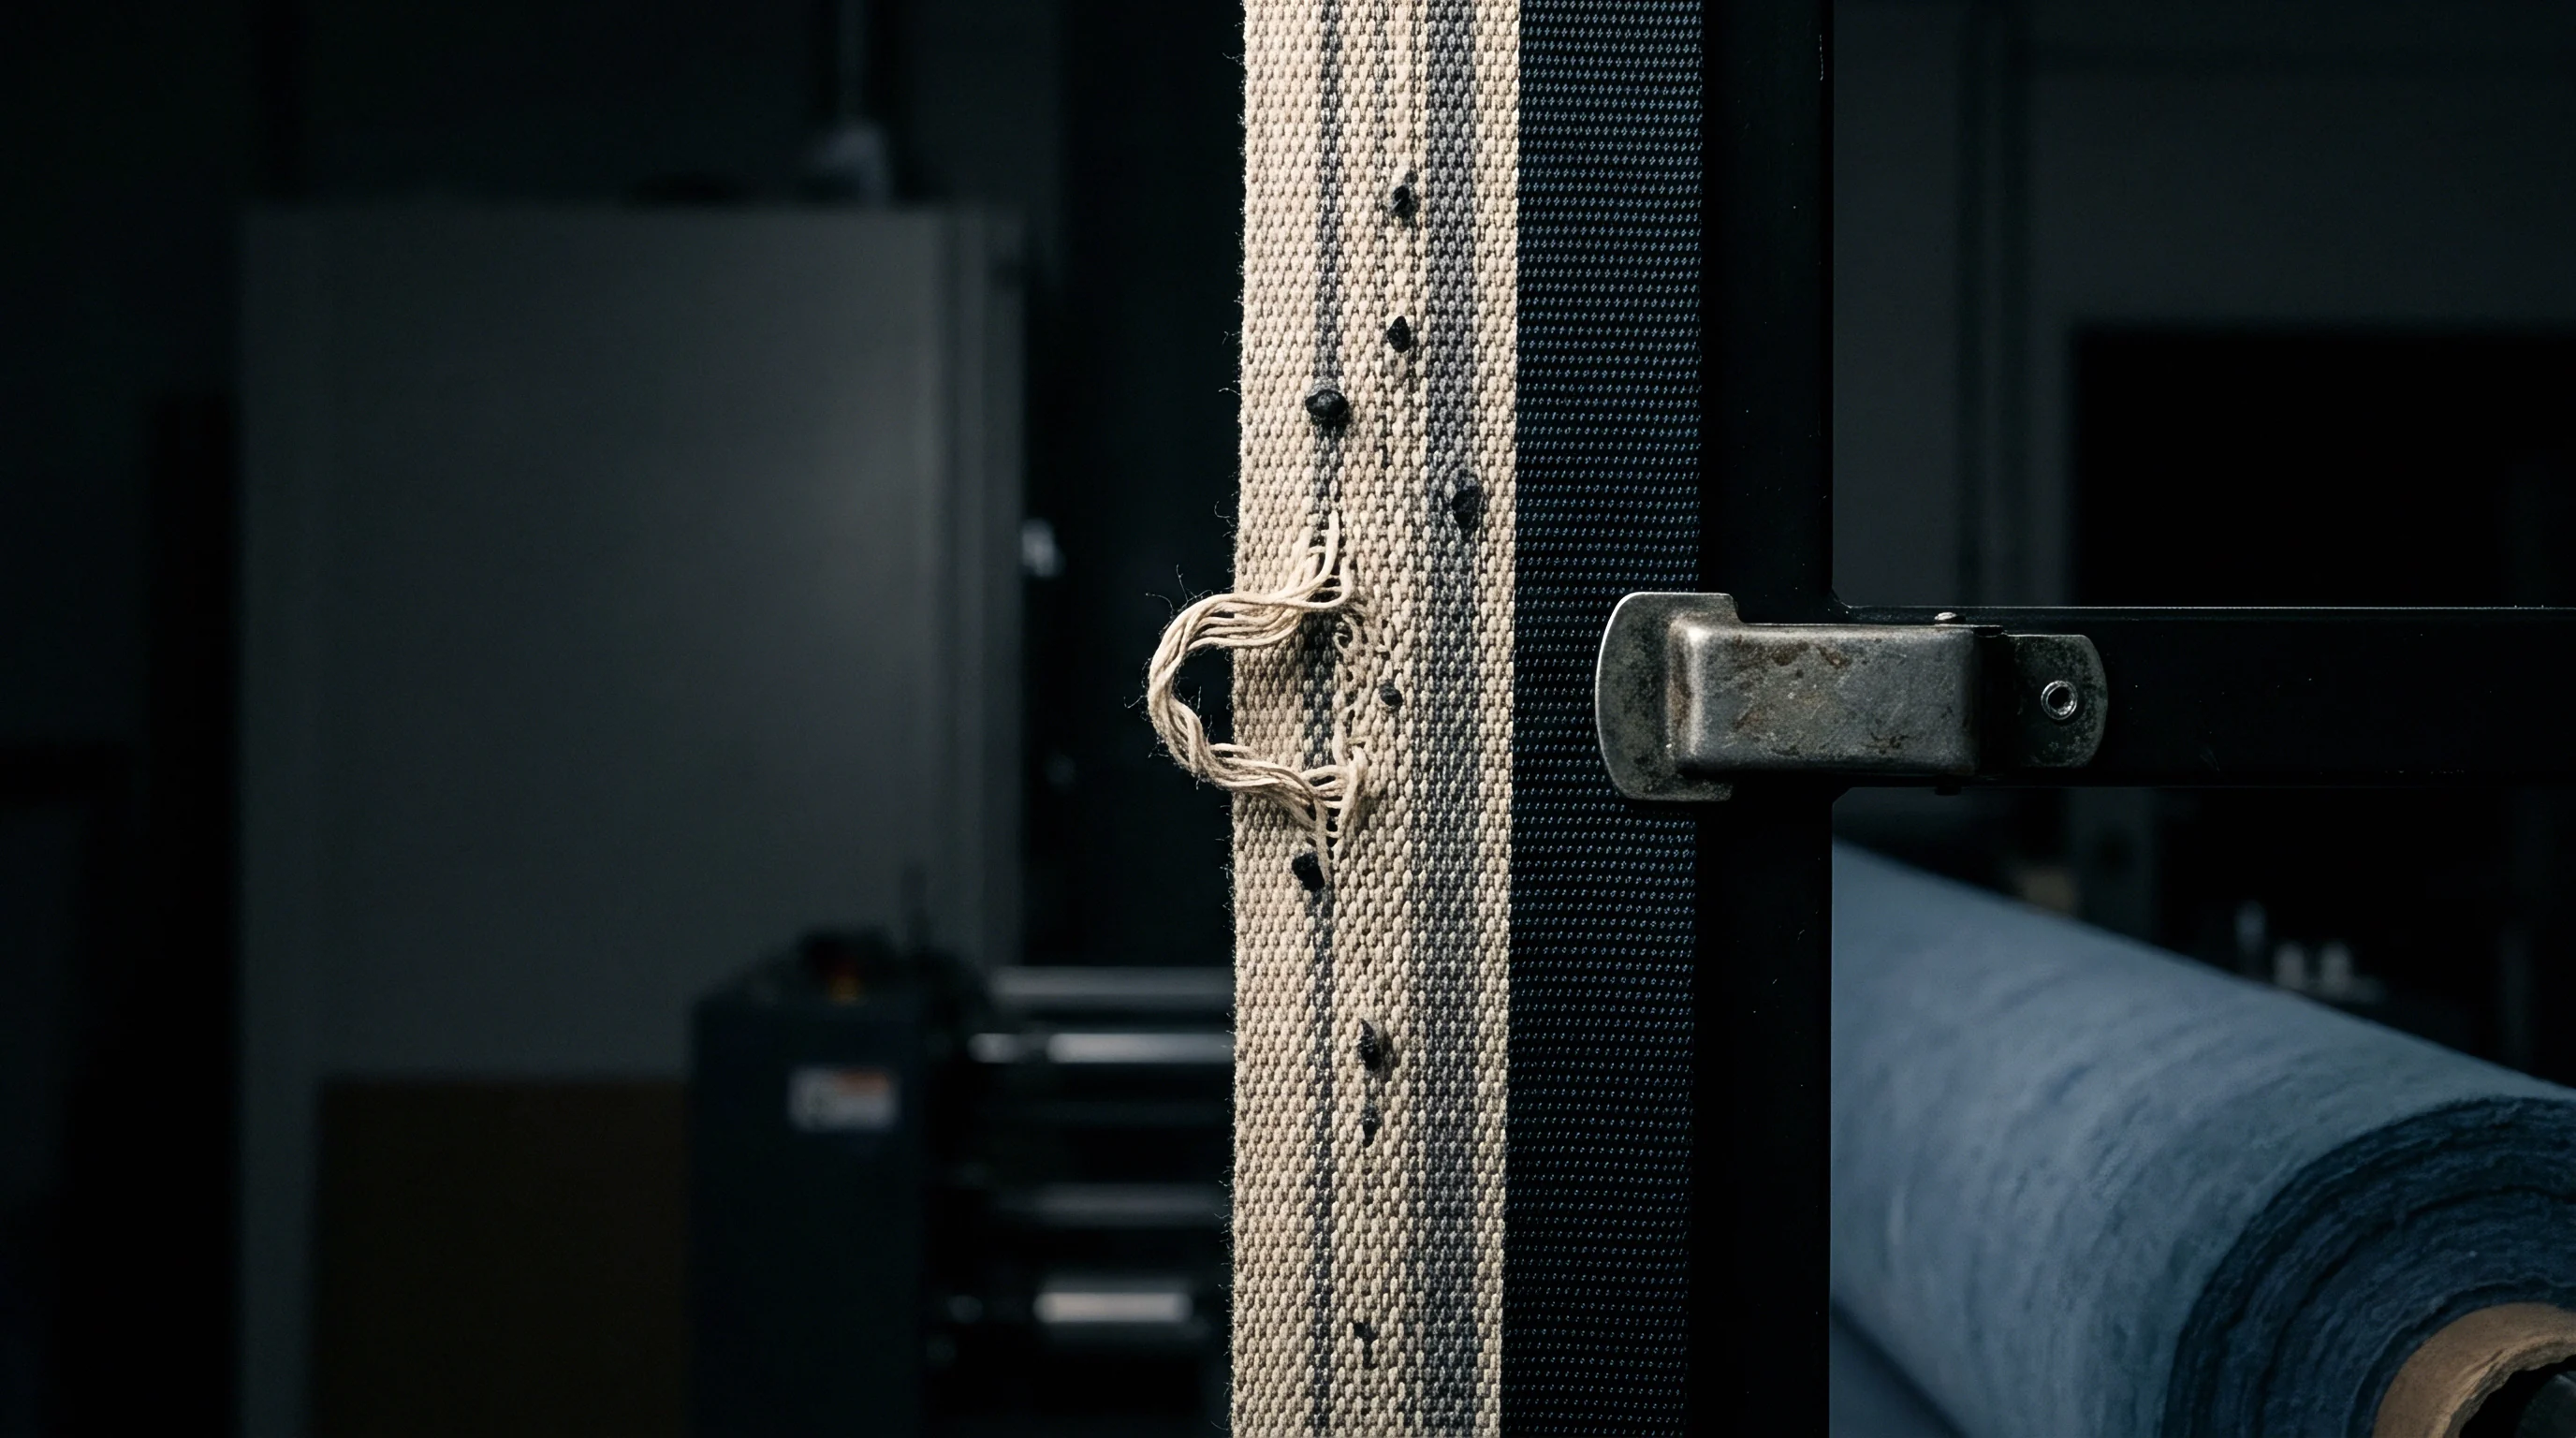
Fabric margins differ structurally from the main body of the cloth. Edges often feature specialized weave patterns, denser yarn counts, or pin holes meant to hold the web under tension through high-temperature drying zones. These structural features alter both thermal mass and liquid retention.
When wet fabric moves through heating chambers, water evaporates fastest along the outer borders where air velocity peaks. That rapid evaporation generates a surface tension gradient, pulling dissolved finishes, unfixed dyes, and functional auxiliaries from the middle of the roll toward its outer margins.
Chemical concentrations shift across the fabric width, creating an Edge-Middle-Edge gradient. Durable water repellents, fluorinated soil release agents, flame retardants, and resin crosslinkers follow fluid pathways toward areas of highest heat transfer. An inspection team testing only the outer margin might measure acceptable levels of a regulated fluorochemical or free formaldehyde, while the center of the roll lacks enough chemistry to perform as intended.
Alternatively, auxiliaries migrating outward can build up at the margins until they exceed limits set by REACH Annex XVII or brand restricted substance lists.
Relying on edge specimens to represent the entire roll introduces substantial sampling error when evaluating water repellency, tear strength, or formaldehyde content. Positional sampling protocols establish fixed extraction coordinates along the transverse axis to map widthwise variation. A standard three-point protocol takes samples from the left margin, exact center, and right margin, while five-point protocols add mid-left and mid-right sampling points to capture non-linear drying profiles on wide stenter frames.

Transverse Finish Distribution across Stenter Width
Air movement in the drying zone drives liquid toward the outer boundary pins. Stenter nozzles deliver heat directly to the top and bottom surfaces, but air velocity usually spikes near the mechanical clip or pin chains. As water boils off at the margins, capillary action pulls wet liquor outward from the center, concentrating non-volatile compounds along the outer twenty centimeters of the web.
High-velocity drying runs frequently leave the area near the stenter pins noticeably depleted of finish.
How functional chemistry distributes across the fabric width depends on drying speed, temperature, and liquor viscosity. Silicones, fluoropolymers, and halogenated flame retardants migrate at different rates during the constant-rate drying phase, with low-solids padding formulations moving much more aggressively than heavy, high-viscosity coatings. The table below outlines common physical and chemical failure modes driven by transverse finishing gradients on industrial stenter lines.
- Edge Stiffening and Color Shade Variation occurs when high dye and resin concentrations migrate laterally, producing visible center-to-edge color shading and localized flexural rigidity variations that disrupt garment assembly.
- Sub-Standard Center Water Repellency results from fluorochemical depletion in the central zone, causing hydrophobic performance to drop below spray rating thresholds while edge specimens meet technical specifications.
- Localized Restricted Substance Exceedance develops when residual crosslinking catalysts or unreacted monomer resins concentrate at fabric margins, pushing localized formaldehyde or organotin content above OEKO-TEX STANDARD 100 Class I thresholds.
- Asymmetric Mechanical Strength arises from uneven heat distribution across stenter width, causing differential thermal degradation of synthetic fibers or uneven crosslinking of cellulosic chains that weakens tear resistance along one margin.
Temperature variations as small as three degrees Celsius between stenter nozzles accelerate liquid migration toward the hotter zone. Once the fabric hits curing temperature, that chemical imbalance locks permanently into the fiber matrix. Sampling protocols need to isolate left-edge specimens from right-edge specimens to catch these asymmetries, rather than assuming a symmetrical profile across the center axis.
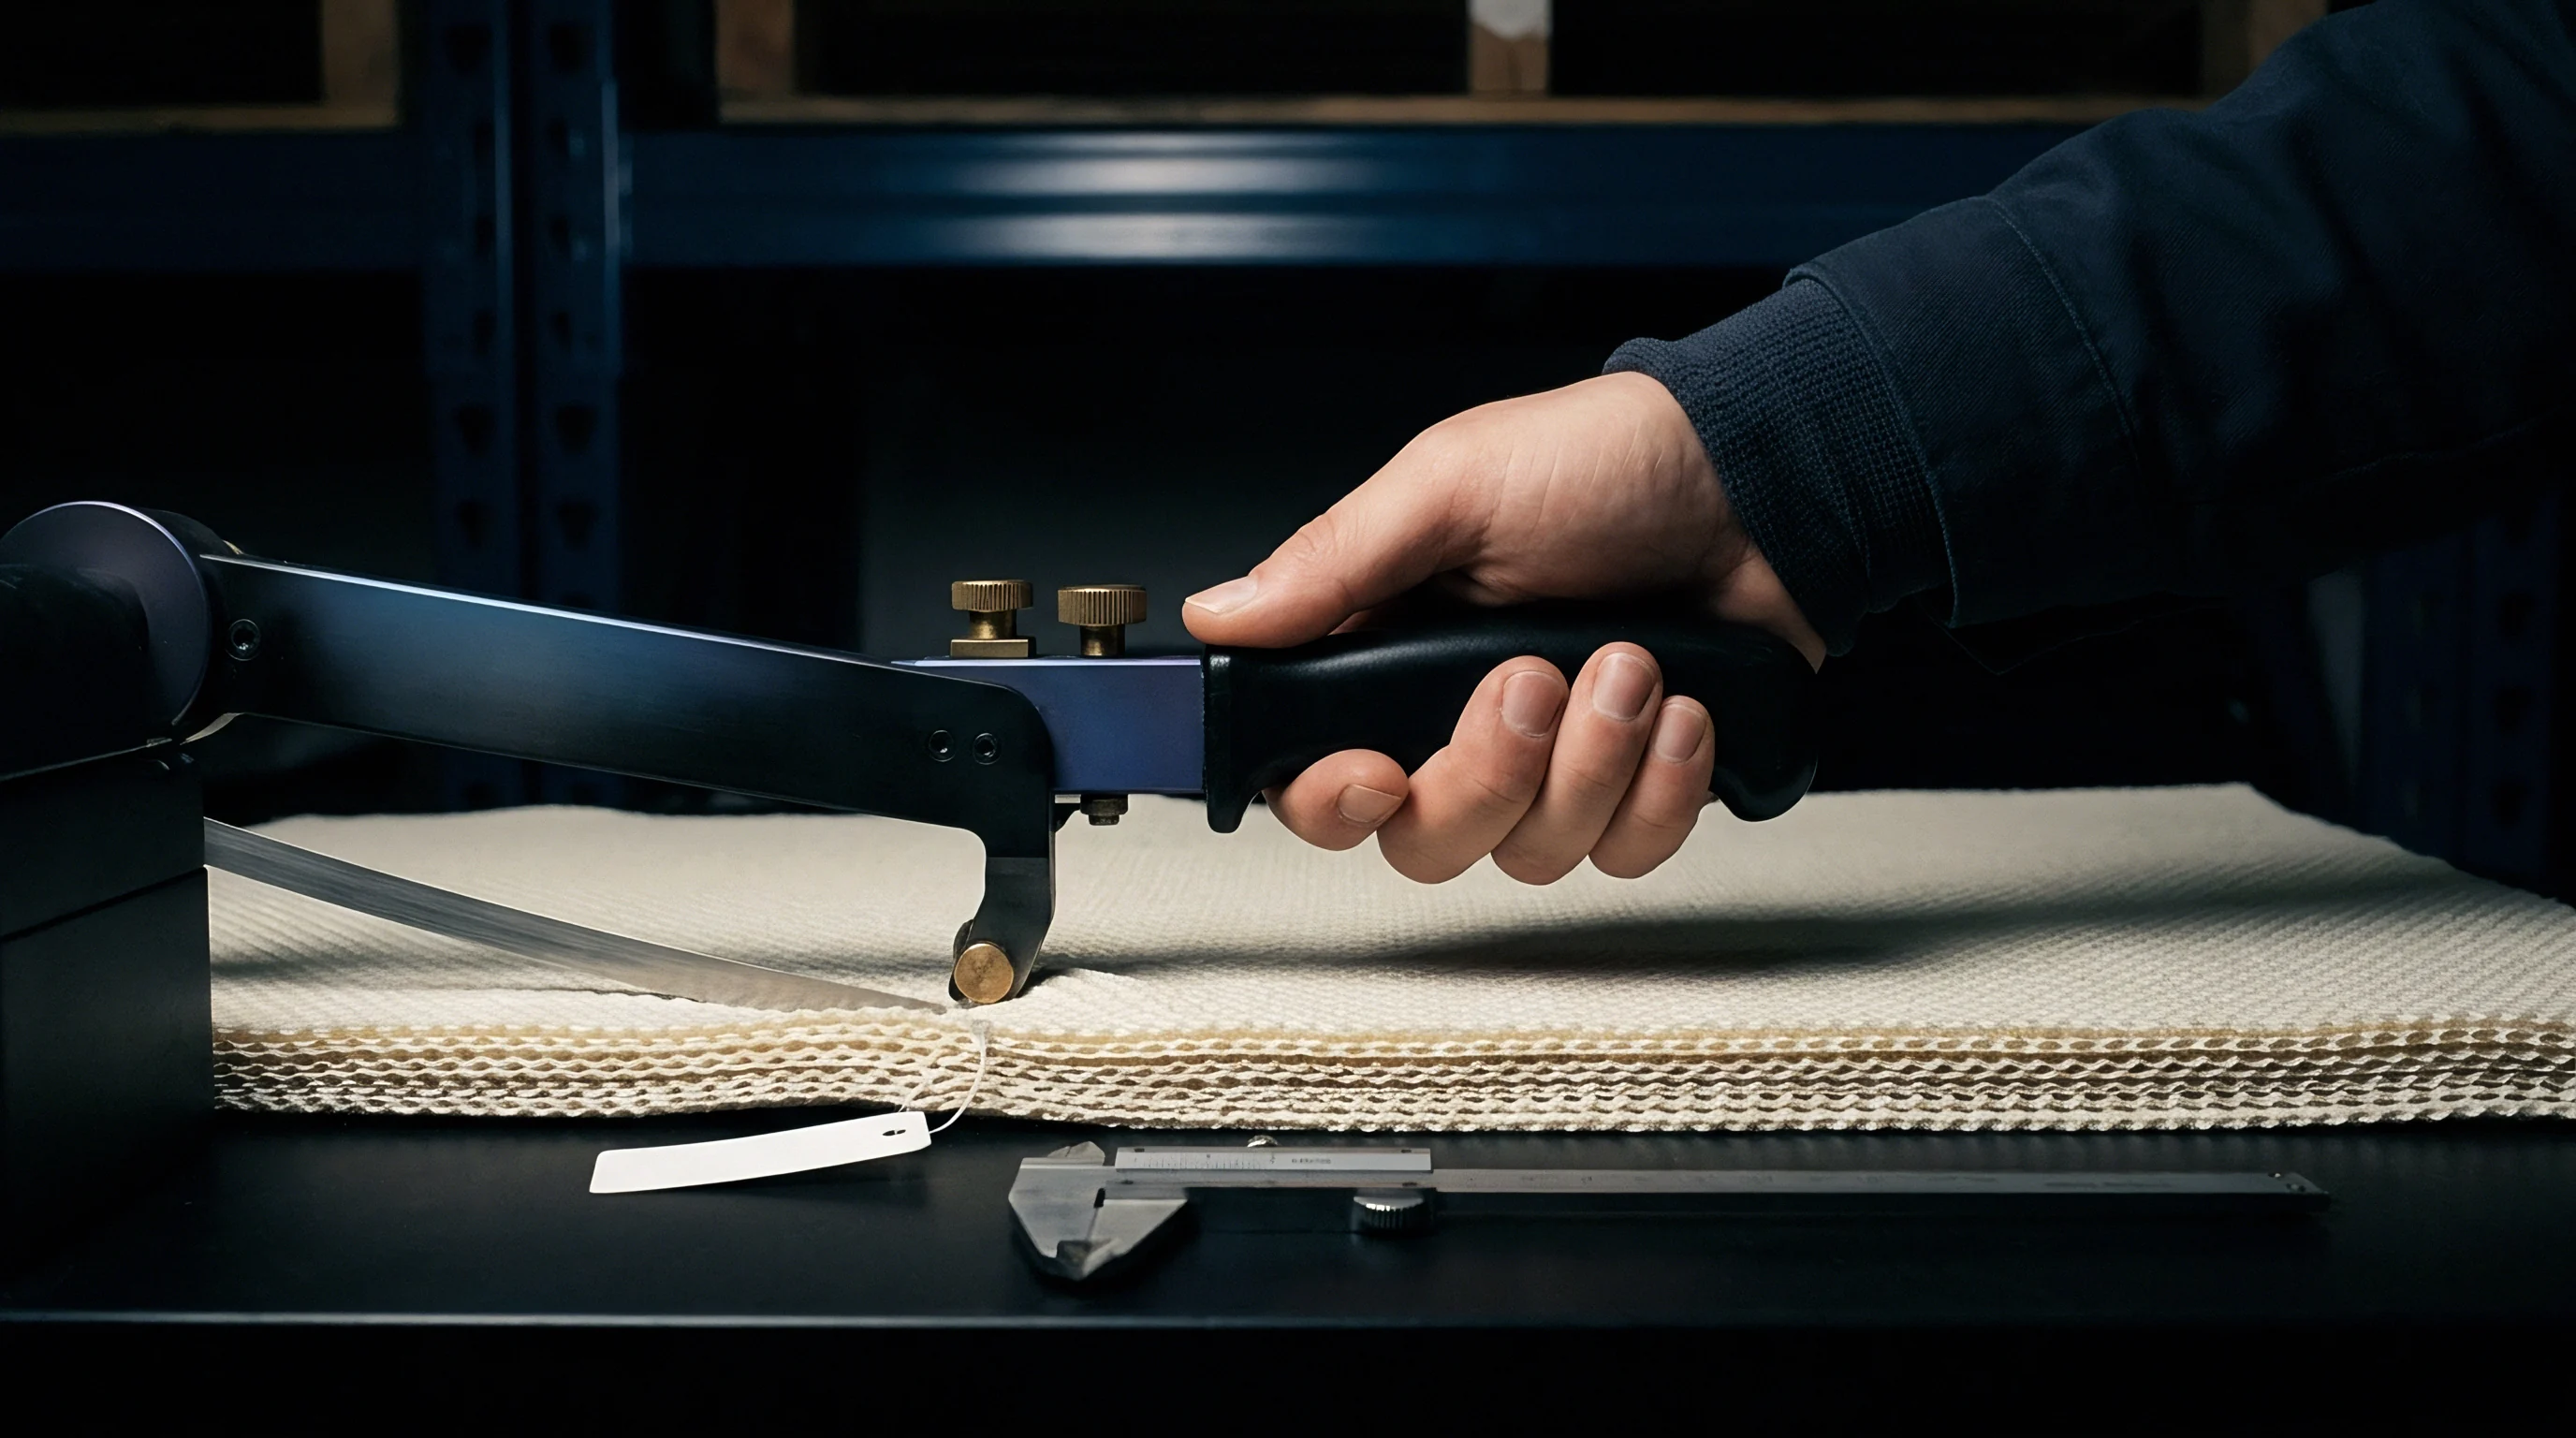
Lateral Chemical Migration in Pad Dyeing Operations
Continuous immersion troughs run into pressure variations along the nip roll axis. As fabric passes through the padding mangle, mechanical pressure squeezes out liquor to reach target wet pickup levels. If soft rollers deflect or pneumatic cylinders exert uneven force, a pressure gradient forms between the roll center and the bearing housings.
Higher compression in the middle forces out excess liquid, while lower pressure near the ends leaves heavier liquid volumes along the edges.
Dye liquor stability directly controls how much lateral migration occurs. Reactive and disperse dye systems depend on anti-migration agents like sodium alginate or synthetic polyacrylates to lock liquid in place during infrared pre-drying. When anti-migration chemistry falls short, evaporating water carries unfixed dye molecules toward the surface and outer edges ~ much like paper chromatography, where a moving solvent front carries solutes toward the edges of the paper.
Physical properties vary alongside chemical distribution. Weight per unit area, thread count, and residual relaxation shrinkage all show widthwise variations. Because fabric edges are pinned during stentering, dimensional stress keeps them from relaxing naturally.
Consequently, warp and weft counts taken near the selvedge give distorted figures compared to the unrestrained center of the roll, while specimens cut near the edges yield artificially high tensile strength and reduced elongation values.
Extracting specimens exclusively within ten centimeters of the fabric edge yields misleading chemical compliance data for the entire roll.
Ignoring widthwise variance during incoming inspection exposes garment manufacturers to major financial risks. Cutting rooms lay up dozens of plies at once. When a roll has center-to-edge finish variations, panels cut from the middle can fail performance tests even while outer-edge samples pass.
If an untested roll center harbors elevated chemical residues, finished garments made from those middle panels can trigger recalls and customs rejections despite clean initial test reports from edge samples. A single undetected transverse gradient can compromise an entire production run, leading to distributor chargebacks, customs rehandling fees, and lasting damage to brand reputation.


Core
Longitudinal variations develop systematically as fabric winds onto cardboard tubes during continuous finishing. While transverse gradients run across the web, longitudinal gradients form along the total length of the run. A single one-thousand-meter roll experiences noticeably different thermal, mechanical, and chemical conditions at its outer wrap, middle section, and inner core layers.
Core sampling protocols evaluate these longitudinal and radial dynamics to confirm that compliance metrics hold across the full roll volume.
Winding subjects the inner layers of a roll to heavy radial compression and limited air circulation. As hundreds of meters accumulate under tension around the central tube, mechanical pressure builds toward the core axis. This pressure compacts the textile, driving residual moisture and volatile organic compounds inward toward the cardboard tube.
Fabric wound while still hot from calendering or heat-setting holds thermal energy inside the core for up to forty-eight hours, creating an isolated warm zone that alters chemical equilibrium.
Sustained heat retention near the core accelerates chemical reactions that never occur in the fast-cooling outer wraps. Unreacted resin monomers continue crosslinking, residual volatile solvents vaporize and condense onto neighboring layers, and heat-sensitive dyes undergo thermomigration. An inspection plan that evaluates swatches taken only from the outer tail of a roll misses the thermal degradation and chemical build-up hidden in the inner core.
Head-Middle-Tail sampling divides a production roll into three distinct longitudinal zones. The head covers the leading end of the dye lot, the middle represents the stabilized processing phase, and the tail consists of the final wraps around the core tube. Tailing effects, bath exhaustion, and cooling rates alter chemical profiles across these zones, making longitudinal tracking essential during incoming verification.

Tailing Behavior in Continuous Liquor Padding
Dye and finish molecules leave the liquor bath faster than the solvent is replaced. During continuous pad-dyeing and wet-finishing, thousands of meters of fabric pass through a shallow trough of functional liquor. As dry fibers hit the bath, they absorb active chemistry ~ such as fluorinated polymers, antimicrobial quaternary ammonium compounds, or reactive dyes ~ faster than they absorb water.
This selective uptake causes steady bath exhaustion over the course of a run.
Unless automated dosing systems continuously calculate and replenish active ingredients based on fiber consumption, chemical concentration drops steadily from start to finish. As a result, the head of the run receives heavier chemical loading than the tail. Test data documented a 34 percent drop in organosilicone softener concentration between the edge and center strip.
The sequence below outlines the steps for a longitudinal Head-Middle-Tail extraction on high-capacity rolls.
- Unwind and discard the outermost two protective wraps of fabric from the receiving roll to eliminate ambient surface contamination and transit abrasion effects.
- Cut a full-width swatch measuring one meter in length from the outer section to establish the Head longitudinal specimen zone.
- Unwind the fabric roll on a tensionless inspection table to the fifty percent length point using an automated meter counter.
- Extract a one-meter full-width swatch from the middle section to capture stabilized continuous processing conditions.
- Continue unwinding until reaching the final ten meters of fabric adjacent to the inner cardboard support tube.
- Cut a one-meter full-width swatch from the inner section to isolate the Tail core specimen zone, ensuring no adhesive core-tape residue contacts the test area.
- Label each extracted swatch immediately with roll identification, longitudinal coordinate code, and unwinding orientation vectors.
Longitudinal bath depletion undermines both functional performance and regulatory compliance. Antimicrobial treatments designed for ISO 20743 bacterial reduction tests may pass in head swatches from the start of the run, yet fail in tail swatches taken near the core where the active biocide ran low. Conversely, ionic auxiliaries added to stabilize the bath can build up over time, causing tail samples to exceed legal limits for restricted substances.
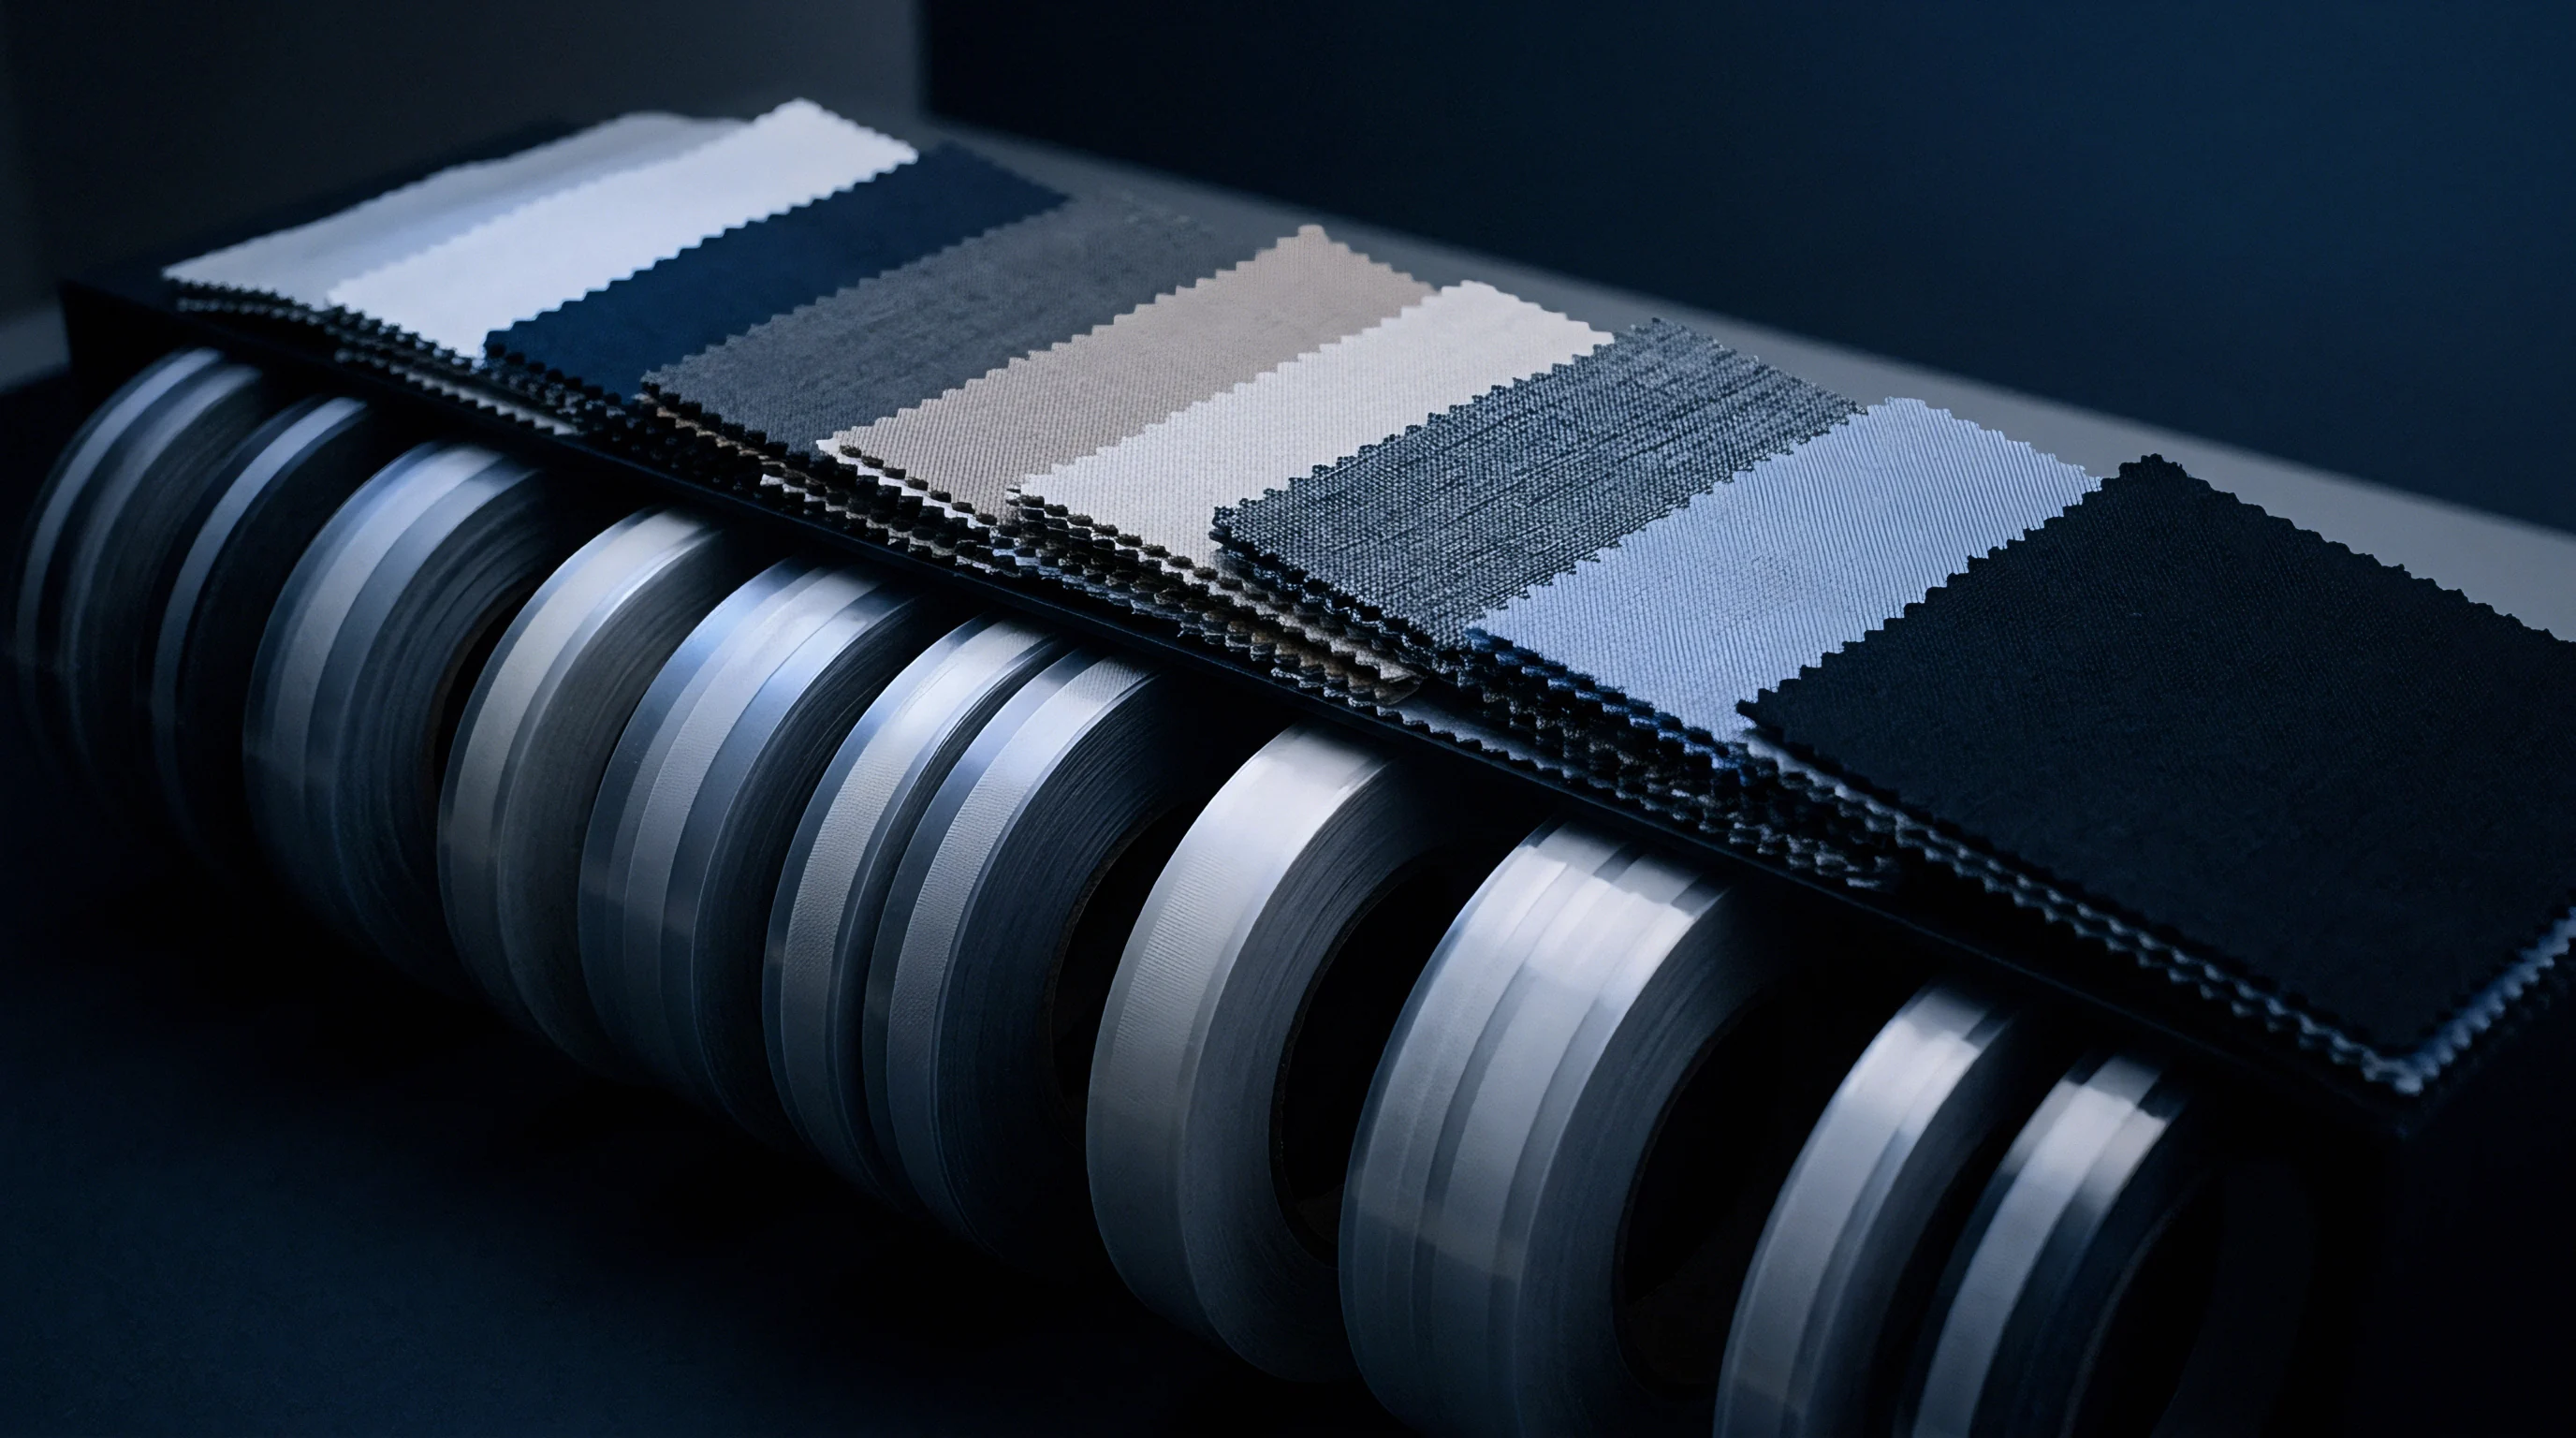
Radial Thermal Dissipation and Moisture Migration
Heat trapped inside tightly wound rolls dissipates unevenly over twenty-four hours of storage. The outer wraps cool quickly through convection into warehouse air, while the inner core stays insulated beneath hundreds of fabric layers. This thermal gradient drives moisture vapor from the warm interior toward cooler outer layers ~ or traps condensed moisture near the core, depending on warehouse humidity and packaging materials.
Variations in moisture regain directly affect mass-dependent chemical testing calculations. Standards measure restricted substances like extractable heavy metals or phthalates in milligrams per kilogram of dry fabric. If core layers retain excess moisture from incomplete drying before rolling, the sample’s added water weight distorts dry-mass calculations unless the specimen is conditioned to ISO 139 standards before solvent extraction.
Bath tailing further shifts dye exhaustion depth across the run.
Continuous padding liquor depletes active fluorochemical concentration by 18 percent over a 2000 meter batch run at standard pickup rates.
Batching practices are sometimes treated as sufficient to maintain standard tolerances on the assumption that continuous agitation and dosing prevent bath exhaustion while temperature normalizes in storage. But that assumption ignores the physical reality of mass transport inside compressed rolls. Accepting supplier assurances without taking destructive core samples leaves buyers vulnerable to non-conformities buried deep inside incoming shipments.


Bench
Laboratory preparation turns bulk fabric swatches into test specimens without introducing mechanical damage or environmental contamination. Once positional samples arrive from the selvedge, center, head, or core, technicians must follow precise cutting strategies. Geometry, boundary exclusion zones, and environmental acclimatization directly dictate how reproducible physical and chemical test results will be.
Specimen cutting must align with fiber orientation and stay clear of distorted edges. Cutting too close to raw edges or selvedge pin holes introduces structural defects that distort tensile, tear, and burst strength values. For chemical testing, samples cut from areas handled by warehouse staff can pick up trace phthalates, skin oils, or dust, causing false positives during gas chromatography-mass spectrometry analysis.
Conditioning atmospheres dictate physical test outcomes. Synthetic and natural fibers absorb moisture according to their specific regain curves. Nylon 6,6, cotton, viscose, and wool show pronounced shifts in tensile strength, impact resistance, and flexural rigidity as ambient humidity changes.
Testing swatches immediately after unwinding a cold, sealed roll produces erratic physical metrics that fail to reflect stabilized material properties.
The extraction matrix below maps specific fabric positional sampling coordinates to their required laboratory preparation protocols, minimum exclusion distances, and targeted regulatory or physical testing standards.
| Sampling Zone | Physical Coordinate | Chemical Target | Physical Target | Exclusion Zone | Compliance Risk |
|---|---|---|---|---|---|
| Left Selvedge | 0-15 cm from left edge | Crosslinkers, Pin Oils | Pinning Distortion, Density | Within 2 cm of pin holes | False elevated resin content |
| Left Mid-Body | 25-35 percent width | DWR, Flame Retardants | Tensile Strength, Tear Resistance | Avoid creased fold lines | Uneven functional pickup |
| Fabric Center | 45-55 percent width | Azo Dyes, Heavy Metals | Burst Strength, Mass/Area | Avoid center fold marks | Depleted finish concentration |
| Right Mid-Body | 65-75 percent width | DWR, Flame Retardants | Tensile Strength, Tear Resistance | Avoid creased fold lines | Uneven functional pickup |
| Right Selvedge | 85-100 percent width | Crosslinkers, Pin Oils | Pinning Distortion, Density | Within 2 cm of pin holes | False elevated resin content |
| Roll Head | First 3 meters of roll | Unfixed Dyes, Surfactants | Initial Shrinkage, Bow/Skew | First 50 cm outer wrapper | Initial liquor over-concentration |
| Roll Core | Final 3 meters near tube | Volatile Solvents, Formaldehyde | Compression Crease Recovery | Tape adhesive contact zones | Thermal degradation accumulation |

Specimen Extraction Geometry and Boundary Exclusions
Cutting templates need to align with yarn direction while bypassing damaged or distorted areas. On woven fabrics, specimen edges must run parallel to warp and weft yarns; cutting on a bias causes premature yarn slippage during tensile testing, understating true breaking strength. For knits, specimen orientation must align with course and wale lines to prevent edge curling that skews weight distribution and stretch measurements.
Boundary exclusion rules require that bulk compliance specimens be taken at least ten centimeters away from the selvedge, unless the test specifically evaluates pin distortion or edge finish. Swatches must also avoid central crease lines formed when fabric is folded double onto flat bolts. Crease lines undergo heavy mechanical pressure and friction during rolling, damaging fiber structure, fracturing surface coatings, and accelerating local chemical breakdown.
Bench handling protocols prevent cross-contamination during sample prep. Technicians should use stainless steel blades, PTFE cutting mats, and powder-free nitrile gloves when handling samples for ultra-trace chemical analysis. Cutting tools must be cleaned with analytical-grade isopropanol between swatches to avoid transferring fluorochemicals or silicone softeners from high-concentration edge samples to low-concentration center samples.

Acclimatization Standards for Physical and Chemical Testing
Relative humidity and ambient temperature shift textile moisture regain, altering strength values and sample mass. ISO 139 sets the standard atmosphere for textile conditioning at twenty degrees Celsius (plus or minus two degrees) and sixty-five percent relative humidity (plus or minus four percent). All physical test samples must reach moisture equilibrium in this environment before destructive testing.
Conditioning time depends on fiber type, weight per unit area, and hydrophobic treatments. Standard cellulosic fabrics take at least twenty-four hours to stabilize, whereas tightly woven, heavy synthetic canvases with water-repellent coatings can require up to forty-eight hours. Weighing samples at four-hour intervals confirms stabilization once consecutive weighings show less than one-tenth of one percent mass variation.
The list below outlines key quality control steps for bench-level sample prep.
- Thermal Pre-Conditioning Protocol requires drying moisture-saturated specimens in low-humidity air at temperatures below fifty degrees Celsius prior to standard ISO 139 acclimatization to ensure consistent moisture sorption hysteresis.
- Specimen Edge Sealing Action prevents glass-fiber or coated synthetic filament unraveling during tear testing by securing raw cut edges with flexible polymer adhesives outside active gauge zones.
- Exclusion of Core Adhesive Contamination forces laboratory technicians to inspect tail specimens under ultraviolet light to identify and discard zones exposed to core-tube adhesives containing phthalates or tackifying resins.
- Mass-Proportional Chemical Sampling dictates combining equal mass fragments from left, center, and right positional cuts when performing composite lot screening for REACH Annex XVII restricted substance compliance.
Chemical extractions depend on precise mass-to-solvent ratios calculated from fully acclimatized sample weights. Running solvent extractions for phthalates, organotins, or chlorinated phenols on unconditioned swatches skews concentration reporting. When testing for volatile organic compounds or free formaldehyde using water extraction under EN ISO 14184-1, samples must be sealed in airtight aluminum foil envelopes immediately after removal from the roll core to prevent evaporation before testing.
Failure to acclimate specimens at 20 degrees Celsius and 65 percent relative humidity per ISO 139 invalidates tear strength rejection claims.
Conditioning swatches to equilibrium ensures that physical and chemical measurements reflect actual material properties rather than temporary room conditions. Rushing testing turnarounds by skipping acclimatization produces unreliable data that won’t withstand an independent lab audit. An inspection bench operating without strict environmental controls undermines the legal validity of its test reports, leaving the buyer unable to recover damages if non-conforming fabric enters production.
Never perform destructive physical strength tests on swatches containing unconditioned moisture gradients.

Arithmetic
Quantifying non-conformity risk across thousand-meter shipments relies on structured statistical modeling. Receiving teams cannot run destructive chemical tests on every meter of cloth without ruining its commercial value. Instead, acceptance decisions depend on statistical sampling plans that balance testing costs against the risk of accepting a bad lot.
Standard sampling systems like ANSI/ASQ Z1.4 and ISO 2859-1 provide rules for choosing sample sizes based on lot size and acceptable quality limits.
Standard plans assume chemical and physical properties are evenly distributed across a production run. That assumption breaks down when fabric rolls carry clear positional gradients along their width or length. When variance inside a roll exceeds variance between rolls, standard random sampling understates non-conformity risk.
Models must include positional variance metrics to establish accurate upper tolerance limits.
Calculating sample sizes for positional testing requires determining the standard deviation of chemical concentration across width and length coordinates. If the standard deviation within a single roll exceeds the acceptable standard deviation across the full production batch, positional sampling density must increase.
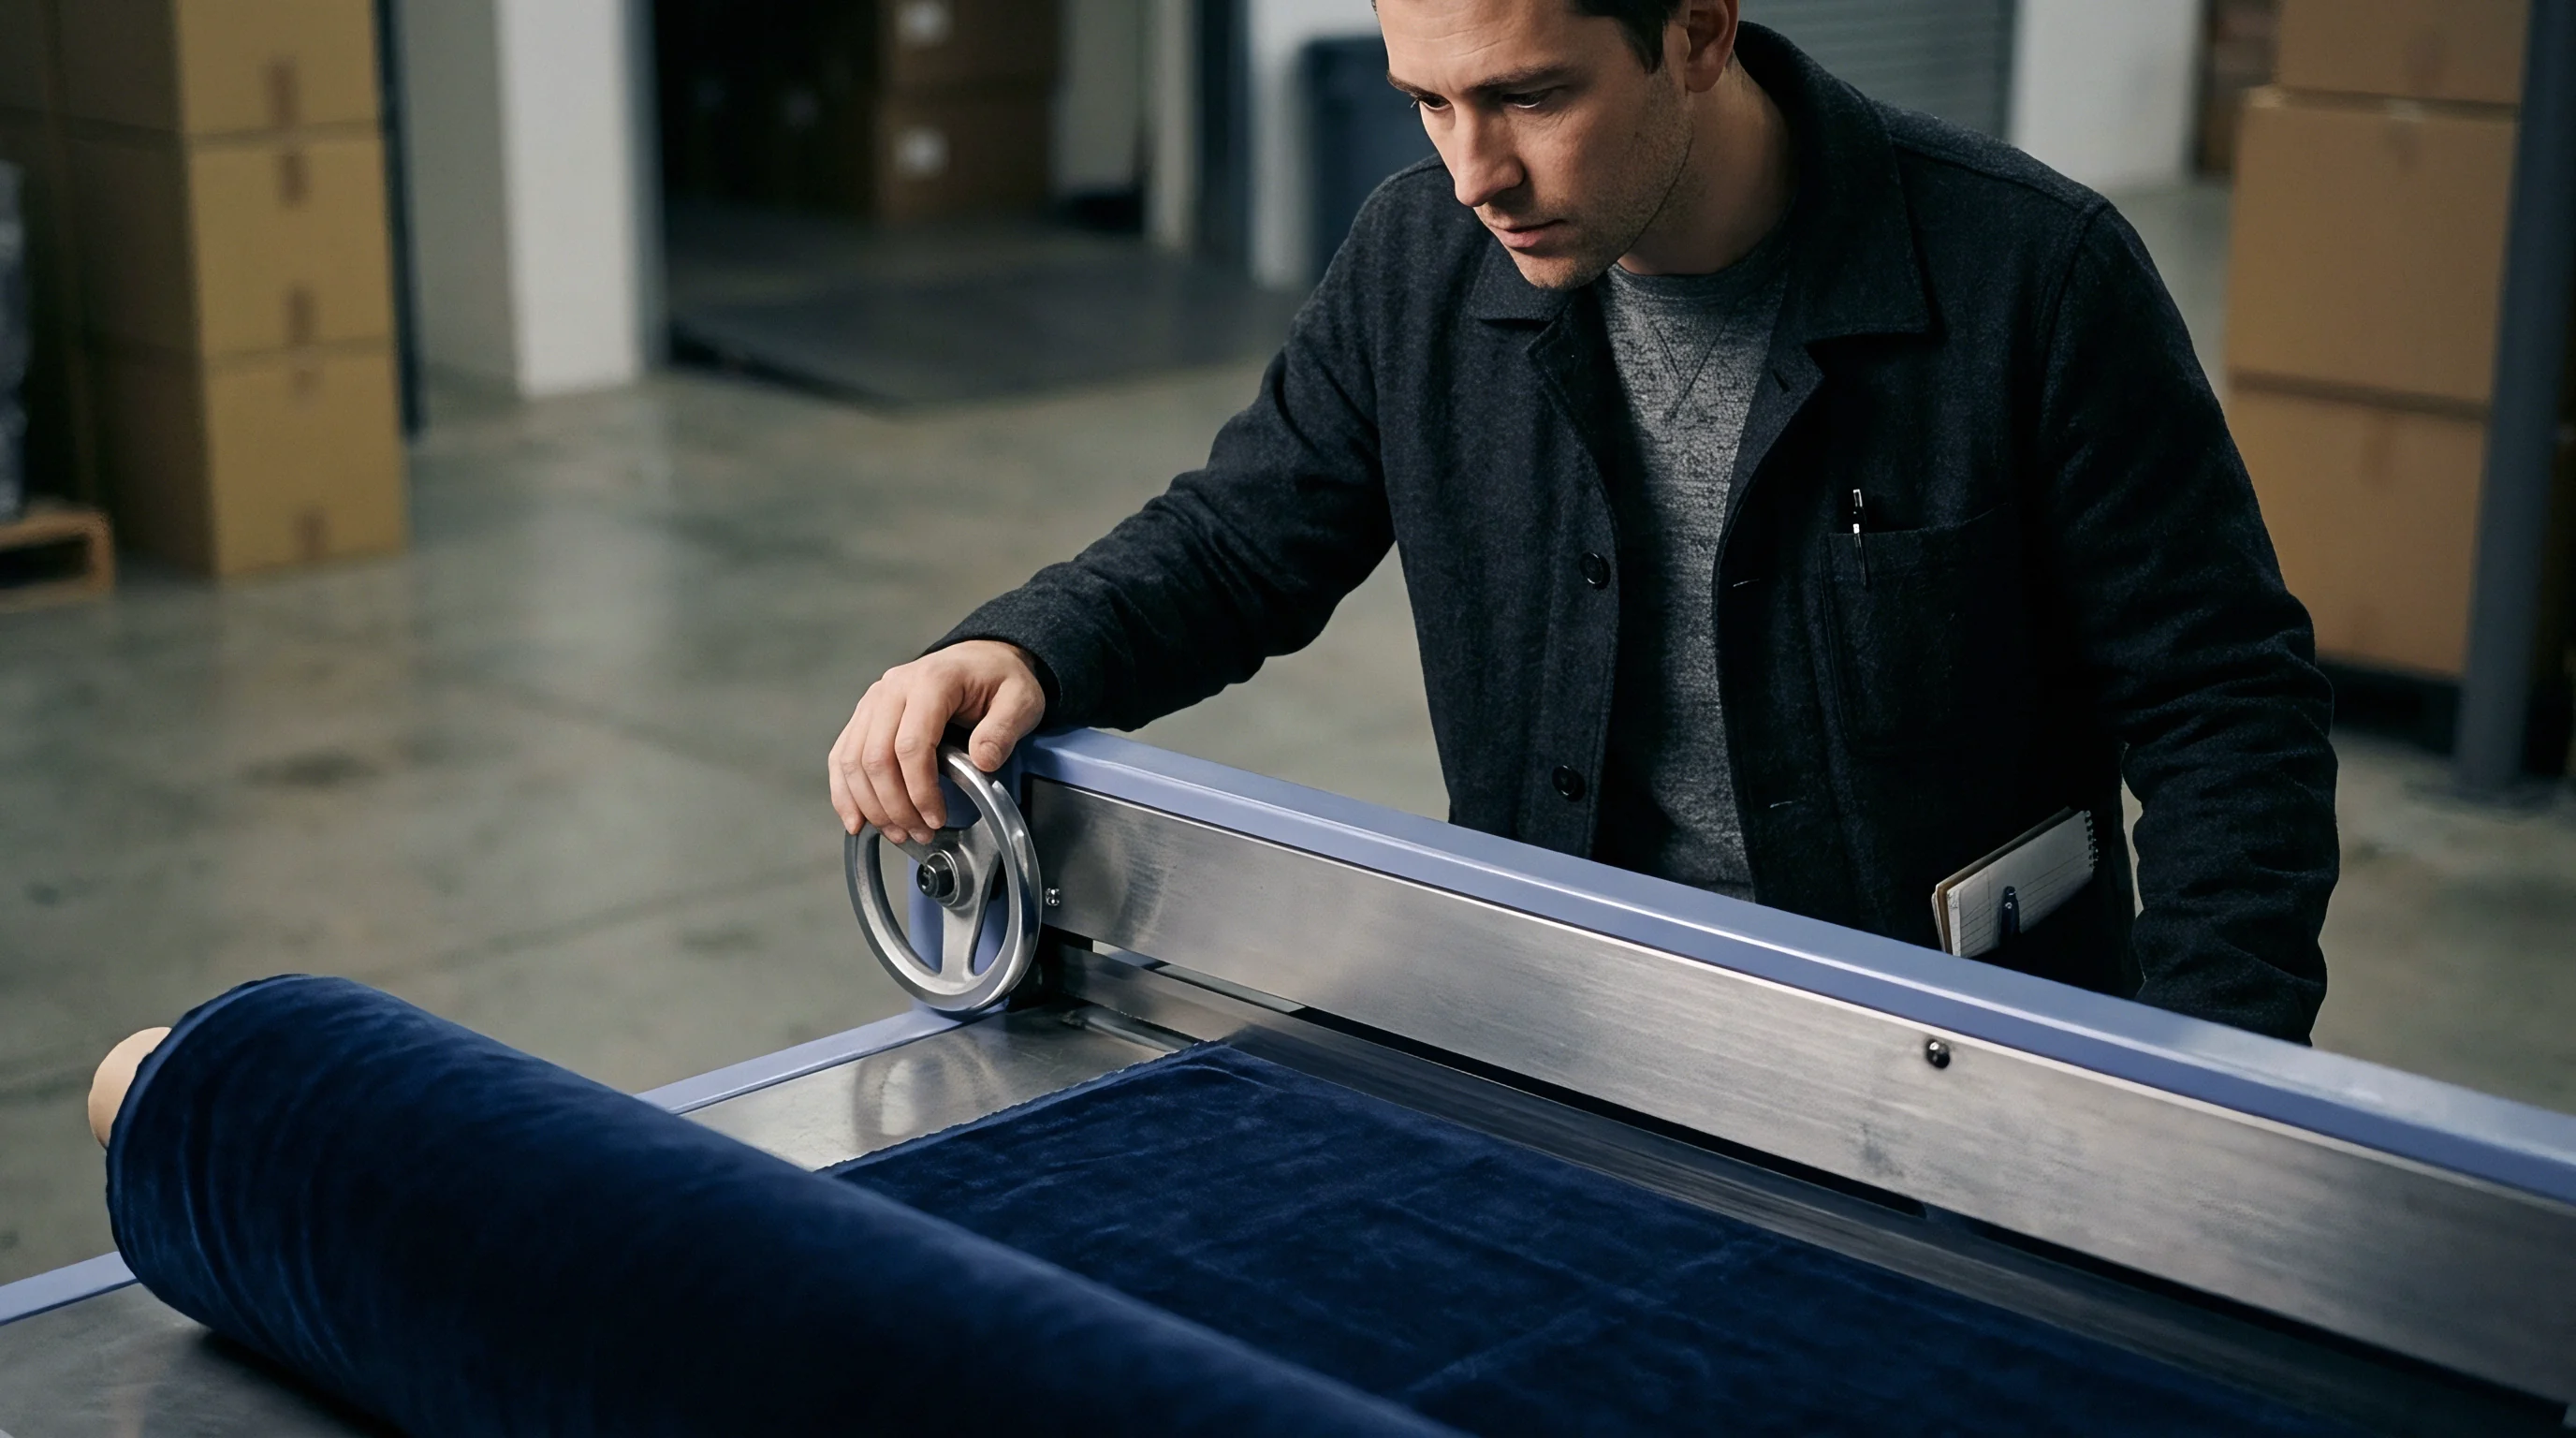
What Sample Size Isolates Positional Chemical Gradient?
Determining specimen counts requires balancing analytical testing expenses against border detention penalties. To isolate positional chemical gradients with ninety-five percent statistical confidence, the sampling scheme must capture both intra-roll variance and inter-roll variance. Standard ANSI/ASQ Z1.4 General Inspection Level II specifies the total number of rolls to select from a shipment, but does not specify the number of positional extraction points per roll.
Calculating the total required specimen count relies on nested analysis of variance principles. The equation for total variance combines variance between rolls, variance along roll length, and variance across roll width. When laboratory data indicates that transverse variance accounts for more than forty percent of total batch variance, the positional sampling matrix must allocate at least three transverse specimens per sampled roll.
The statistical evaluation matrix below outlines confidence intervals and testing costs across six sampling density profiles for a fifty-roll fabric shipment.
| Sampling Density | Rolls Sampled per Lot | Specimen Points per Roll | Total Specimens | Detection Probability for Local Non-Conformity | Laboratory Cost Multiplier |
|---|---|---|---|---|---|
| Single Edge Spot Check | 3 | 1 (Edge Only) | 3 | 18 percent | 1.0x |
| Head-Tail Dual Check | 5 | 2 (Head/Tail Edge) | 10 | 35 percent | 2.8x |
| Standard 3-Point Width | 5 | 3 (Left/Center/Right) | 15 | 72 percent | 4.2x |
| Full HMT Matrix | 8 | 6 (HMT x Edge/Center) | 48 | 91 percent | 12.5x |
| 5-Point Transverse Grid | 8 | 5 (5 Width Coordinates) | 40 | 88 percent | 10.8x |
| Comprehensive ISO 3951 Grid | 13 | 9 (HMT x L/C/R) | 117 | 99 percent | 28.0x |
Increasing sampling density from a single edge check to a 3-point width protocol boosts detection probability for localized non-conformity from eighteen percent to seventy-two percent. However, testing costs scale linearly with total specimen count. Importers must select sampling densities that match the regulatory exposure of the chemical target.
For high-risk restricted substances like alkylphenol ethoxylates or arylamines derived from azo dyes, high-density sampling schemes are commercially essential to prevent border seizures.

Statistical Acceptance Criteria for Intra-Roll Variance
Upper tolerance limit calculations aggregate positional test measurements into a single compliance metric. When testing a lot of fabric for a chemical carrying a regulatory threshold, such as a thirty milligram per kilogram limit for aromatic amines under REACH Annex XVII, the compliance decision relies on the upper statistical tolerance limit rather than the simple sample average.
Consider a practical compliance calculation for a shipment of twenty rolls of water-repellent polyester fabric tested for free formaldehyde content under OEKO-TEX STANDARD 100 Class II limits (seventy-five milligrams per kilogram). Five rolls are selected at random. From each roll, three positional specimens are extracted: Left Edge, Center, and Right Edge, yielding fifteen total analytical test results.
The lab reports the following positional formaldehyde concentrations in milligrams per kilogram:
Roll 1: Left Edge = 42, Center = 68, Right Edge = 45. Roll 2: Left Edge = 38, Center = 72, Right Edge = 40. Roll 3: Left Edge = 45, Center = 81, Right Edge = 48.
Roll 4: Left Edge = 40, Center = 65, Right Edge = 42. Roll 5: Left Edge = 44, Center = 78, Right Edge = 46.
Calculating the mean across all fifteen specimens yields a value of 53.0 milligrams per kilogram, which appears comfortably below the 75 milligram limit. However, analyzing intra-roll positional dynamics reveals a severe transverse gradient. The average center concentration is 72.8 milligrams per kilogram, with Roll 3 Center reaching 81 milligrams per kilogram, exceeding the regulatory limit.
The sample standard deviation across all fifteen points is 16.2 milligrams per kilogram due to the extreme center-to-edge spread.
To evaluate lot acceptability using variables sampling under ISO 3951-1, the compliance team calculates the Quality Statistic (Q). The Quality Statistic equals the upper specification limit (75 mg/kg) minus the sample mean (53.0 mg/kg), divided by the sample standard deviation (16.2 mg/kg):
Q = (75.0 – 53.0) / 16.2 = 1.358
For a sample size of fifteen with a Normal Quality Limit of one percent, the required k-factor for ninety-five percent statistical confidence is 1.65. Because the calculated Quality Statistic (1.358) is less than the required k-factor (1.65), the lot is formally rejected. Even though the arithmetic mean passed, positional arithmetic proves that a significant percentage of the roll center volume exceeds regulatory thresholds.
Positional variance inside a single fabric roll frequently exceeds the statistical tolerance permitted by standard acceptance sampling plans.
Relying on simple batch averages allows non-conforming material to pass incoming inspection. By decomposing variance into spatial coordinates, compliance teams quantify localized risk and enforce standard tolerance boundaries. When intra-roll variance drives the Quality Statistic below acceptance thresholds, the entire shipment must be quarantined, leaving the buyer holding clear, unassailable statistical proof of non-conformity to support commercial rejection claims.
How far can an incoming inspection team reduce positional specimen counts before analytical masking obscures localized chemical exceedances?
Clause
Commercial contracts turn technical sampling rules into legally binding terms. Without explicit wording that defines positional sampling locations, mills can challenge batch rejections by claiming buyer testing used non-standard coordinates. Standard purchase order terms that cite general ISO or ASTM methods leave buyers vulnerable in commercial arbitration if non-conformities show up only in roll centers or inner cores.
Contracts need to specify sampling coordinates, allowed intra-roll variance limits, and retesting steps. Mills frequently insert clauses requiring compliance swatches to be taken only from outer roll tails or selvedges, effectively shielding core and center defects from incoming quality checks. Placing positional sampling requirements directly in technical spec sheets before issuing purchase orders avoids that trap.
Liability allocation hinges on precise contractual language. When an incoming shipment fails compliance testing due to localized positional variance, purchase agreement clauses specify who pays for re-inspection, laboratory re-testing, container demurrage, and scrap disposal. A well-drafted compliance clause converts technical positional sampling data into immediate commercial recourse.

Commercial Allocation of Positional Testing Costs
Purchase agreements specify whether buyer or seller funds retesting when initial screening identifies localized non-conformity. Initial incoming testing costs are typically borne by the buyer as part of standard receiving overhead. However, when initial positional sampling reveals that intra-roll variance exceeds agreed statistical limits, contract clauses must automatically shift secondary testing expenses, isolation sorting, and third-party arbitration analysis costs to the mill.
Clear financial thresholds eliminate disputes over re-testing logistics. Contracts should establish that if secondary positional testing confirms that more than five percent of total roll volume exceeds chemical or physical specifications, the seller forfeits the right to demand further re-testing and must accept immediate lot rejection. The list below outlines commercial risk allocation terms recommended for insertion into international fabric purchase agreements.
- Positional Cut Authorization Clause explicitly grants the buyer legal authority to cut destructive full-width and core-level swatches from incoming rolls without voiding return rights for the balance of the lot.
- Intra-Roll Variance Penalty Threshold establishes that if center-to-edge performance metrics vary by more than twenty percent, the seller pays a monetary administrative penalty regardless of whether the lot average passes.
- Secondary Retest Funding Mechanism mandates that seller-requested third-party arbitration testing must be pre-funded by the seller through an escrow deposit before specimens are submitted to an accredited ISO 17025 laboratory.
- Chain-of-Custody Positional Traceability requires all compliance swatches to carry physical tamper-evident identification linking test reports directly to specific roll numbers and linear meter coordinates.
Commercial clauses must also establish specific timelines for positional rejection notifications. Standard trade customs allow buyers between fourteen and thirty days from port arrival to perform receiving inspection. For complex positional testing involving chromatographic analysis of core samples, contracts must explicitly extend the technical notification window to forty-five days to allow for laboratory queue times without waiving rejection rights.
Contractual Defenses against Batch Repudiation Claims
Mills challenge material rejections by demonstrating that buyer sampling techniques departed from agreed ASTM protocols. If a buyer rejects a lot based on center-roll fluorochemical failure, the supplier’s legal counsel will immediately scrutinize the buyer’s sampling protocol. If the buyer cannot prove that swatches were extracted, cut, and conditioned in strict accordance with contractually stipulated standards, the mill can repudiate the rejection claim and demand full payment under letter of credit terms.
Incorporating explicit positional sampling protocols directly into purchase agreements creates an unassailable legal position. The contractual clause must specify the precise physical standards governing sample extraction, such as ASTM D2905 for statements on number of specimens, or ISO 3951-1 for variable inspection limits. By anchoring commercial terms to published standardization protocols, the buyer eliminates supplier claims of arbitrary testing.
The following contractually binding specification clause illustrates precise legal language designed to enforce positional compliance for incoming fabric shipments:
Section 8.3 Positional Sampling and Intra-Roll Compliance Verification: The buyer reserves the right to extract destructive test swatches from any coordinate along the transverse (Edge-Middle-Edge) and longitudinal (Head-Middle-Tail) axes of any roll within the shipment, including the inner core wraps. Non-conformity identified at any single positional coordinate shall constitute grounds for rejection of the entire roll. If positional testing reveals that more than ten percent (10%) of sampled rolls contain localized non-conformity exceeding specified chemical limits under REACH Annex XVII or OEKO-TEX STANDARD 100, the buyer maintains the absolute right to reject the entire shipment lot at the seller’s sole expense, including all inbound freight, customs duties, laboratory fees, and container storage charges incurred to date.
Integrating explicit positional sampling requirements into purchase specifications transforms quality control from a passive incoming formality into an active legal protection framework. When contracts link technical sampling coordinates directly to financial remedies, suppliers enforce stricter quality control on their own finishing lines, preventing non-conforming fabric rolls from ever being loaded into shipping containers.