Statistical Acceptance Sampling for Industrial Greige Fabric Sett Audits
Variables acceptance sampling using ISO 3951 reduces audit roll counts while protecting buyers against greige sett variances that compromise finishing yield.


Reed
Greige fabric performance is governed by the mechanical geometry established in the loom shed during shedding and beat-up. Warp end count and filling pick count establish the physical mass, structural stability, and surface porosity of the un-dyed cloth. When an industrial buyer commits capital to a bulk shipment of 100,000 meters of greige poplin or twill, accepting delivery on random visual spot-checks creates severe commercial risk.
Sett variations at this stage carry directly into wet processing: minor deviations in pick density shift dye liquor absorption, alter width contraction on the stenter frame during drying, and push finished fabric weights outside contracted tolerances.
Warp ends stay locked to reed wire spacing, harness denting, and beam tension, keeping the warp sett comparatively stable across an entire beam run. Filling picks, by contrast, depend on let-off motor response, mechanical insertion dynamics, and take-up roller friction. This makes the filling sett prone to drift over linear meterage due to mechanical slip, bobbin package density variations, and loom stop-start cycles.
Auditing thread density in the greige state requires a statistical framework capable of separating isolated mechanical glitches from systemic, lot-wide drift.

Structural Impact of Greige Sett Variations
Shifts in warp ends or filling picks alter cloth mass, structural balance, and porosity well before wet finishing begins. Fabric cover factor defines the proportion of total cloth area covered by yarn. Under Peirce’s formulation, warp cover factor K1 equals warp ends per inch divided by the square root of warp yarn direct count in cotton system Ne. Filling cover factor K2 equals picks per inch divided by the square root of filling yarn count Ne. Total fabric cover factor Kc reflects their combined coverage, expressed by the relationship:
Kc = K1 + K2 – fracK1 × K228
Dropping filling pick density from 56 picks per inch to 52 picks per inch on a 40s Ne cotton poplin build significantly lowers the total cover factor. The looser yarn grid increases thread mobility under mechanical tension. During continuous scouring and desizing, this open geometry permits excessive warp crimp conversion, triggering erratic lengthwise contraction.
Conversely, an over-picked build increases beat-up resistance at the fell of the cloth. That elevated beat-up force abrades spun warp yarns, inducing filamentation in synthetic blends and leaving finished garments vulnerable to micro-pilling.
The balance between warp and filling thread counts dictates how greige cloth behaves in liquid finishing baths. A lean pick build opens channels between filling yarns, prompting rapid liquor strike-through during pad-mangle dyeing. That swift passage cuts dwell time and leaves the finished shade lighter than the approved lab dip standard.
Catching these density fluctuations at the greige gate prevents chemical converters from processing off-shade lots.
Off-loom greige fabric relaxations alter pick counts prior to wet processing without modifying the total weight of yarn present.

Loom Beat Mechanics and Pick Density Dynamics
Spacing between successive filling yarns along a roll depends on continuous take-up motion. Modern air-jet and rapier looms coordinate electronic take-up motors with electronic let-off systems to preserve steady warp tension from a full beam down to the core. Even so, mechanical backlash, drive belt wear, and beam drive slip introduce periodic variations into pick spacing.
Loom stops generate sharp local defects known as pick bars or start-up marks: while the machine sits idle under static tension, warp yarns relax elastically, so the initial restart beat either crowds picks together or leaves a visible gap, depending on motor brake delay settings.
Pick density variations cluster in distinct spatial frequencies across continuous rolls. High-frequency ripples occur over intervals of ten to fifty centimeters, driven by loom fell displacement and cyclic tension peaks. Low-frequency variations extend across hundreds of meters as warp beam diameter shrinks and take-up drive electronics drift with heat.
Checking picks at three arbitrary spots on a roll routinely misses these long-range trends, which is why statistical acceptance protocols must account for both localized noise and broad lot drift.
Warp end density across the fabric width shows systematic edge-to-middle variation. Selvedges absorb higher lateral forces during beat-up, crowding edge warp ends closer together than those in the central web. Counting threads exclusively near the selvedge overestimates overall warp density, concealing structural deficiencies in the primary cutting area of the fabric.

Downstream Wet Processing and Shrinkage Propagation
Chemical desizing, scouring, and continuous dyeing subject unrelaxed yarns to hydrothermal stress. Greige entering the wet-processing line carries strains locked in during warping, sizing, and weaving. Hot aqueous liquor lubricates yarn contact points, releasing stored internal energy and causing the fibers to swell.
As warp yarns swell in diameter, filling yarns are forced to bend around them, increasing filling crimp and drawing the fabric width inward.
When incoming greige rolls show variable pick density across a 50,000-meter batch, consistent width control on the stenter frame becomes impossible. Looser-picked rolls contract inward aggressively, requiring higher clip tension on the stenter chains to hold target width. Pulling too hard stretches the edges, introducing bow and skew defects.
Denser rolls resist contraction, emerging from the stenter wide and slack, which leads to dimensional instability during garment wash tests.
- Warp Crimp Imbalance occurs when elevated pick counts force warp ends into severe geometric crimp, causing excessive fabric shrinkage in the length direction during home laundering tests.
- Width Contraction Fluctuation emerges during scouring when uneven pick density alters lateral fabric tension, forcing stenter operators to adjust chain width continually across bulk runs.
- Mechanical Reed Marking develops if uneven wire spacing in the harness split pinches adjacent warp ends together, leaving longitudinal light streaks visible after piece dyeing.
- Dye Uptake Disparity manifests across the fabric face when pick count shifts change yarn packing density, creating shade depth variations between different rolls of the same dye lot.
Ambient loom-room humidity shifts can temporarily shrink filling yarns on the package prior to insertion, altering off-loom pick densities.

Curve
Statistical quality control for bulk woven shipments uses mathematical probability models to quantify lot acceptance risk. Inspecting every linear meter of greige cloth is commercially impractical, running up metrology costs and risking fabric contamination. Acceptance sampling establishes a formal protocol where a representative sample of rolls is drawn from a production lot, tested for end and pick density, and evaluated against predetermined criteria.
At the center of this method lies the Operating Characteristic curve, which plots the probability of accepting a lot against its actual underlying non-conformance rate.
Sampling plans divide into attributes plans and variables plans. Attributes plans score rolls simply as acceptable or defective based on whether thread counts fall within contract limits. Variables plans record exact numerical values for ends and picks per unit length, calculating sample mean barx and sample standard deviation s.
For greige fabric sett audits, variables sampling provides equivalent protection against defective lots with substantially smaller sample sizes.

Attributes versus Variables Sampling for Threads per Unit
Treating inspection data as binary pass or fail outcomes ignores how closely measurements cluster around specification boundaries. Under attributes logic, an end count that misses specification by a single end per inch receives the same defect classification as a count off by ten ends per inch. Attributes protocols, governed by standards such as ISO 2859-1 or ANSI/ASQ Z1.4, require large roll sample sizes to reach high confidence levels; inspecting fifty rolls ties up hours on the inspection frame and increases handling damage on delicate fine-denier filament greige.
Variables sampling protocols, structured under ISO 3951-1 or ANSI/ASQ Z1.9, make use of continuous density data. Thread density in commercial weaving closely follows a normal Gaussian distribution N(μ, σ2), where μ is true mean sett and σ2 is variance. By measuring actual numerical ends and picks from a smaller sample of rolls, variables algorithms calculate how many standard deviation units separate the sample mean from lower and upper contract specification limits.
This allows a buyer to reduce sample roll counts by fifty to seventy percent while maintaining identical statistical protection against bad shipments.
Applying variables plans requires verifying that thread count distributions satisfy normality criteria. Skewed distributions often signal damaged electronic take-up gearing or irregular loom cycling, which produces non-random density spikes. In such cases, statistical transformation or fallback to attributes sampling becomes mandatory to prevent invalid acceptance decisions.
| Shipment Lot Size in Rolls | Attributes Sample Size ANSI Z14 Level II | Attributes Acceptance Number c for AQL 10 | Variables Sample Size ANSI Z19 Level II | Variables Acceptability Constant k for AQL 10 | Inspection Labor Reduction Percentage |
|---|---|---|---|---|---|
| 50 to 90 rolls | 13 rolls | 0 defects | 5 rolls | 1.53 | 61.5% |
| 91 to 150 rolls | 20 rolls | 1 defect | 7 rolls | 1.62 | 65.0% |
| 151 to 280 rolls | 32 rolls | 1 defect | 10 rolls | 1.72 | 68.7% |
| 281 to 500 rolls | 50 rolls | 2 defects | 15 rolls | 1.79 | 70.0% |
| 501 to 1200 rolls | 80 rolls | 3 defects | 25 rolls | 1.89 | 68.7% |
| 1201 to 3200 rolls | 125 rolls | 5 defects | 35 rolls | 1.97 | 72.0% |

Mathematical Foundation of Operating Characteristic Plans
Producer risk α and consumer risk β dictate the probability of lot approval at specified defect rates. Producer risk α represents the statistical probability that a conforming lot containing defect levels equal to the Acceptable Quality Limit (AQL) gets rejected by random sampling chance. Standard contracting sets α at 0.05, accepting a five percent probability of false rejection.
Consumer risk β represents the probability that a low-quality lot containing defect levels equal to the Limiting Quality Level (LQL or LTPD) gets accepted by the buyer. Standard contracting sets β at 0.10, exposing the buyer to a ten percent chance of receiving out-of-spec greige.
The mathematical formulation of the Operating Characteristic curve for a variables plan with known standard deviation σ derives from the standard normal cumulative distribution function Φ(z). The acceptance criterion requires the sample mean barx to satisfy both upper and lower quality specification limits. For a lower specification limit (LSL), the acceptability constant k defines the decision boundary:
barx – k · s ge LSL
For an upper specification limit (USL), the criterion dictates:
barx + k · s le USL
The exact probability of lot acceptance Pa for a lot with true mean thread count μ and standard deviation σ is calculated through the standardized variate zp, where p is the actual fraction non-conforming in the lot:
Pa = Φ left( fracw – ksqrtfrac1n + frack22(n-1) right)
In this equation, w = Φ-1(1 – p), n is the sample size in rolls, and k is the acceptability constant extracted from ANSI/ASQ Z1.9 tables. Larger sample sizes steepen the Operating Characteristic curve, tightening discrimination between the AQL and LQL points and sharpening the statistical distinction between acceptable and unacceptable greige shipments.
Setting the AQL at 1.0 percent for warp density and 1.5 percent for filling density reflects practical weaving economics. Warp end count is fixed by reed setup, so warp errors point to fundamental structural setup mistakes. Filling density drifts more naturally with loom dynamics, making a slightly looser AQL mathematically appropriate for pick counts.
A greige sett variation exceeding 1.8 percent across warp rolls increases wet-finishing width variation beyond 2.5 centimeters under continuous stenter tension.

Worked Variable Acceptance Calculation for High End Count
Consider an evaluation of 500 rolls of cotton-polyester twill under ANSI/ASQ Z1.9 Level II normal inspection. The fabric specification mandates a target warp sett of 120 ends per inch with a Lower Specification Limit (LSL) of 117 ends per inch and an Upper Specification Limit (USL) of 123 ends per inch. The contracted AQL is 1.0 percent.
Referring to ANSI/ASQ Z1.9 inspection tables for a lot size of 500 rolls under Inspection Level II, the required sample size is n = 15 rolls, and the acceptability constant k is 1.79.
Inspectors randomly select 15 rolls from across the warehouse containers, condition the specimens, and record the average warp end count for each roll using calibrated optical counting equipment. The resulting 15 data points in ends per inch are recorded as follows: 120.2, 119.5, 121.0, 118.8, 117.9, 120.5, 121.2, 118.2, 119.0, 120.8, 117.5, 121.5, 118.0, 119.8, and 120.1.
First, calculate the sample mean barx:
barx = fracsumi=115 xi15 = frac1794.015 = 119.60 ends per inch
Second, calculate the sample standard deviation s using the unbiased sample variance estimator:
s = sqrtfracsumi=115 (xi – barx)2n – 1 = sqrtfrac22.2814 = sqrt1.5914 = 1.2615 ends per inch
Third, calculate the Quality Statistic for the Lower Specification Limit (QLSL) and Upper Specification Limit (QUSL):
QLSL = fracbarx – LSLs = frac119.60 – 117.001.2615 = frac2.601.2615 = 2.061
QUSL = fracUSL – barxs = frac123.00 – 119.601.2615 = frac3.401.2615 = 2.695
Fourth, compare the calculated quality statistics against the acceptability constant k = 1.79. Both QLSL (2.061) and QUSL (2.695) exceed k (1.79). Therefore, the shipment passes acceptance criteria for warp density.
If QLSL had fallen below 1.79, the lot would face formal rejection regardless of the average thread count value.
Now consider a scenario where the sample mean remains 119.60, but standard deviation increases to s = 1.65 ends per inch due to inconsistent loom warp tensioning. Recalculating QLSL yields:
QLSL = frac119.60 – 117.001.65 = frac2.601.65 = 1.575
Because QLSL (1.575) is now less than k (1.79), the statistical protocol mandates rejecting the entire 500-roll lot. This mathematical framework prevents accepting shipments with acceptable mean thread counts that exhibit excessive variance across individual rolls.
- Normal Distribution Verification requires checking sample skewness and kurtosis metrics before applying variables equations to ensure probability models remain valid.
- Specification Limit Symmetry determines whether single or double limit k-factors apply when evaluating warp ends and filling picks against technical data sheets.
- Standard Deviation Stability dictates whether historical sigma or sample s estimates govern decision rules during continuous high-volume mill production audits.
- Inspection Level Selection aligns sample size with historical vendor quality rating, shifting from Level II normal to Level III tightened sampling upon detecting non-conforming lots.
Failing to account for standard deviation shifts during variables sampling leads to accepting greige lots that narrow unpredictably on the stenter, leaving behind thousands of meters of out-of-spec finished goods.

Graticule
Physical measurement of thread density demands standardized environmental conditioning and precise optical alignment tools. Counting warp ends and filling picks appears straightforward, but operator fatigue, parallax distortion, fabric structural distortion, and unconditioned moisture regain cause significant measurement variation. A single thread per inch counting discrepancy on a high-density 140 picks per inch construction represents an error margin capable of tipping a variables sampling algorithm from acceptance to rejection.
Audit standard operating procedures must enforce metrological discipline aligned with international testing standards.
The primary governing international test standards are ISO 7211-2 (Textiles ~ Woven fabrics ~ Construction ~ Methods of analysis ~ Part 2: Determination of number of threads per unit length) and ASTM D3775 (Standard Test Method for End Count and Pick Count of Woven Fabric). Both specifications define exact visual and automated protocols, detailing minimum counting lengths, edge exclusion zones, and tension-free sample positioning. Adherence to these standards guarantees that buyer audit measurements hold legal standing during commercial contract disputes.
Standard Test Method Execution for ISO 7211 Two
Specimen preparation begins by placing full-width cloth samples flat without tension across a lighted inspection surface. Standard testing protocols prohibit taking thread density measurements within ten centimeters of either selvedge line to avoid edge packing distortions introduced by selvedge motion during weaving. ISO 7211-2 provides four distinct measurement methods depending on fabric density and structural complexity.
Method A involves cutting and unpicking threads from a measured length of cloth. This destructive technique provides absolute accuracy for dense, heavily felted, or heavily sized greige fabrics where optical counting proves impossible. The operator cuts a specimen exactly 50 millimeters wide, unpicks individual yarns with a pointer, and counts each removed yarn under magnification.
Method B utilizes a standard counting glass (pick glass) with a square aperture measuring 25.4 millimeters or 50 millimeters per side. The operator aligns the graticule edge parallel to the warp yarns and counts filling picks across the open window.
Method C uses a traversing counting microscope mounted on a threaded spindle driven by a hand crank or digital encoder. The crosshair moves across the fabric, and the operator advances a digital counter as each yarn passes the hairline. Method D deploys digital computational image analysis, using CCD linear array cameras and Fast Fourier Transform algorithms to compute spatial frequency peaks corresponding to yarn spacing.
For fine industrial greige fabrics with densities exceeding 100 threads per inch, ISO 7211-2 mandates a minimum counting distance of 50 millimeters. For coarse fabrics under 25 threads per inch, the minimum counting distance expands to 100 millimeters to reduce spatial quantization errors.

Automated Optical Scanning against Manual Counting Glasses
High-resolution digital line sensors capture thread frequency faster and more reliably than manual lenses. Traditional pick-glass counting invites visual fatigue, operator eye strain, and subjective interpolation when yarns sit partially beneath the graticule frame edge. On continuous inspection frames operating at twenty meters per minute, human operators fail to detect localized pick density variations that span fewer than three linear meters.
Automated optical systems utilize incident LED backlighting combined with high-speed telecentric lenses to capture high-contrast transmission images of the greige cloth web. Fast Fourier Transform (FFT) software analyzes spatial intensity variations in the digital image, converting periodic light transmission peaks into exact thread frequency counts. Spatial frequency analysis computes the dominant fundamental frequency corresponding to warp ends and filling picks across a 1024-pixel sensor array, achieving precision within ±0.1 threads per inch.
Side-by-side evaluation on greige cotton duck shows the precision gap between methods: manual pick glass checks produce a measurement standard deviation of 0.65 picks per inch across operators, whereas automated optical inspection holds variation to 0.08 picks per inch on identical inspection zones. Removing operator subjectivity provides the consistency required for variables acceptance audits.
- Condition the fabric roll for twenty-four hours in an atmosphere maintained at twenty degrees Celsius and sixty-five percent relative humidity.
- Unroll five meters of greige cloth across a smooth, flat inspection table without applying longitudinal or transverse tension.
- Position the optical graticule or scanning camera head at least ten centimeters inward from the selvedge edge.
- Align the base reference line of the measurement window parallel to the warp yarns for filling counts or parallel to filling yarns for warp counts.
- Count all visible yarns within a continuous fifty-millimeter window under minimum ten-times optical magnification.
- Record thread counts across five distinct positions along the roll length, alternating between left, center, and right web locations.
- Calculate the arithmetic mean thread count per inch and express the final value to one decimal place.
Moisture Regain and Tensioning Corrections during Testing
Hygral expansion alters yarn spacing when greige cotton rolls undergo testing outside standard relative humidity parameters. Hydrophilic fibers like cotton, viscose, and linen absorb ambient atmospheric moisture, increasing yarn diameter. As yarn diameter swells, yarn crimp increases, causing longitudinal and lateral fabric contraction.
Measuring a dry greige roll immediately after off-loom slitting yields a falsely elevated thread count relative to its standard conditioned state.
ISO 139 mandates pre-conditioning fabric specimens at less than 10 percent relative humidity at 50 degrees Celsius before final conditioning in a standard atmosphere of 20 ± 2 degrees Celsius and 65 ± 4 percent relative humidity for 24 hours. Cotton yarns exhibit an official moisture regain of 8.5 percent. If an auditor measures unconditioned greige cloth at 40 percent ambient relative humidity, the measured pick count will systematically exceed the conditioned pick count by up to 1.2 percent, potentially causing false lot rejections.
Mechanical tension during inspection frame unwinding distorts filling pick counts. Unwinding rolls under high tension stretches the warp direction, narrowing the filling pick spacing and artificially inflating measured picks per inch. Inspection frames must incorporate dancer-roll tension decoupling to ensure cloth passes the counting head at absolute zero mechanical tension.
Compliance with ISO 7211-2 Method A dictates that picks counted within ten centimeters of the selvedge carry no contractual standing during lot re-inspection.
Incorporating ASTM D3775 Section 11 directly into the purchase specification renders off-loom counts non-binding unless conditioning records confirm equilibration at standard atmosphere.

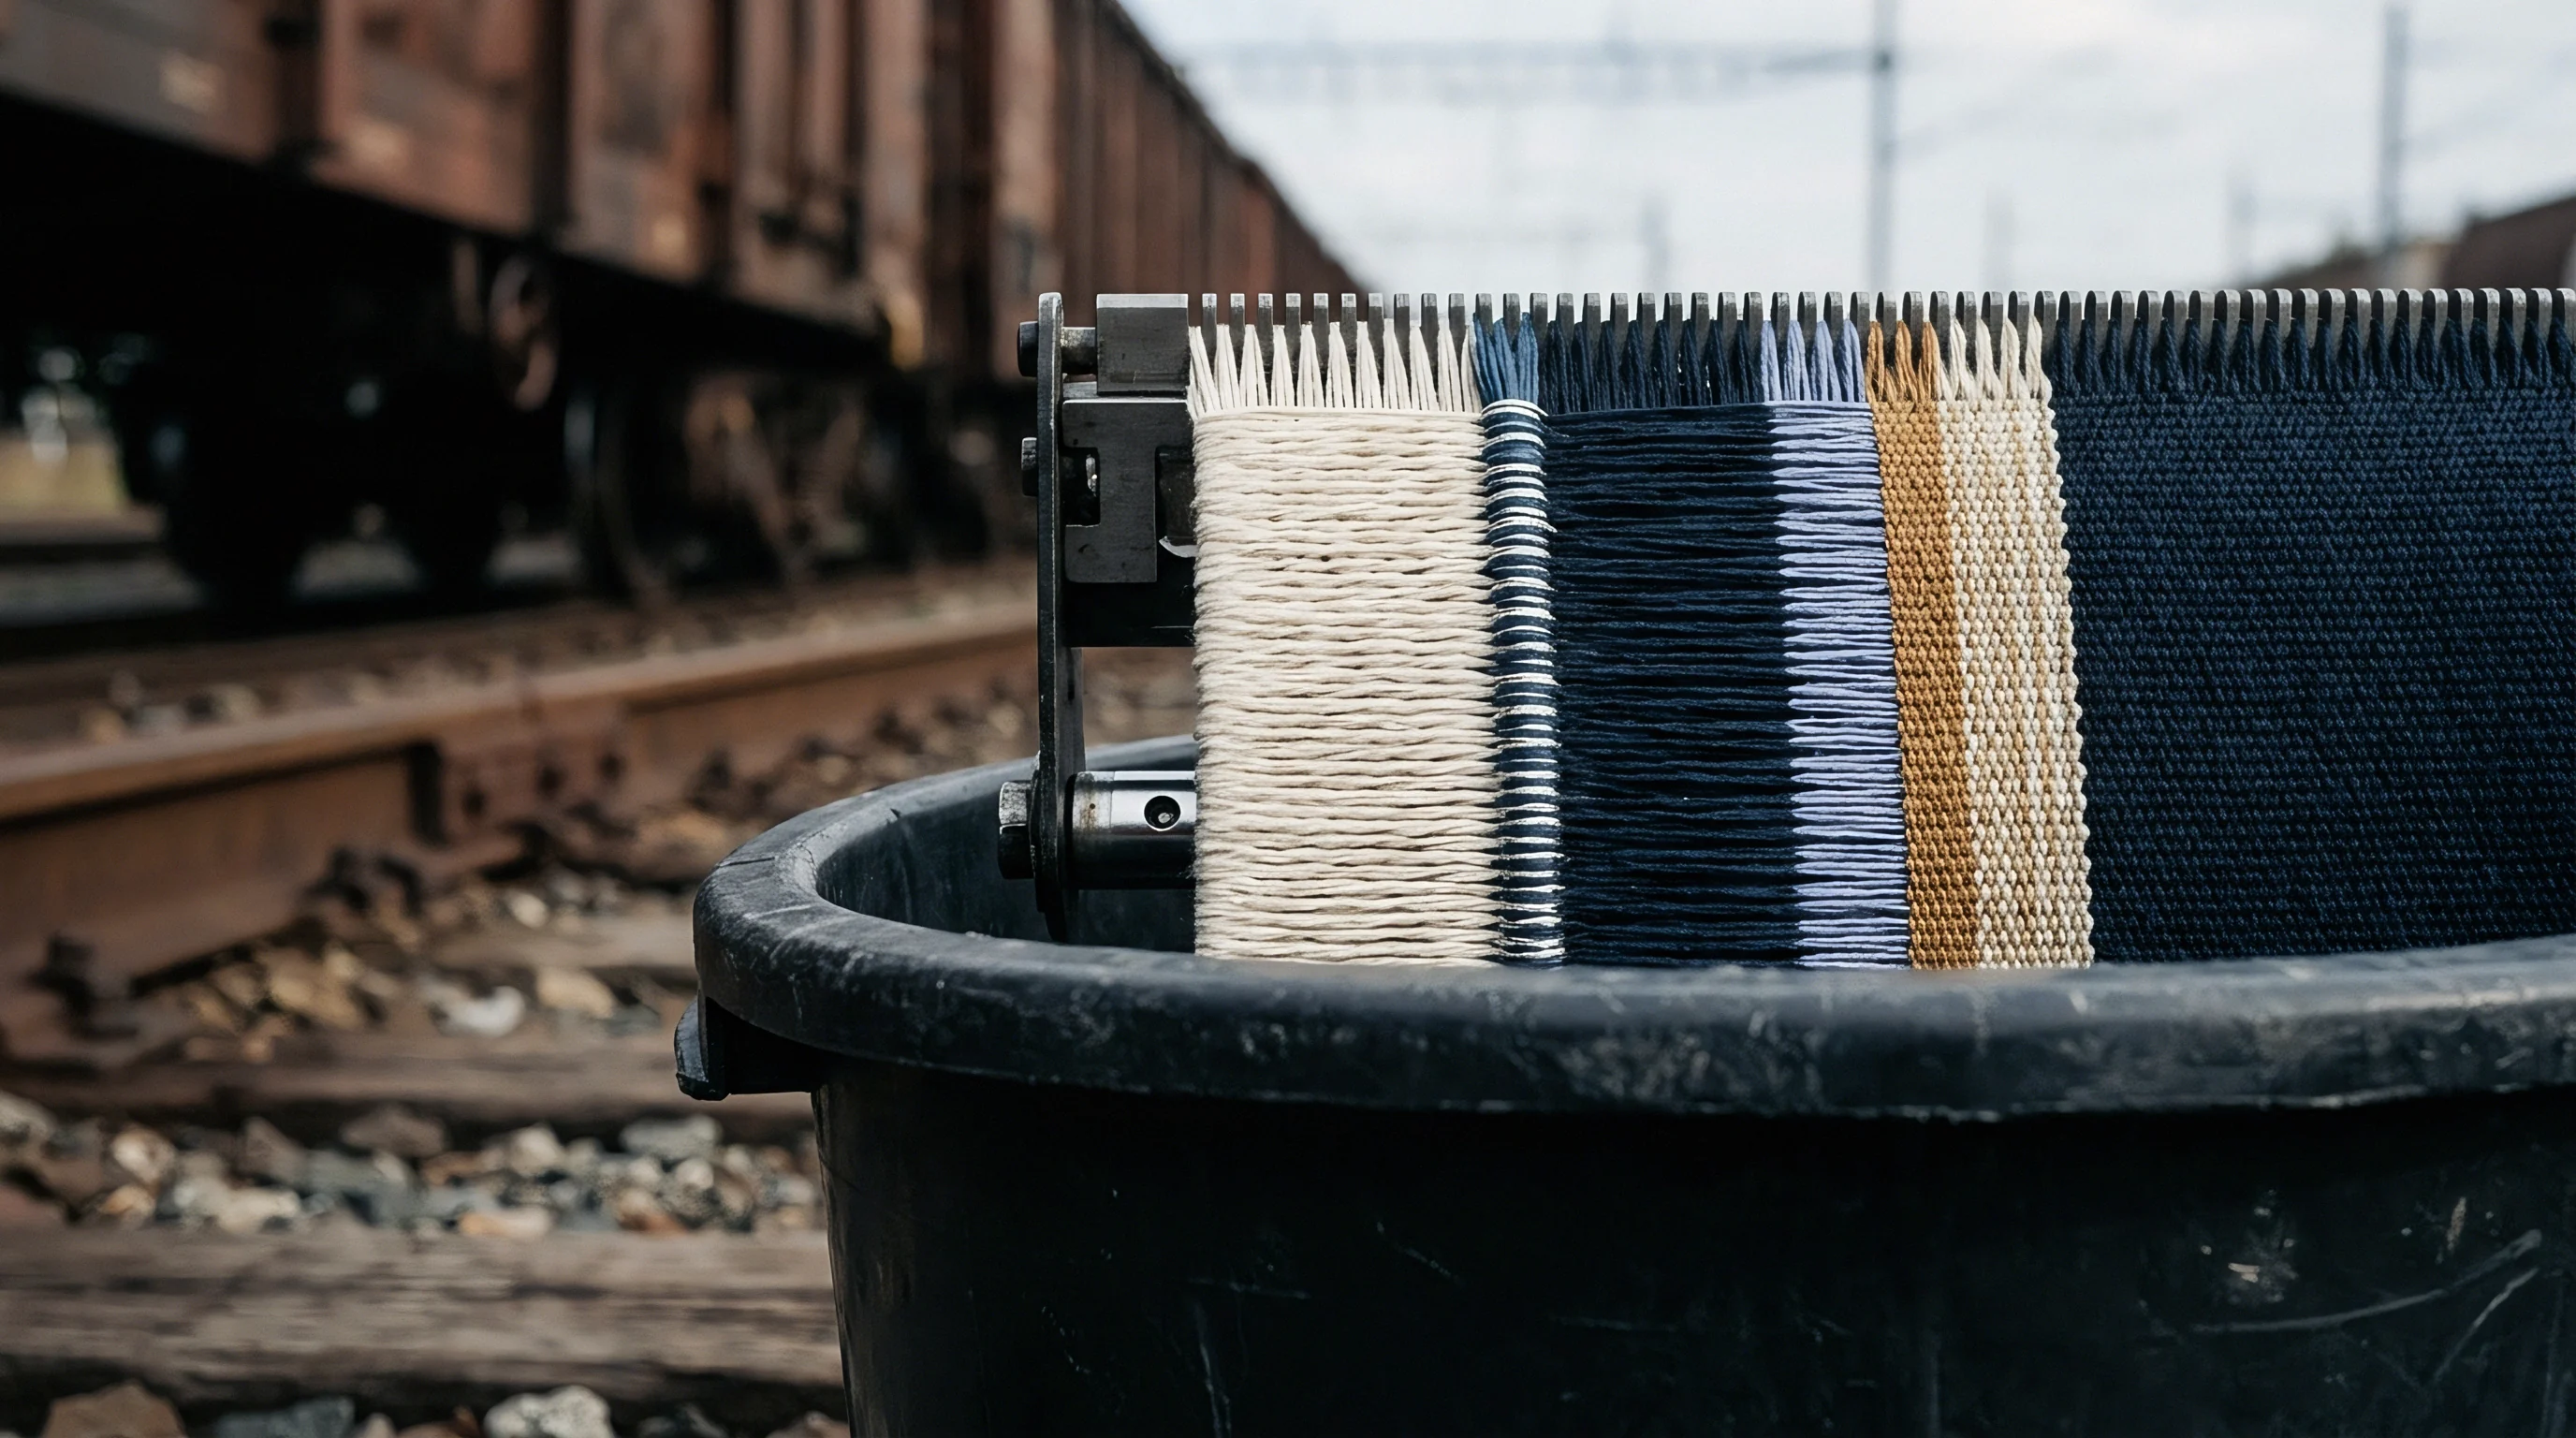
Tally
Multi-stage random sampling structures isolate point-to-point variance within rolls from systematic lot-wide trend shifts. Industrial greige shipments arrive as continuous two-dimensional surfaces wound into rolls. A single shipment of 1,000 rolls of 100-meter greige fabric contains 100,000 linear meters or approximately 160,000 square meters of material.
Treating this continuous yardage as a collection of discrete, homogeneous items violates classic sampling independence assumptions unless spatial variance components are explicitly modeled.
Total thread density variance across a mill shipment decomposes into three distinct random components: variance between different weaving lots (σ2lot), variance between individual rolls within the same lot (σ2roll), and variance between individual measurement locations along a single roll (σ2within). Acceptance audit design must allocate measurement resources efficiently across these three levels to minimize total estimation variance for a given inspection budget.
Nested Sampling Schemes for Continuous Roll Goods
Dividing a mill lot into primary roll units and secondary yardage locations prevents localized loom stops from skewing overall lot estimates. A two-stage nested sampling design selects m rolls at random from total shipment lot size N, followed by taking n density readings at specified linear locations along each selected roll. The grand mean estimated thread density barbarx derives from:
barbarx = frac1m · n sumi=1m sumj=1n xij
The total variance of the grand mean V(barbarx) is expressed mathematically by nested analysis of variance (ANOVA) logic:
V(barbarx) = fracσ2rollm + fracσ2withinm · n
When preliminary audits reveal that within-roll variance σ2within is small relative to roll-to-roll variance σ2roll, the audit strategy must maximize the number of sampled rolls m while taking fewer readings n per roll. Conversely, if loom let-off motor hunting creates high within-roll cyclic instability, increasing readings n per roll becomes necessary to prevent single-point measurement noise from corrupting roll means.
Random sample roll selection requires using pseudo-random number generators applied to container packing lists before unloading begins. Inspection teams must avoid convenience sampling, such as testing only top-tier rolls from opened pallets, as top rolls often originate from final loom beam cut-offs where warp tensioning drops during beam end runs.
| Weaving Machine Technology | Total Variance sigma sq total (picks/inch sq) | Between-Roll Variance Proportion (sigma sq roll / total) | Within-Roll Variance Proportion (sigma sq within / total) | Optimal Roll Sample Count m (for budget C) | Optimal Readings Per Roll n (for budget C) |
|---|---|---|---|---|---|
| Air-Jet Electronic Let-Off | 0.45 | 78.0% | 22.0% | 15 rolls | 3 readings |
| Air-Jet Mechanical Let-Off | 1.28 | 42.0% | 58.0% | 10 rolls | 8 readings |
| Rapier Electronic Let-Off | 0.62 | 71.0% | 29.0% | 12 rolls | 4 readings |
| Rapier Mechanical Let-Off | 1.85 | 35.0% | 65.0% | 8 rolls | 10 readings |

Decomposing within Roll and Roll to Roll Variance
Analysis of variance separates transient pick density fluctuations caused by let-off hunting from persistent warp tension errors. To perform variance component decomposition during a qualification audit, an engineer samples m = 10 rolls from a delivery lot and records n = 5 pick count readings per roll spaced at ten-meter intervals. The Sum of Squares Between Rolls (SSB) and Sum of Squares Within Rolls (SSW) are computed as follows:
SSB = n sumi=1m (barxi – barbarx)2
SSW = sumi=1m sumj=1n (xij – barxi)2
Dividing these sums of squares by their respective degrees of freedom (dfB = m – 1 = 9 and dfW = m(n – 1) = 40) yields the Mean Squares MSB and MSW. The expected mean squares equate to:
E = σ2within
E = σ2within + n · σ2roll
Isolating σ2roll allows calculation of the Variance Component Ratio (VCR = σ2roll / σ2within). If the VCR exceeds 2.0, loom-to-loom mechanical setup differences dominate the delivery, indicating that the weaving mill is running the contract order across uncalibrated, heterogeneous loom sheds. The buyer should mandate mill loom alignment before accepting subsequent monthly releases.
How Does Lot Size Govern Sample Selection Ratios?
Standard inspection tables adjust the required sample roll count based on total square meters delivered rather than simple linear length. Large industrial lots exhibit higher probability of encompassing multiple warp beam changes and yarn lot transitions. ANSI/ASQ Z1.9 provides code letter matrices that scale sample sizes non-linearly with lot size.
A delivery of 50 rolls requires a sample size code letter D (n=5), whereas a delivery of 1,000 rolls requires code letter K (n=35).
Non-linear scaling prevents over-sampling small lots while maintaining tight statistical confidence bounds on large industrial shipments. When a lot spans multiple sea freight containers, the sampling plan must stratify roll selection proportionately across every container. Sampling exclusively from a single container leaves the audit vulnerable to localized spatial damage, such as moisture absorption during maritime transit, corrupting lot statistics.
- Lot Identification Dossier catalog loom serial numbers, beam batch codes, and yarn lot designations to enable root-cause tracebacks when audit non-conformances trigger rejection.
- Primary Sample Matrix specifies the exact roll numbers drawn via random number generator before warehouse staff retrieve rolls from pallet storage bays.
- Positional Coordinate Grid defines the longitudinal distance and cross-web offsets for every thread count measurement taken on a sample roll.
- Discrepancy Logging Sheet records individual point counts alongside calculated roll means, highlights outliers exceeding three standard deviations for secondary re-testing.
Warp end counts stabilize near the reed during loom shedding, whereas pick density fluctuates continuously with take-up roll mechanical slip.
When within-roll variance dominates total lot variance, increasing the count of sampling points per roll yields greater audit accuracy than drawing additional rolls from the shipment.
Ledger
Technical fabric specifications bind both mill and converter to explicit numerical limits and financial settlement remedies. Statistical acceptance sampling serves as the objective arbiter determining whether a shipment earns full payment, incurs commercial penalty deductions, or faces total rejection at the mill’s expense. Without precise contractual clauses defining sampling plans, test methods, and disposition formulas, buyers lose leverage when receiving out-of-sett greige cloth.
Commercial contract documentation must translate technical thread count variances directly into financial adjustments.
When greige fabric fails a variables acceptance audit, immediate financial consequences apply. Rejecting a 100,000-meter lot creates severe supply chain disruption, delaying garment manufacturing schedules and risking retail seasonal stockouts. Contract settlement matrices provide structured commercial alternatives to total rejection, allowing converters to accept marginal lots under financial penalty schedules that offset downstream processing modifications.

Contractual Penalty Structures for off Sett Deliveries
Commercial invoices face automatic financial deductions when audited thread counts fall outside agreed tolerance bands. When filling pick density falls below contractual LSL, the buyer receives less yarn mass per meter than purchased, reducing fabric weight and structural integrity. Conversely, when pick density exceeds USL, the mill has over-inserted picks, increasing fabric weight but reducing linear yield after wet finishing width adjustment on the stenter frame.
The financial deduction calculation relies on a proportional mass and processing adjustment factor (Fadj). For pick counts falling below LSL, the financial penalty percentage (Plow) scales directly with the fractional pick deficit:
Plow = left( fracLSL – barxTarget Πck Count right) × Cweight × 100
In this equation, Cweight represents the contractual penalty multiplier, typically set between 1.5 and 2.0 to account for downstream processing risks like width instability and reduced tensile strength. For pick counts exceeding USL, the penalty (Phigh) addresses lost linear yield caused by excessive fabric contraction during scouring:
Phigh = left( fracbarx – USLTarget Πck Count right) × Cyield × 100
If the calculated quality statistic Q falls below the critical limit k by more than 0.5 units, the shipment transitions from penalty status to mandatory lot rejection. The supplier must then replace the lot at their sole expense, including round-trip ocean freight and customs duty clearance costs.
| Quality Statistic Status (Q vs Acceptability Constant k) | Mean Sett Deviation Range | Commercial Classification | Financial Settlement Action | Disposition Action |
|---|---|---|---|---|
| Q_LSL >= k and Q_USL >= k | Within ± 1.0% of target | Full Conformance | 100% invoice payment | Release immediately to wet-processing line |
| Q_LSL < k (down to k - 0.25) | – 1.1% to – 2.5% below LSL | Minor Non-Conformance | 3.0% invoice deduction on lot value | Accept lot under modified stenter settings |
| Q_USL < k (down to k - 0.25) | + 1.1% to + 2.5% above USL | Yield Non-Conformance | 4.5% invoice deduction on lot value | Accept lot with over-feed width adjustment |
| Q < k - 0.25 (down to k - 0.50) | ± 2.6% to ± 4.0% off target | Major Non-Conformance | 8.0% invoice deduction plus re-test fee | Hold lot; require 100% mill sorting |
| Q < k - 0.50 | Exceeding ± 4.0% off target | Critical Failure | Zero payment; full claim credit | Reject entire shipment; return to mill |

Arbitration Protocols and Independent Re Inspection Rules
Disputed inspection results trigger a formal re-sampling sequence conducted by an accredited third-party laboratory. When a supplier challenges a buyer’s lot rejection, the contract arbitration clause governs re-testing protocols. The arbitration standard operating procedure mandates drawing a double sample size (2n) from the retained lot under joint supervision of buyer and seller representatives.
Testing takes place at an ISO 17025 accredited independent textile laboratory. The laboratory must use the exact referee test method specified in the contract, typically ISO 7211-2 Method A after standard atmospheric conditioning for 48 hours.
To eliminate ambiguity, purchase orders must incorporate standardized arbitration language detailing sample selection, conditioning parameters, statistical decision rules, and cost allocations.
Converters that embed explicit statistical sampling plans directly into their greige purchase orders eliminate commercial ambiguity before yarn touches the loom. Clear acceptance thresholds protect both parties against market price fluctuations disguised as quality disputes.