Spectrophotometric Color Tolerance Standards in Bulk Fabric Conversion Runs
Spectrophotometric color tolerancing requires D65 optical calibration, CIEDE2000 ellipsoidal metrics, and strict substrate backing to ensure bulk dye batch agreement.
Bench
Color measurement on continuous dye lines relies on dual-beam sphere spectrophotometers with d/8 optical geometry. Standard industrial protocols call for specular component inclusion or exclusion depending on surface texture. Diffuse illumination inside a barium sulfate or Spectralon integrating sphere reduces sheen on flat wovens, whereas specular exclusion separates surface reflection from bulk dyestuff absorption.
Bench instruments establish baseline spectral reflectance curves across visible wavelengths from 360 nm to 750 nm at 10 nm intervals, forming the baseline data for digital shade matching.
Routine control requires checking instruments against certified ceramic calibration tiles before processing a batch. Black trap boxes capture internal dark current to set the lower photometric boundary, and high-reflectance white tiles set the upper limit. Temperature shifts in dyehouse testing rooms drift detector response, requiring recalibration every four hours or whenever room temperatures drift past the 20°C to 23°C operating window.
Spectrophotometers read light reflected from dyed surfaces. Digital color files sent between dyehouses can only replace physical swatch books when instrument geometries and aperture sizes match exactly across sites.

Geometry Selection and Specular Component Control
Diffuse illumination inside an integrating sphere coated with barium sulfate or Spectralon cuts out directional gloss from woven crimp and filament sheen. Modern bench instruments illuminate the sample at diffuse angles and measure reflected light at eight degrees off the perpendicular axis. Specular Component Included mode measures total reflectance, capturing both surface reflection and internal light scattering from dyestuff molecules.
For smooth filament fabrics, standard shade matching relies on Specular Component Included settings to remove finish variations from color checks.
Specular Component Excluded mode channels specular gloss into a light trap on the sphere wall. Trapping surface reflection isolates color as it appears on textured, slubbed, or micro-sanded fabrics. Heavy twills, corduroys, and brushed fleeces read as artificially light under Specular Component Included settings because direct surface glare enters the detector.
Contracts need to state whether specifications use Specular Component Included or Specular Component Excluded to avoid unwarranted lot rejections during bulk production.
Aperture Dimensions and Sample Area Representation
Field-of-view settings dictate how well an instrument averages out yarn irregularities across slubs, coarse knits, or textured weaves. Bench spectrophotometers use interchangeable port plates from Small Area View at 3 mm diameter up to Extra Large Area View at 30 mm. Small apertures catch micro-variations between individual warp and weft threads, introducing noise into single readings.
Large Area View settings at 25 mm or 30 mm light up thousands of yarn intersections at once, producing stable reflectance averages over uneven surfaces.
Bulk conversion specs require Large Area View readings for all piece-dyed and yarn-dyed production approvals. Standard sampling calls for four separate reads per swatch, turning the sample ninety degrees between flashes to cancel out orientation effects. Averaging these four flashes smooths out localized slub or knitting tension variations.
UV Calibration and Optical Brightening Agents
Fabrics treated with stilbene-based optical brighteners re-emit absorbed UV light into the violet-blue band between 420 nm and 470 nm. Measuring pastels, optical whites, and blend grounds accurately demands tight control over the lamp’s UV output. Unfiltered Xenon lamps emit high UV energy that over-excites brightening agents, creating artificial blue-reflectance peaks.
Calibration uses physical UV cut-off filters, such as 400 nm or 420 nm filters, set against standardized tiles like Whiteness Index standards under ISO 105-J01.
Automated UV systems move physical filters until measured fluorescence hits calibrated target values. Measuring fluorescent substrates without calibrated UV filters causes wide discrepancies between supplier and buyer bench readings. Dyehouse SOPs require daily UV calibration using fluorescent plastic tiles before clearing pastel or optical white production runs.
- Specular Component Inclusion Mode determines whether total surface reflection or only internal diffuse reflection enters the sphere for shade calculation.
- Aperture Port Diameter sets the physical surface area exposed to the Xenon flash during spectral measurement.
- Ultraviolet Filter Positioning controls how much excitation energy reaches optical brighteners in bleached or pastel fabrics.
- Photometric Linearity Testing checks sensor accuracy across deep, dark shades and high-reflectance light grounds.
Calibration logs record sphere wall reflectivity, lamp decay, and detector drift over time. Sphere coatings degrade as dyestuff vapors, lint, and finishing oils settle inside during operation. A loss of sphere reflectance greater than two percent across visible wavelengths requires re-coating or replacing the sphere to maintain accuracy on navy, dark green, and black shades.
A spectrophotometer calibrated with a ceramic white tile held within a thermal window of 20°C to 23°C maintains inter-instrument color drift below 0.15 CIEDE2000 units across multi-mill supply chains.
Consistent control relies on clean port plates and optical windows. Lint inside the optical chamber scatters beam energy, pulling reflectance curves down on dark shades. Procedures require weekly optical window checks, monthly dark trap cleaning, and annual linearity certification against traceable standards.
Batch variance often stems from uncalibrated lamp flash degradation rather than improper dye metering.


Illuminant
Standard daylight simulation serves as the baseline for shade clearance across global supply chains. The International Commission on Illumination defines standard illuminants by their spectral power distributions across visible wavelengths. Color evaluations rely on matching these emissions to the actual lighting environments where garments are inspected or sold.
Buyer contracts typically define primary, secondary, and tertiary illuminants to prevent unexpected shade shifts under store lighting.
A light source’s spectrum dictates how colors appear. Standard Illuminant D65 represents average northern sky daylight at a color temperature of roughly 6504 K. Illuminant A models incandescent tungsten lighting at 2856 K, putting out heavy energy in the red spectrum while dropping off in the blue. Fluorescents like Cool White (F02) and narrow-band tri-phosphor lamps like TL84 (F11) introduce sharp mercury peaks that react with dyes differently than continuous daylight.
As retail stores replace fluorescent tubes with narrow-band LEDs, shade evaluation standards must adapt. Standards like LED-B3 and LED-BH replicate commercial retail LED arrays, forcing dyehouses to calculate tristimulus values under solid-state spectra alongside traditional D65 references.
Standard Observers and Spectral Power Distributions
Most commercial textile specs rely on the CIE 1964 ten-degree observer data set. The older CIE 1931 two-degree observer miscalculates visual response on swatches larger than four centimeters at arm’s length. The ten-degree data accounts for wider retinal response, matching how people evaluate full-width fabric swatches and garment panels.
Spectral integration combines fabric reflectance curves with the illuminant’s spectral distribution and the ten-degree observer functions.
Tristimulus values X, Y, and Z measure overall red, green, and blue cone responses under a given light source. Converting these into uniform color spaces yields lightness, chroma, and hue values for comparing dye lots. Simply changing the mathematical illuminant shifts calculated coordinates without changing the fabric itself ~ which is why digital color exchange requires fixing both the illuminant table and observer angle across all participating labs.
Metamerism Index Calculation across Light Sources
Dyes that match perfectly under daylight often pull apart under store lights. Metamerism happens when two swatches match at specific cross-over wavelengths but diverge across the rest of the visible spectrum. Evaluation relies on the Special Metamerism Index calculated to AATCC EP9 or ISO 105-J03.
This index measures the color difference under a secondary light after adjusting reflectance curves so the samples match perfectly under the primary standard.
Metamerism leads to unexpected shade mismatches on retail floors. A metamerism index over 0.8 CIEDE2000 units under Illuminant A or TL84 relative to D65 signals high risk when garments move indoors from sunlight. Swapping dye recipes mid-run to cut chemical costs often introduces metamerism against the master lab dip, making spectral screening essential before approving bulk recipes.
| Illuminant Designation | Color Temperature (K) | Spectral Emission Focus | Primary Industrial Application |
|---|---|---|---|
| D65 | 6504 | Northern sky daylight simulation | Primary contract standard for global textile shade clearance |
| A | 2856 | Incandescent tungsten filament | Metamerism testing under residential indoor lighting conditions |
| F02 (CWF) | 4150 | Cool white fluorescent emission | North American retail lighting verification |
| TL84 (F11) | 4000 | Narrowband tri-phosphor fluorescent | European retail store lighting verification |
| LED-B3 | 3000 | Warm white light-emitting diode | Modern retail store display standard compliance |
Spectral Match Rating and Dyestuff Compatibility
Plotting absorption curves across 400 nm to 700 nm exposes formulation mismatches before fixing the dye. A true non-metameric match requires aligning spectral curves point-by-point across the visible spectrum, rather than matching three tristimulus numbers under a single light source. Recipe software checks curve shapes and flags bad dye choices with fit indices.
Three-dye combinations need matching exhaustion rates, thermal fixation behaviors, and absorption profiles. Mixing a reactive dye with a narrow absorption peak alongside dyes with broad absorption profiles causes severe metameric shifts under changing lights. Approving lab dips requires checks under at least three different illuminant spectra to ensure formula stability.
Multi-illuminant tolerances set explicit delta E limits under daylight and cap secondary metameric shifts. Brands commonly set a D65 limit of 0.80 CIEDE2000 units while capping secondary shifts under TL84 and Illuminant A at 0.50 delta E relative to D65. Quality teams re-screen continuous pad recipes against master spectral files whenever raw dye lots change at the mill.
It remains uncertain whether emerging solid-state retail light sources can be standardized rapidly enough across global brand portals to prevent unexpected metameric failures.

Formula
Color space formulas convert physical spectral reflectance into numeric coordinates for shade approval. CIELAB, established by the CIE in 1976, maps color across three axes: lightness, green-red, and blue-yellow. While accessible, CIELAB’s linear geometry does not reflect non-linear human visual perception across different hues, making ellipsoidal color difference formulas necessary for commercial fabric tolerances.
CIELAB assumes color space is visually uniform. Modern formulas account for visual compression in saturated hues by applying non-uniform weighting factors to lightness, chroma, and hue. These equations reshape tolerance boundaries into 3D ellipsoids that contract in sensitive regions like neutral greys and expand in bright yellows and oranges, where human eye sensitivity is lower.
Continuous dye runs evaluated across multiple mill operations show that CIEDE2000 correlates far better with trained human inspection panels than older CIELAB equations.

Historical CIELAB Limitations in Textile Tolerancing
The spherical tolerance bounds of 1976-era CIELAB misjudge human sensitivity along chroma and hue directions. Standard CIELAB calculates total color difference as straight Euclidean distance across lightness, a-star, and b-star. This linear assumption frequently misclassifies production runs ~ rejecting acceptable fabrics in high-chroma shades while passing obvious shade shifts in neutral greys or khakis.
The human eye is far more sensitive to hue shifts than to equal shifts in chroma or lightness. Standard CIELAB treats a 1.0 unit hue shift exactly like a 1.0 unit shift in saturation. Buyers using basic CIELAB risk accepting dye lots with noticeable hue drift, leading to shaded seams on finished garments.

CMC L: C Parameterization for Acceptance Pass Bounds
Weighting factors on lightness and chroma distort the tolerance ellipsoid to match human perception. The Color Measurement Committee of the Society of Dyers and Colourists developed the CMC(l:c) equation in 1984, scaling the ellipsoid axes to visual thresholds. Two user-set parameters ~ lightness ratio l and chroma ratio c ~ let different industries shape the tolerance envelope for specific end uses.
Standard apparel runs use a CMC 2:1 ratio, making lightness tolerances twice as wide as chroma bounds. Observers tolerate larger lightness swings in woven fabrics before calling a lot off-shade, whereas small shifts in chroma or hue cause immediate rejection. Tight applications like tailored suiting require a 1:1 ratio to weigh all dimensions equally.
| Equation Model | Weighting Mechanics | Parametric Ratios | Optimal Commercial Use Case |
|---|---|---|---|
| CIELAB (1976) | Euclidean distance in 3D space | 1:1:1 fixed ratios | Basic shade sorting and rough sorting baseline |
| CMC (l:c) | Ellipsoidal visual threshold scaling | 2:1 for pass-fail; 1:1 for imperceptibility | Woven goods and general apparel production clearance |
| CIE94 | Linear lightness and chroma correction | 1:1:1 default; 2:1:1 industrial textiles | High-chroma synthetic filament dyelots |
| CIEDE2000 | Non-linear rotation and hue terms | 1:1:1 apparel; 2:1:1 heavy knits and textures | Universal benchmark for multi-mill fabric conversion |
| Parametric ratios represent lightness, chroma, and hue weighting factors (kL:kC:kH) defined in ISO 105-J03. | |||
CIEDE2000 Ellipsoidal Weighting Mechanics
Non-linear rotation terms in modern formulas correct hue behavior in the blue spectrum while adjusting neutral grey lightness scales. CIEDE2000 (ISO 105-J03) includes five adjustment factors: lightness, chroma, and hue weighting, an interactive rotation term for blue, and a neutral grey scale factor. This captures non-linear human visual response far better than earlier models.
The rotation term RT addresses major distortions around the 275-degree hue angle in the blue region, where perceptual tolerance ellipses tilt significantly off the chroma axis. Without this correction, mills dyeing navy, royal blue, or slate see poor agreement between delta E numbers and light-box inspections. Default textile evaluations keep the parametric factors kL, kC, and kH at 1:1:1 unless fabric texture justifies widening lightness tolerances.
- Capture spectral reflectance data across 400 nm to 700 nm at 10 nm intervals using a calibrated sphere instrument.
- Convert reflectance values into CIELAB L a b coordinates using D65 illuminant data and the CIE 1964 ten-degree observer spectrum.
- Calculate delta E values using the CIEDE2000 formula with kL, kC, and kH parametric factors set to unity for standard apparel textiles.
- Compare calculated color differences against contract tolerance ellipsoids derived from approved master physical standards.

Why Do Differential Tolerances Vary across Shade Families?
Human visual thresholds tighten in dark navies and blacks and open up in pale pastels and saturated yellows. A total delta E of 0.80 CIEDE2000 on pastel pink is virtually unnoticeable to human inspectors. On jet black fabric, that same 0.80 delta E stands out clearly and causes visible shading across garment panels.
Effective shade clearance uses specific tolerance boundaries for different shade families. Specs often set tight limits of 0.50 CIEDE2000 for darks, navies, and blacks, while allowing up to 1.00 CIEDE2000 on high-chroma grounds. Lightness, chroma, and hue limits must be defined independently so that large hue shifts cannot hide behind an acceptable overall delta E.
Standard clauses specifying ISO 105-J03 with CMC 2:1 tolerancing establish a legally defensible pass-fail boundary that overrides subjective light-box assessments.
Digital master files need explicit formula settings, observer angles, and illuminant triplets embedded in their metadata. Sending target coordinates without these parameters leads to misinterpretation across dyehouse systems and causes bad clearances. Choosing the wrong equation for dark shades generates steady rejections of acceptable fabric, driving up waste and landed costs.
Substrate
Fabric construction alters how dyed goods reflect light into a detector. Woven, knitted, and non-woven structures react differently to flash illumination because of yarn surface topography, fiber lustre, and weave porosity. Greige goods changing during pad-steam or jet dyeing undergo physical surface changes during heat setting, calendering, and compacting, shifting reflectance regardless of dye exhaustion rates.
Standard testing protocols specify a mandatory four-hour conditioning period under standard atmospheric conditions before running spectrophotometric tests. Conditioning swatches per ISO 139 at 20°C and 65% relative humidity removes moisture-driven reflectance shifts in hydrophilic fibers. Construction details like end count, knit gauge, and filament decitex control light penetration and path length within the yarn matrix.
Swelling from absorbed humidity alters surface scattering, darkening cellulosic and protein fibers before measurement.

Optical Thickness and Backing Material Protocols
Light passes through thin or loose knits and reflects off the sample holder unless enough fabric layers back the swatch. Translucent samples let light bounce back off the holder, distorting spectral curves and tristimulus values. Reaching optical thickness means folding layers until adding another fold makes no difference to the reflectance numbers.
Standard procedures require backing translucent fabrics with a calibrated white ceramic tile. Alternatively, swatches are folded into four or eight layers depending on fabric weight. A 70 gsm chiffon needs eight folds to achieve opacity, while a 350 gsm denim twill needs only two.
Backing protocols must match between buyer and mill to get consistent inter-lab agreement.

Fiber Crimp and Nap Orientation Dynamics
Directional pile on fleece, corduroy, or velvet scatters light differently depending on how the nap aligns with the flash lamp. Reading a brushed surface against the nap traps light in the pile, giving artificially dark readings. Rotating that sample 180 degrees aligns the fibers with the beam, increasing surface reflection and raising lightness values.
Measuring wovens parallel to the warp helps avoid reflection distortion on twills and satins. Specs mandate exact orientation against the instrument aperture plate: warp threads run vertically for wovens, and wale loops run vertically for knits. Marking the grain on retain swatches ensures consistent alignment during bulk testing.
Moisture Regain Impact on Spectral Reflectance
Moisture in hydrophilic fibers like cotton, viscose, or wool shifts refractive index boundaries and lowers reflectance readings. Fully conditioned cotton poplin with 8.5 percent moisture regain measures up to 0.60 delta E darker than the same fabric checked fresh out of a dry stenter. Hot synthetics coming off drying frames show temporary thermochromism, shifting color until they cool to room temperature.
Conditioning cabinets bring swatches to thermal equilibration before measurement. Testing without thermal stabilization leads to false rejections on continuous lines. Lab SOPs require thirty minutes of passive cooling followed by four hours of standard atmospheric conditioning for hydrophilic goods coming off high-temperature finishing.
Chemical finishes change surface refractive indices and alter measured colors. Water repellents, silicone softeners, and durable press resins change surface texture or leave gloss films. Dye matchers adjust lab dips for these post-finish shifts, measuring master standards only after complete application and curing.
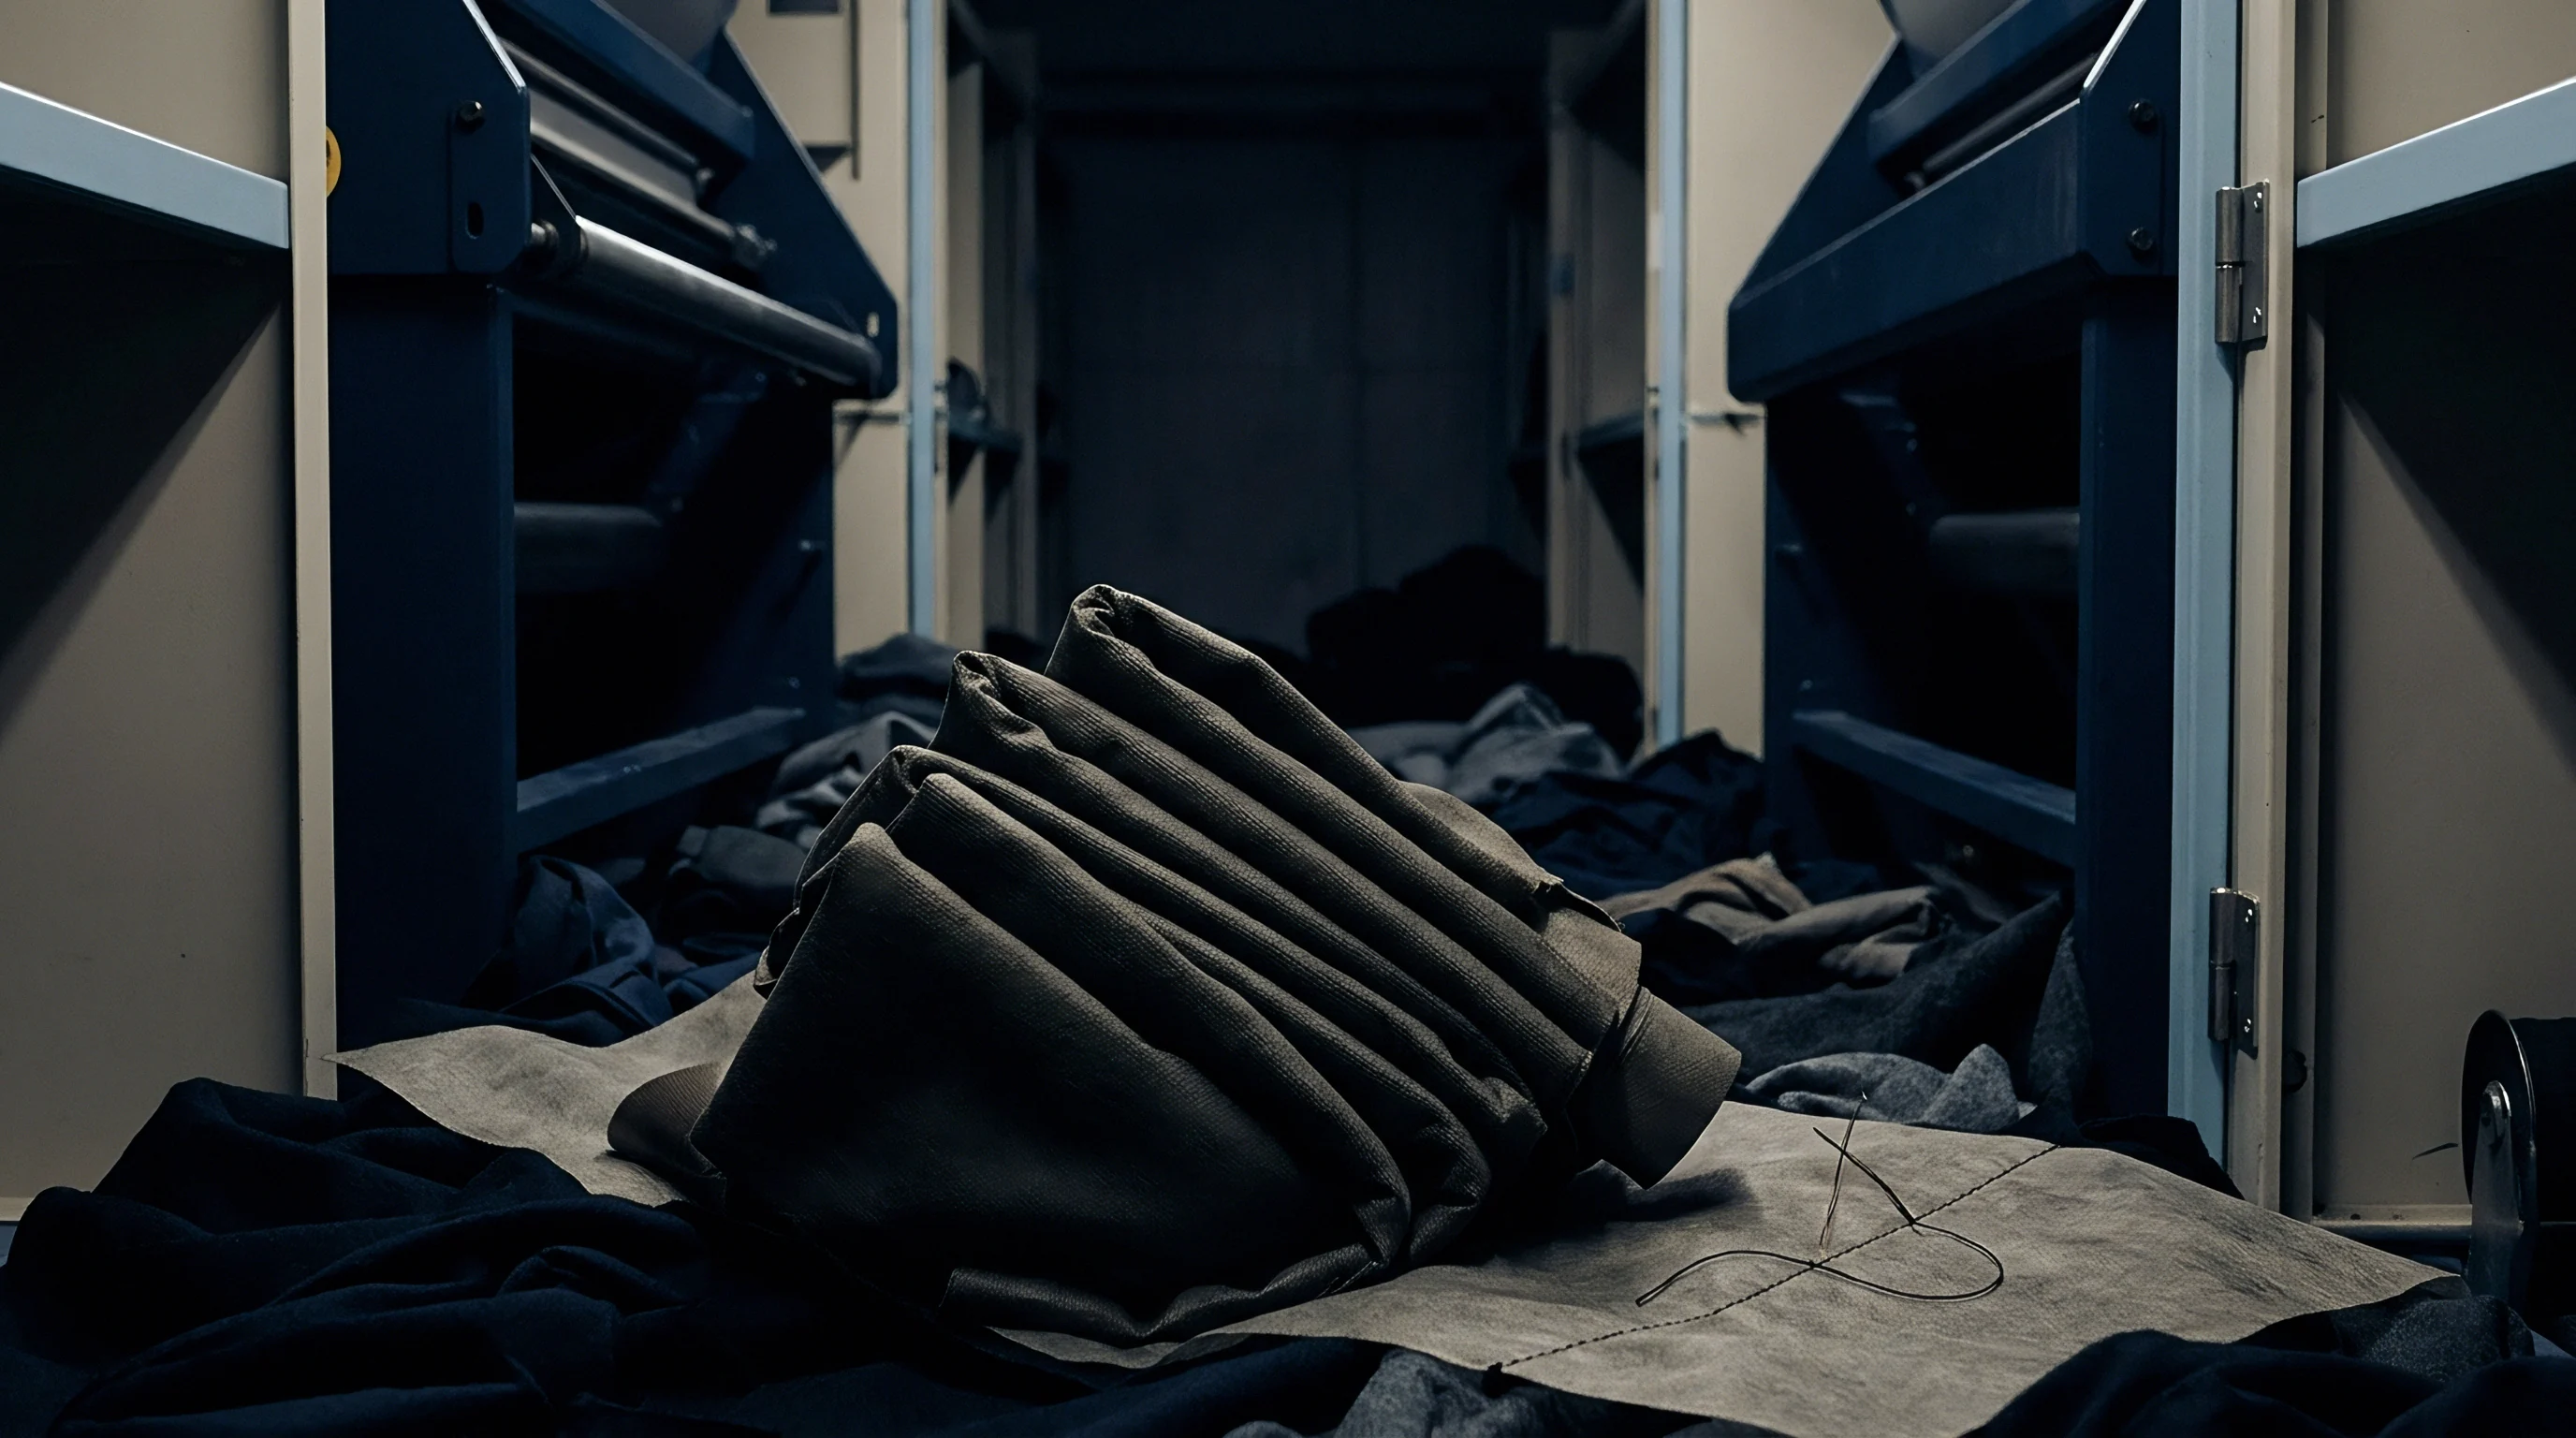
Folding lightweight fabrics until additional layers produce no further decrease in measured spectral reflectance ensures optical opacity during instrument reading.

Tolerance
Acceptance limits establish the numerical boundary between passable dye lots and off-shade rejections. Turning spectral reflectance into contract metrics requires setting target coordinates with tolerance ellipsoids tailored to the shade and end use. Continuous runs need two distinct boundaries: roll-to-roll consistency along the batch, and piece-to-master clearance against the buyer’s approved lab dip.
Continuous pad-thermosol and jet dyeing experience thermal, pressure, and dye depletion shifts over multi-thousand-meter runs. Maintaining tight tolerance bands across production keeps downstream sewing floors from running into panel-to-panel shading during cutting.
Maintaining an inter-instrument agreement threshold below 0.20 CIEDE2000 units reduces dispute incidence across commercial dyeworks by eighty percent.
Roll-to-Roll and List-to-List Variance Limits
Continuous pad-steam and thermosol lines experience thermal and pressure drifts that shift shade along both length and width. Side-to-center (list-to-list) shading happens when pad nip pressure varies across the roll width, causing uneven dye liquor pick-up. Edge-to-middle-to-edge evaluations take three readings across the usable width: left selvedge, center, and right selvedge.
List-to-list limits require internal roll variation to stay under 0.40 CIEDE2000 units so wide garment panels don’t shade. Roll-to-roll tracking measures color shift across 100-meter rolls through a run. Batch clearance permits up to 0.60 CIEDE2000 drift relative to the batch average, assuming all rolls remain within the buyer’s master tolerance ellipsoid.
| Fabric Category | Shade Depth Class | Target Delta E (dE00) | Maximum Delta C (dC00) | Maximum Delta H (dH00) |
|---|---|---|---|---|
| Critical Outerwear Wovens | Pastel and Medium Shades | 0.60 | 0.40 | 0.35 |
| Critical Outerwear Wovens | Dark and Navy/Black Shades | 0.80 | 0.50 | 0.45 |
| Casual Knits and Basic Fleece | Pastel and Medium Shades | 0.80 | 0.60 | 0.50 |
| Casual Knits and Basic Fleece | Dark and Navy/Black Shades | 1.10 | 0.75 | 0.65 |
| Workwear Heavy Twills | All Depth Categories | 1.20 | 0.85 | 0.70 |

Five Five Five Shade Sorting Algorithms
Clustering algorithms organize hundreds of finished rolls into visually uniform inventory groups based on 3D color coordinates. AATCC EP6 defines 555 shade sorting mechanics, dividing CIELAB color space into a 3D grid around master target coordinates. Every roll gets a three-digit code showing its grid position across lightness, chroma, and hue relative to target.
Code 555 designates rolls landing inside the central target box. A roll coded 655 is slightly lighter but matches on chroma and hue; code 455 marks slightly darker fabric. Cutting rooms receive rolls grouped by matching codes, ensuring all panels for a production lot come from compatible fabric and eliminating panel shading on finished garments.

Inter-Instrument Agreement and Reference Tile Verification
Spectrophotometers in different dyehouses show numerical variation when reading identical swatches. Inter-instrument agreement measures this systematic variance between different units reading the same reference standard. Bench units typically vary by 0.10 to 0.30 CIEDE2000 units because of optical component manufacturing tolerances, lamp aging, and sphere wear.
Calibration protocols use British Ceramic Research Association (BCRA) diagnostic tile sets to check spectral response differences across units. Testing ceramic tiles across multi-mill supply chains identifies hardware that needs servicing. Contracts require suppliers to align bench units against buyer master benchmarks, keeping inter-instrument delta E under 0.15 CIEDE2000 units on green and grey reference tiles.
- Master Standard Spectral File provides the primary digital reflectance baseline generated from the approved physical lab dip swatch.
- Illuminant Triplet Specification defines primary, secondary, and tertiary light sources for metamerism index screening across retail environments.
- Ellipsoidal Weighting Parameters establish lightness, chroma, and hue tolerances tailored to the specific fiber blend and dye class.
- Inter-Instrument Delta Boundary restricts numerical variance between the supplier spectrophotometer and the buyer reference benchmark.
Monitoring programs require monthly exchanges of physical check samples between buyer QC labs and mill testing benches. Reading identical swatches on both instruments separates hardware drift from actual fabric shade shifts. If inter-instrument drift exceeds 0.20 CIEDE2000 units, the mill stops digital approvals and schedules optical servicing and sphere recalibration.
Infrared pre-dryers with uneven thermal output cause lateral shade migration across continuous pad-thermosol runs.
Writing ISO 105-J03 spectral tolerance thresholds into the primary purchase contract places financial liability for off-shade continuous runs squarely on the wet processing plant.
Settlement
Resolving off-shade delivery disputes hinges on clear contract language agreed upon before processing. Conversion contracts must define measurement parameters explicitly: instrument geometry, aperture size, illuminant data, observer angles, color difference formulas, and pass-fail bounds. Standard clauses relying on vague terms like “commercially acceptable match” leave both parties exposed during bulk clearance.
Contracts require quantitative spectral acceptance limits. Digital master standard files containing spectral reflectance data replace vulnerable physical swatches as the legal reference. Swatches still provide evidence of surface texture, lustre, and construction, but embedded digital spectral files supply the permanent mathematical target for legal assessment.
Physical swatches stored in mill archives shift color over time from atmospheric gas fading, light exposure, humidity, and heat. Referencing digital spectral files recorded at initial lab dip approval eliminates swatch aging and prevents swatch degradation from creating commercial disputes.

Commercial Quality Specifications and Standard Clauses
Purchase contracts for bulk wet processing bind finished goods to quantitative spectrophotometric tolerances under standardized conditions. Standard contracts mandate compliance with ISO 105-J03 methods using CIEDE2000 (1:1:1) tolerancing under Illuminant D65 and the CIE 1964 ten-degree observer. Clauses establish explicit pass-fail criteria: goods measuring within the specified delta E boundary receive automatic acceptance, while goods exceeding limits face formal rejection and mill debiting.
Master agreements outline specific remedies for off-shade lots, including re-dyeing authorization, price discounts, or full lot replacement at mill expense. Contracts define sampling frequency, such as one test per 1,000 meters for continuous wovens or one per dye batch for exhaust knits. Clear language prevents mills from claiming visual acceptability in non-standard light boxes when spectral readings show off-shade numbers.
Technical Arbitration and Disputed Shade Claims
Shipment rejections trigger third-party re-testing using master physical standards and original retain swatches. Independent arbitration follows strict protocols to separate procedural testing errors from actual dye defects. The arbitrating lab conditions retain samples per ISO 139 for twenty-four hours before testing them on a certified spectrophotometer with verified inter-instrument alignment.
Lab dip approvals establish the target coordinates. Re-testing evaluates sample backing, specimen orientation, aperture selection, and calibration history across both buyer and mill reports. If third-party testing confirms off-shade status beyond contract limits under specified illuminants, financial liability for raw material, labor, and freight falls entirely on the processing plant.
Contracts specify joint verification for borderline lots landing in a buffer zone near tolerance limits. A batch measuring between 0.75 and 0.85 CIEDE2000 against a 0.80 limit undergoes joint visual inspection in calibrated viewing booths under agreed lighting. Inspection panels of certified color-normal observers evaluate panel compatibility before release, avoiding unnecessary scrap while maintaining garment quality.
Digital archiving protocols mandate storing physical retain swatches alongside raw spectral XML files for five years after production. Retaining raw reflectance data across 10 nm intervals allows retrospective recalculation if a brand updates store lighting standards or modifies color difference formulas in future seasons. Mandatory arbitration agreements requiring identical hardware configurations eliminate procedural discrepancies before independent testing starts.