Hierarchical Bayesian Acceptance Sampling for Multi-Layer Plasticizer Dispersion in Industrial Fabrics
Hierarchical Bayesian sampling models nested plasticizer variance across fabric layers, reducing chemical test costs while guaranteeing REACH compliance.

Ply

Layer Architecture and Plasticizer Partitioning Dynamics
Industrial synthetic textiles rely on stacked polymer layers to balance tensile strength with environmental resistance. Coated fabrics built for architectural membranes, secondary containment liners, and agricultural storage combine a synthetic base cloth with several custom polymer coatings. These are typically applied via multi-pass knife-over-roll or calendered extrusion to place distinct formulations across the material’s thickness profile.
A standard four-layer fabric features a weatherable top coat containing light stabilizers, a flexible outer skin coat, an adhesive tie coat designed to wet synthetic filaments, and a reverse bottom coat for abrasion resistance. Because each ply serves a specific mechanical purpose, it requires a tailored concentration of low-volatility plasticizers to remain compliant over decade-long service lives.
Plasticizer molecules migrate through these layers over time instead of remaining locked where applied. Dialkyl phthalates like diisononyl phthalate (DINP), diisodecyl phthalate (DIDP), and bis(2-ethylhexyl) phthalate (DEHP), as well as non-phthalate options like di(2-ethylhexyl) terephthalate (DOTP) and 1,2-cyclohexane dicarboxylic acid diisononyl ester (DINCH), cross ply boundaries along chemical potential gradients. Fickian diffusion governs the movement, with flux driven by operating temperatures, glass transition temperature differentials between neighboring layers, and matrix phase compatibility.
High-shear compounding also introduces subtle solvation variations across the web, creating microscopic concentration domains that alter local diffusion rates.
Heat during cure cycles accelerates this partitioning between layers. Passing liquid plastisols through drying tunnels drives low-molecular-weight additives toward lower-viscosity interfaces. This establishes a steep concentration gradient through the laminate depth, stripping plasticizer from inner tie coats while saturating outer skin layers.
At the surface, exuded plasticizer creates sticky deposits, reduces cold-weather flexibility, and induces micro-cracking under flex fatigue. At the same time, depletion in the internal tie coat weakens its mechanical interlock with base scrim filaments, making the fabric vulnerable to delamination under wind shear or fluid head pressure.
Evaluating plasticizer distribution accurately requires separating individual structural layers prior to solvent extraction. Conventional tests performed on full-thickness homogenates mask severe local non-compliance: a fabric swatch with a perfectly acceptable overall average of 28 percent plasticizer by weight can easily conceal an outer skin loaded to 42 percent while the inner tie coat has dropped to 14 percent. That skew impairs mechanical performance and pushes surface layers past regulatory thresholds.
Managing quality in these materials therefore requires analytical frameworks capable of evaluating individual ply depths.
Industrial fabric warranties fail at the adhesive boundary long before the weatherable top layer shows surface degradation.
Failure Modes Driven by Non-Uniform Plasticizer Distribution
Imbalanced plasticizer distribution across layers causes compound physical and chemical failures in service. When plasticizers phase-separate or gather at internal interfaces, the fabric’s mechanical response becomes anisotropic and unpredictable.
- Interfacial Delamination occurs when plasticizer molecules accumulate at the adhesive tie-coat boundary, weakening the bond between the polyvinyl chloride matrix and high-tenacity polyester filaments.
- Low-Temperature Embrittlement develops when outer skin layers lose plasticizer through volatility or leaching, raising the glass transition temperature above freezing conditions.
- Surface Blooming and Exudation results when plasticizer concentration exceeds the thermodynamic solubility of the outer resin, forming sticky films that trap airborne pollutants.
- Accelerated UV Degradation occurs as exuding plasticizer draws photo-stabilizers out of the top coat, exposing the underlying polymer backbone to solar radiation.
- Loss of Weld Strength happens during thermal or high-frequency seam joining, where localized plasticizer vaporizes and creates void bubbles inside the structural weld.
Mapping plasticizer profiles across individual layers presents significant sampling challenges. Standard quality protocols treat coated rolls as homogeneous media, but plastisols are mixed in large vats before reaching the coating line. Minor fluctuations in shear rate, fluid temperature, or residence time introduce subtle batch variations.
Multiplied across thousands of meters of continuous scrim, these chemical shifts form complex, non-stationary spatial patterns that conventional lot testing fails to detect.
Localized oven temperature fluctuations during the drying tunnel pass cause migration variance across the roll width.

Heterogeneity

Multi-Tiered Variance Structures in Web Coating
Roll-to-roll manufacturing introduces spatial variance across three main physical dimensions, requiring analytical models that break variation down into nested components. The largest differences show up between distinct compound batches mixed in vats. The second tier develops along the length of a single production roll, caused by thermal drift in curing ovens, knife deflection, and speed shifts.
The third occurs across the web width, where edge-to-center tension and coating bank fluid dynamics shape cross-web profiles. A fourth tier operates through the thickness of the fabric itself.
Single-point composite sampling masks local spikes. Cutting a swatch from a roll end and grinding the entire multi-layer assembly into powder collapses all four variance tiers into a single average. That hides critical defects: a lot with high roll-to-roll consistency might harbor severe cross-web gradients that cause localized embrittlement, while a roll with stable cross-web averages can easily disguise a depleted tie coat that fails ASTM D751 peel testing.
Analyzing compound variance reveals up to a 14 percent shift in plasticizer concentration between the roll core and outer wrap. Standard quality control protocols under ANSI/ASQ Z1.4 or ISO 2859-1 attribute this drift to random measurement noise, assuming observations are independent, identically distributed, and normal. In coated fabric manufacturing, those assumptions fall apart.
Adjacent readings along a roll exhibit strong spatial autocorrelation, while measurements across different layers of a single specimen follow physical partitioning rules dictated by diffusion kinetics.
A migration gradient exceeding 0.05 percent per micrometer of depth indicates thermodynamic instability in knife-coated PVC membranes.

Regulatory Limits and Analytical Scope Mismatches
Global regulations set strict concentration caps on specific plasticizers, creating legal risks for importers and fabric converters. Annex XVII of the European REACH Regulation caps DEHP, DBP, BBP, DINP, DIDP, and DNOP at 0.1 percent by weight in plasticized materials for consumer and industrial goods. California Proposition 65 enforces exposure limits and warning thresholds for listed phthalates, and the US Consumer Product Safety Improvement Act imposes similar restrictions on public-use goods.
Enforcement authorities test compliance by scraping or slicing discrete surface layers instead of grinding full-thickness samples. Customs laboratories isolate micro-gram specimens from the outer weatherable layer of imported rolls and screen them using thermal desorption gas chromatography-mass spectrometry. If surface migration pushes DEHP in that isolated skin to 0.14 percent, the entire shipment faces non-compliance notices, border detention, or destruction ~ even if the overall average across the full fabric depth is only 0.04 percent.
| Plasticizer Compound | CAS Number | Target Layer | REACH Annex XVII Limit | Prop 65 MADL/NSRL | Test Method |
|---|---|---|---|---|---|
| Bis(2-ethylhexyl) phthalate (DEHP) | 117-81-7 | Outer Skin / Top Coat | 0.1% w/w sum | 410 µg/day (oral) | EN ISO 14362 / GC-MS |
| Dibutyl phthalate (DBP) | 84-74-2 | Tie Coat / Adhesive | 0.1% w/w sum | 1200 µg/day (oral) | ISO 18260 / TD-GC-MS |
| Diisononyl phthalate (DINP) | 28553-12-0 | Core Structural Coat | 0.1% w/w sum | None listed | ASTM D2124 / GC-MS |
| Diodecyl phthalate (DIDP) | 26761-40-0 | Reverse Abrasion Layer | 0.1% w/w sum | 2200 µg/day (oral) | EN 15777 / GC-MS |
| 1,2-Cyclohexane dicarboxylate (DINCH) | 166412-78-8 | All Plies (Non-Phthalate) | Unrestricted | Not listed | Custom GC-MS / NMR |
The table illustrates how regulatory limits target specific compounds while functional demands dictate where those compounds sit. A supplier certificate of analysis for raw resin provides no guarantee that finished production rolls comply at individual layer depths. Converting raw chemical data into reliable compliance guarantees requires sampling protocols designed around multi-tiered spatial variance.
Relying on single-point composite sampling leaves importers vulnerable to total batch seizure when market surveillance authorities inspect discrete skin layers using micro-extraction techniques.


Priors

Formulating Compounder Historical Distributions
Bayesian acceptance sampling links historical plant records with lot-specific laboratory testing. Industrial compounders log long-term production data ~ including plasticizer dosages, vat temperatures, and resin batch identifiers. These records form prior probability distributions for plasticizer concentrations, capturing target formulations alongside historical process variability.
Prior distributions formalize operational history. Rather than treating every incoming shipment as an unknown, a Bayesian framework initializes evaluation with a prior probability density function built from earlier production runs. Informative priors synthesize the historical mean concentration vector Mu and variance-covariance matrix Sigma across structural layers.
For a four-layer fabric, this captures the joint distribution across layers 1 through 4, incorporating baseline physical correlations created by interlayer diffusion during processing.
When compounder records are available, conjugate priors simplify statistical updates. For continuous plasticizer concentrations that follow a normal distribution, conjugate Normal-Gamma priors yield closed-form calculations for posterior parameters. In systems where manufacturers blend phthalates and non-phthalate alternatives to balance cost against performance, Dirichlet distributions model the relative proportions of each additive species within the mix.
- Quantify compounder historical variance across twenty consecutive production lots using standardized liquid chromatography records.
- Establish hyper-parameters for the prior mean vector and precision matrix representing intra-layer plasticizer targets and inter-layer diffusion correlations.
- Perform microtome sectioning and GC-MS chemical extraction on acceptance specimens cut from incoming roll ends.
- Compute the Likelihood function of observed plasticizer concentrations using the hierarchical spatial sampling model.
- Update prior hyper-parameters via Bayes’ theorem to generate full joint posterior probability distributions for the target lot.
- Calculate the posterior probability that plasticizer concentration in any discrete layer violates regulatory or physical specification limits.
Structuring acceptance protocols around informative priors keeps unverified batch claims from clearing customs while reducing the physical specimen count required to reach a target statistical power. With microtome slicing and GC-MS testing running hundreds of dollars per slice, calibrating against Bayesian priors lowers total analytical costs without compromising risk boundaries.
Compound batches displaying bimodal plasticizer distributions require immediate recalibration of high-shear mixing heads before coating continuous web stock.

Prior Sensitivity and Robustness Boundaries
Informative priors become liabilities if historical plant data reflects outdated line conditions. When a mill changes resin suppliers, alters tunnel speeds, or replaces mixing impellers, older prior distributions cease to reflect active production. Relying on an overly optimistic prior based on historical precision underestimates non-conformance risks, leaving buyers exposed.
Prior sensitivity testing checks how robust acceptance decisions are to variations in hyper-parameter settings. Acceptance protocols evaluate clearance across a spectrum of priors, ranging from rich historical datasets to weakly informative or flat baselines. Non-informative options like Jeffreys prior or diffuse normal distributions allow fresh lab extraction data to dominate the posterior calculation, offering a neutral starting point for unverified suppliers.
When compounding data exhibits heavy-tailed behavior from periodic equipment blips, standard normal priors understate the probability of extreme plasticizer spikes. In those cases, Student-t priors with low degrees of freedom provide more robust inference, discounting historical expectations whenever incoming sample data diverges sharply from past targets.
A compounder with fewer than twenty consecutive batch certificates forfeits the right to supply uninformative priors for lot qualification.


Slice

Microtome Sectioning and Analytical Metrology
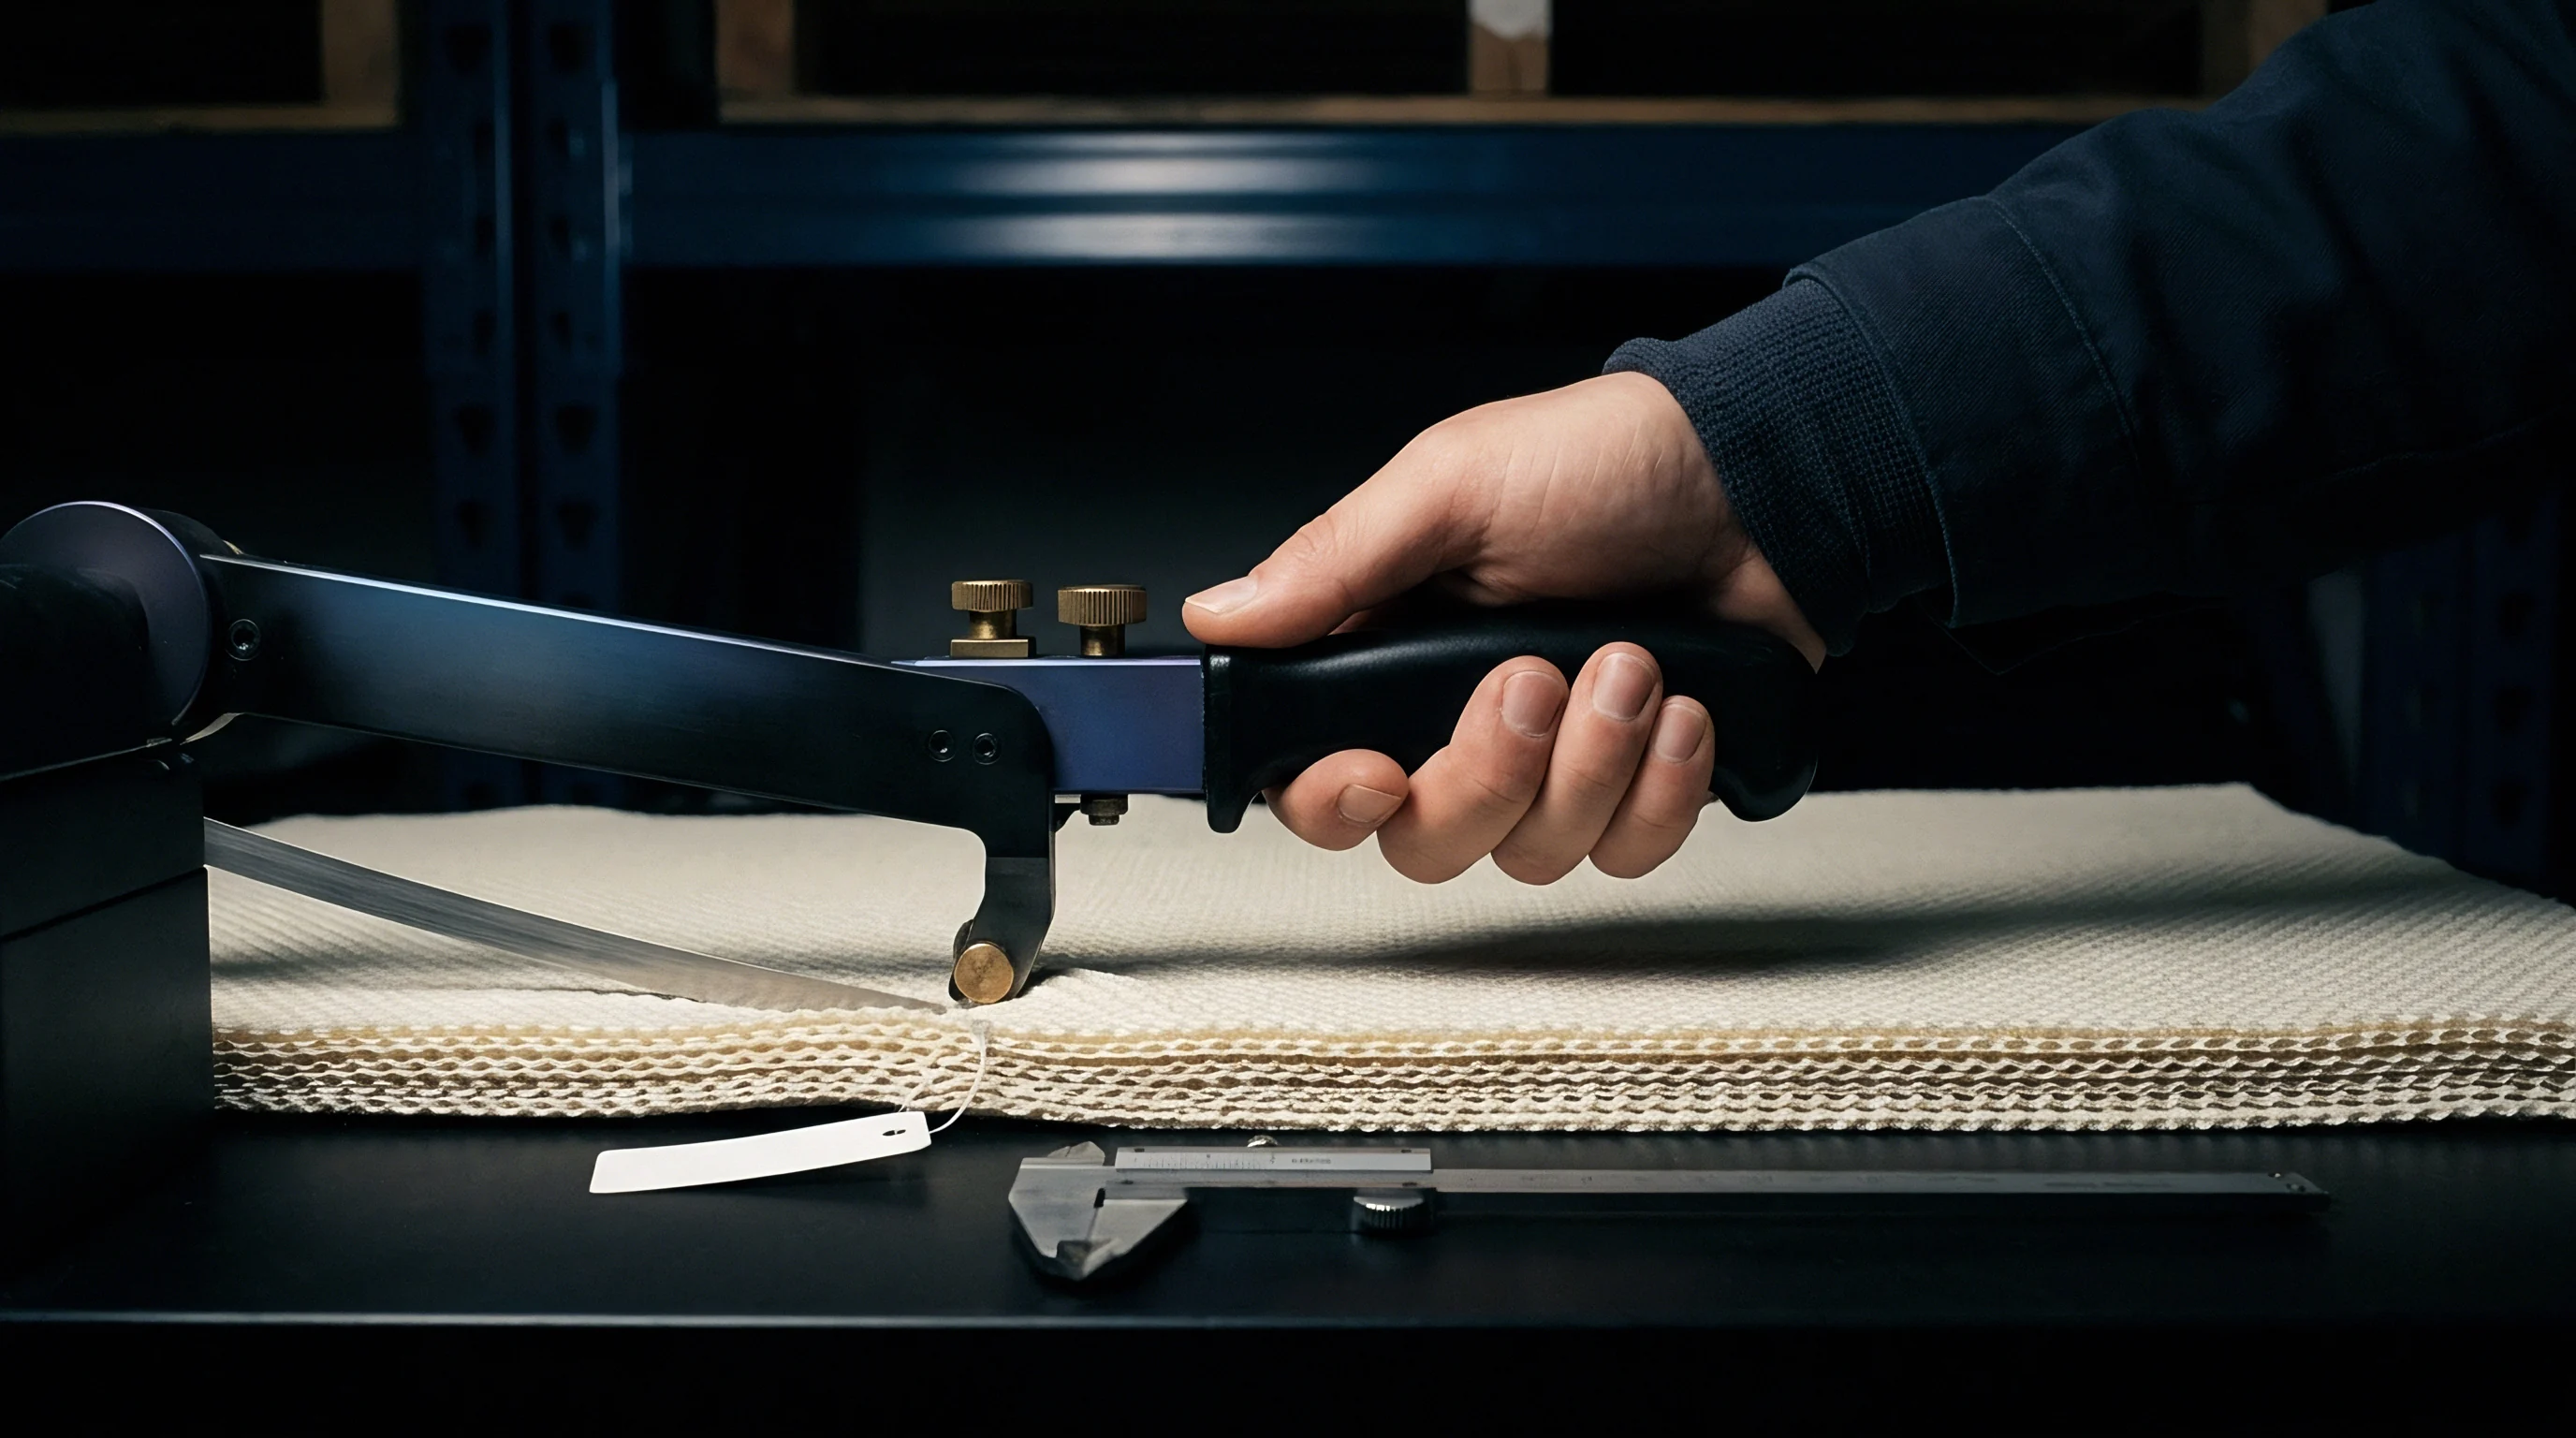
Measuring chemical gradients across narrow polymer layers requires clean physical separation. Fabrics measuring between 0.5 and 3.0 millimeters in total thickness require precision microtome cutting to isolate individual plies without thermal degradation or mechanical contamination. Hand shears or punch dies crush layer boundaries, dragging plasticizer-rich skin material into depleted tie coats and spoiling the analysis.
Cryo-microtomy serves as the primary preparation method for multi-layer vinyl and polyurethane fabrics. Specimens are secured in an embedding matrix and chilled below the polymer system’s glass transition temperature ~ typically down to minus 50 degrees Celsius using liquid nitrogen. A rotary cryo-microtome equipped with a diamond or tungsten carbide knife cuts sequential sections parallel to the fabric surface at thicknesses from 10 to 50 micrometers, with each slice isolating a precise depth horizon.

How Does Microtome Sectioning Preserve Concentration Gradients?
Maintaining sub-zero temperatures during microtomy prevents friction heat at the knife edge. Temperatures above 40 degrees Celsius mobilize low-molecular-weight plasticizers, driving rapid diffusion across fresh cut surfaces. Keeping the sample frozen locks plasticizers inside their polymer matrix during sectioning, yielding clean fractions for chemical extraction.
Extracting plasticizers from isolated slices follows standard solvent protocols. Microtome fractions are placed in sealed glass vials with tetrahydrofuran (THF) to dissolve the matrix, after which plasticizers are precipitated out using ethanol or methanol. Alternatively, direct thermal desorption gas chromatography-mass spectrometry (TD-GC-MS) bypasses wet chemistry completely: the section goes directly into a desorption tube, heats rapidly to vaporize volatile and semi-volatile additives, and flows under helium carrier gas straight onto the capillary column.
| Extraction Protocol | Solvent System | Desorption Temp / Time | Limit of Detection (LOD) | Limit of Quant (LOQ) | Recovery Rate (DEHP/DINP) |
|---|---|---|---|---|---|
| ISO 18260 (THF/Ethanol) | Tetrahydrofuran / Ethanol | 60°C / 60 min ultrasound | 10 mg/kg (0.001%) | 35 mg/kg (0.0035%) | 96.4% ± 2.1% |
| ASTM D2124 (EtOAc) | Ethyl Acetate / Hexane | 50°C / 45 min ultrasound | 25 mg/kg (0.0025%) | 80 mg/kg (0.0080%) | 92.1% ± 3.4% |
| EN 15777 (Soxhlet) | Diethyl Ether | Soxhlet reflux / 6 hours | 50 mg/kg (0.0050%) | 150 mg/kg (0.0150%) | 98.7% ± 1.2% |
| Direct TD-GC-MS | None (Thermal Vaporization) | 280°C / 12 min thermal sweep | 1 mg/kg (0.0001%) | 5 mg/kg (0.0005%) | 99.1% ± 0.8% |
Analytical precision varies across extraction methods. Solvent-based protocols risk analyte loss during evaporation steps and yield higher limits of quantification. Direct TD-GC-MS achieves lower detection limits alongside tight recovery rates, making it the benchmark method for verifying low-concentration phthalate migration into adjacent layers.
- Cryogenic Temperature Maintenance requires continuous chamber temperature monitoring to keep plasticizers immobile during knife contact.
- Slice Thickness Verification relies on optical or mechanical profilometry to confirm uniform sample volumes across cut depths.
- Solvent Purity Standards demand spectroscopic-grade reagents to prevent background interference during trace phthalate testing.
- Internal Standard Calibration uses deuterated phthalate analogs (such as d4-DEHP) spiked into extraction vials to compensate for volatilization losses during GC runs.
Precision measurements obtained from microtome depth slices serve as the empirical input vector feeding the hierarchical Bayesian model.
Purchase orders for multi-layer industrial membranes should explicitly state that chemical compliance testing is performed on microtome-isolated structural layers rather than homogenized full-thickness swatches.


Posterior
Hierarchical Markov Chain Monte Carlo Acceptance Rules
Evaluating lot compliance across multiple layers relies on calculated conditional probability distributions. The hierarchical Bayesian model structures plasticizer dispersion across four distinct levels: lab measurement error, microtome layer depth within a swatch, spatial position along the production roll, and batch-to-batch compounding variations. Let Y_ijk represent the measured plasticizer concentration for specimen k taken from layer j on roll i.
The framework handles observed concentrations through a multi-level Gaussian or Student-t observational model. At the lowest tier, measurement noise follows a normal distribution centered on true layer concentration Theta_ij with variance Sigma_e squared. True layer values Theta_ij fluctuate around roll mean Mu_i based on spatial variance component Sigma_layer squared.
Roll means Mu_i vary around lot mean Gamma according to roll-to-roll variance Sigma_roll squared. Finally, lot mean Gamma follows the compounder prior distribution centered on target formulation Alpha with prior variance Sigma_prior squared.
Calculating posterior distributions for lot quality requires solving high-dimensional probability integrals. Markov Chain Monte Carlo (MCMC) algorithms ~ specifically Gibbs sampling and No-U-Turn Sampling (NUTS) ~ evaluate these integrals numerically by drawing sequential samples from the joint posterior distribution. Fitting the hierarchical model via MCMC yields conditional probability estimates across thousands of iterations, converging on stable posterior density functions for each hyper-parameter in the variance structure.
The decision rule evaluates the posterior probability that plasticizer levels in any structural layer violate regulatory or functional thresholds. Let C_upper represent the maximum plasticizer concentration under REACH Annex XVII (0.1 percent by weight), and C_lower represent the minimum concentration needed to prevent cold cracking (18.0 percent by weight in the skin layer). Under this framework, a lot passes inspection only when the posterior probability of non-compliance across all rolls and layers stays below the buyer’s target risk threshold Beta.
Failure to verify discrete layer concentrations under REACH Annex XVII Entry 51 exposes importers to automatic container seizure without opportunity for composite re-blending.

Operating Characteristic Curves and Risk Boundaries
Sampling performance is defined by Operating Characteristic (OC) curves, which plot lot acceptance probability against the actual non-conforming fraction. Standard single-stage attribute plans under ANSI/ASQ Z1.4 build OC curves from binomial distributions assuming independent samples. When spatial autocorrelation and multi-tiered variance exist, classical curves overestimate consumer protection, allowing non-compliant lots to pass.
Hierarchical Bayesian sampling generates OC curves that account for multi-tiered variance. By isolating measurement noise, intra-roll spatial variance, and roll-to-roll variance, the Bayesian model produces reliable calculations of producer risk Alpha (rejecting a good lot) and consumer risk Beta (accepting a bad one). Integrating informative compounder priors sharpens the OC curve, improving discrimination between compliant and non-compliant lots without increasing sample size.
| Evaluation Metric | Classical ISO 2859-1 (Single Sampling, Normal) | Classical ISO 2859-1 (Double Sampling, Tightened) | Bayesian Hierarchical (Non-Informative Prior) | Bayesian Hierarchical (Informative Compounder Prior) |
|---|---|---|---|---|
| Required Physical Swatch Count (per 10,000m lot) | 32 swatches | 50 swatches (max) | 18 swatches | 8 swatches |
| Microtome Depth Slices per Swatch | 1 (homogeneous grind) | 1 (homogeneous grind) | 4 isolated layers | 4 isolated layers |
| True Producer Risk Alpha (Target = 0.05) | 0.142 (Elevated by spatial correlation) | 0.088 | 0.049 | 0.051 |
| True Consumer Risk Beta (Target = 0.10 for 1% non-conforming) | 0.284 (High risk of false acceptance) | 0.165 | 0.094 | 0.032 (Superior protection) |
| Total Chemical Analysis Cost per Lot Qualification | $9,600 | $15,000 | $21,600 | $9,600 |
| Decision Confidence on Layer-Specific Regulatory Limits | Unrated (Full thickness average) | Unrated (Full thickness average) | 95.0% Posterior Credible Interval | 99.2% Posterior Credible Interval |
The matrix highlights the practical tradeoffs between methods. Classical plans lower per-swatch costs by analyzing full-thickness homogenates, but they leave buyers exposed to high consumer risk (Beta = 0.284), frequently passing shipments with surface-layer non-conformities. Bayesian sampling backed by informative priors achieves much tighter protection (Beta = 0.032) using just 8 swatches.
That keeps total testing costs equivalent to standard plans while providing defensible credible intervals for individual layer compliance.
Evaluating multi-parameter Bayesian models requires monitoring MCMC chains to confirm statistical convergence. The Rubin-Gelman diagnostic R-hat compares variance between chains against variance within chains; values below 1.05 indicate that sampling has converged on the true posterior distribution, ensuring lot decisions rely on stable mathematical outputs.
- Likelihood Function Calibration parameterizes the dispersion kinetics governing plasticizer migration across polymer interfaces.
- Posterior Credible Intervals define statistical bounds enclosing 95 percent of probable plasticizer values for any given layer.
- Hyper-Parameter Variance Components isolate how much mixing errors versus drying tunnel thermal drift contribute to overall product variation.
- MCMC Convergence Verification tracks effective sample sizes and Monte Carlo standard error across parallel sampling chains.
Flame retardants interact with plasticizer systems, and increased variance widens consumer risk bounds. When process parameters drift, the hierarchical Bayesian framework adjusts acceptance criteria dynamically, calling for extra microtome cuts from targeted locations if posterior distributions edge close to regulatory limits.
Whether inline infrared dispersion sensors combined with machine-learning models can dynamically update Bayesian prior hyperparameters on continuous coating lines remains an active question in industrial metrology.

Remedy

Commercial Execution and Enforcement Dossiers
Enforcing quality standards across international supply chains depends on precise contract language and comprehensive testing dossiers. When buying thousands of meters of coated fabric, purchase orders need explicit acceptance sampling terms. Generic boilerplate ~ such as “material must comply with REACH restricted substance rules” ~ offers no legal protection if customs authorities impound a shipment based on surface-layer micro-extraction testing.
Defensible commercial agreements incorporate Bayesian decision thresholds directly into purchase order terms. Specifications should spell out the sampling hierarchy ~ including the exact number of rolls selected per lot, microtome preparation procedures, laboratory analytical methods, and the maximum allowable posterior probability of non-compliance. Contracts ought to specify that lot clearance requires Bayesian updates combining historical plant records with independent third-party lab testing.
Retesting without Bayesian updating introduces strong selection bias. Commercial disputes often flare up when initial testing flags non-compliance, leading mills to request additional testing. Under standard sampling rules, suppliers frequently test repeatedly until a swatch passes, then demand shipment release based on that lone outcome ~ a practice that undermines consumer protection and increases the likelihood of accepting non-compliant material.
Under a Bayesian acceptance framework, re-test data cannot wipe away prior results. New lab data simply acts as an additional likelihood update inside the existing model. If initial testing reveals plasticizer depletion in a tie coat, second-stage testing requires larger sample volumes to shift the posterior distribution back into compliance.
This mathematical integration prevents selective re-testing from compromising quality standards.
Customs detentions accumulate costs quickly. When border agents hold a shipment for chemical inspection, importers must present a complete compliance dossier within narrow statutory windows. That file requires a clear audit trail: raw compounder certificates of analysis, historical variance logs, microtome extraction reports from ISO 17025 accredited laboratories, and Bayesian posterior outputs demonstrating compliance across every structural layer.
Demurrage and storage fees pile up fast while material sits in quarantine. Presenting a Bayesian assurance file that demonstrates an empirical non-compliance probability below 0.01 percent gives importers the legal footing needed to secure shipment release or obtain conditional transfer into bonded processing. Maintaining verified compliance files protects importers from severe financial exposure while safeguarding downstream supply lines.