Cashmere Adulteration and the Test Methods That Survive a Dispute
Defending a cashmere claim demands LC-MS/MS proteomic proof tied to core samples that survive ISO 17025 cross-examination across two split lots.

Clip
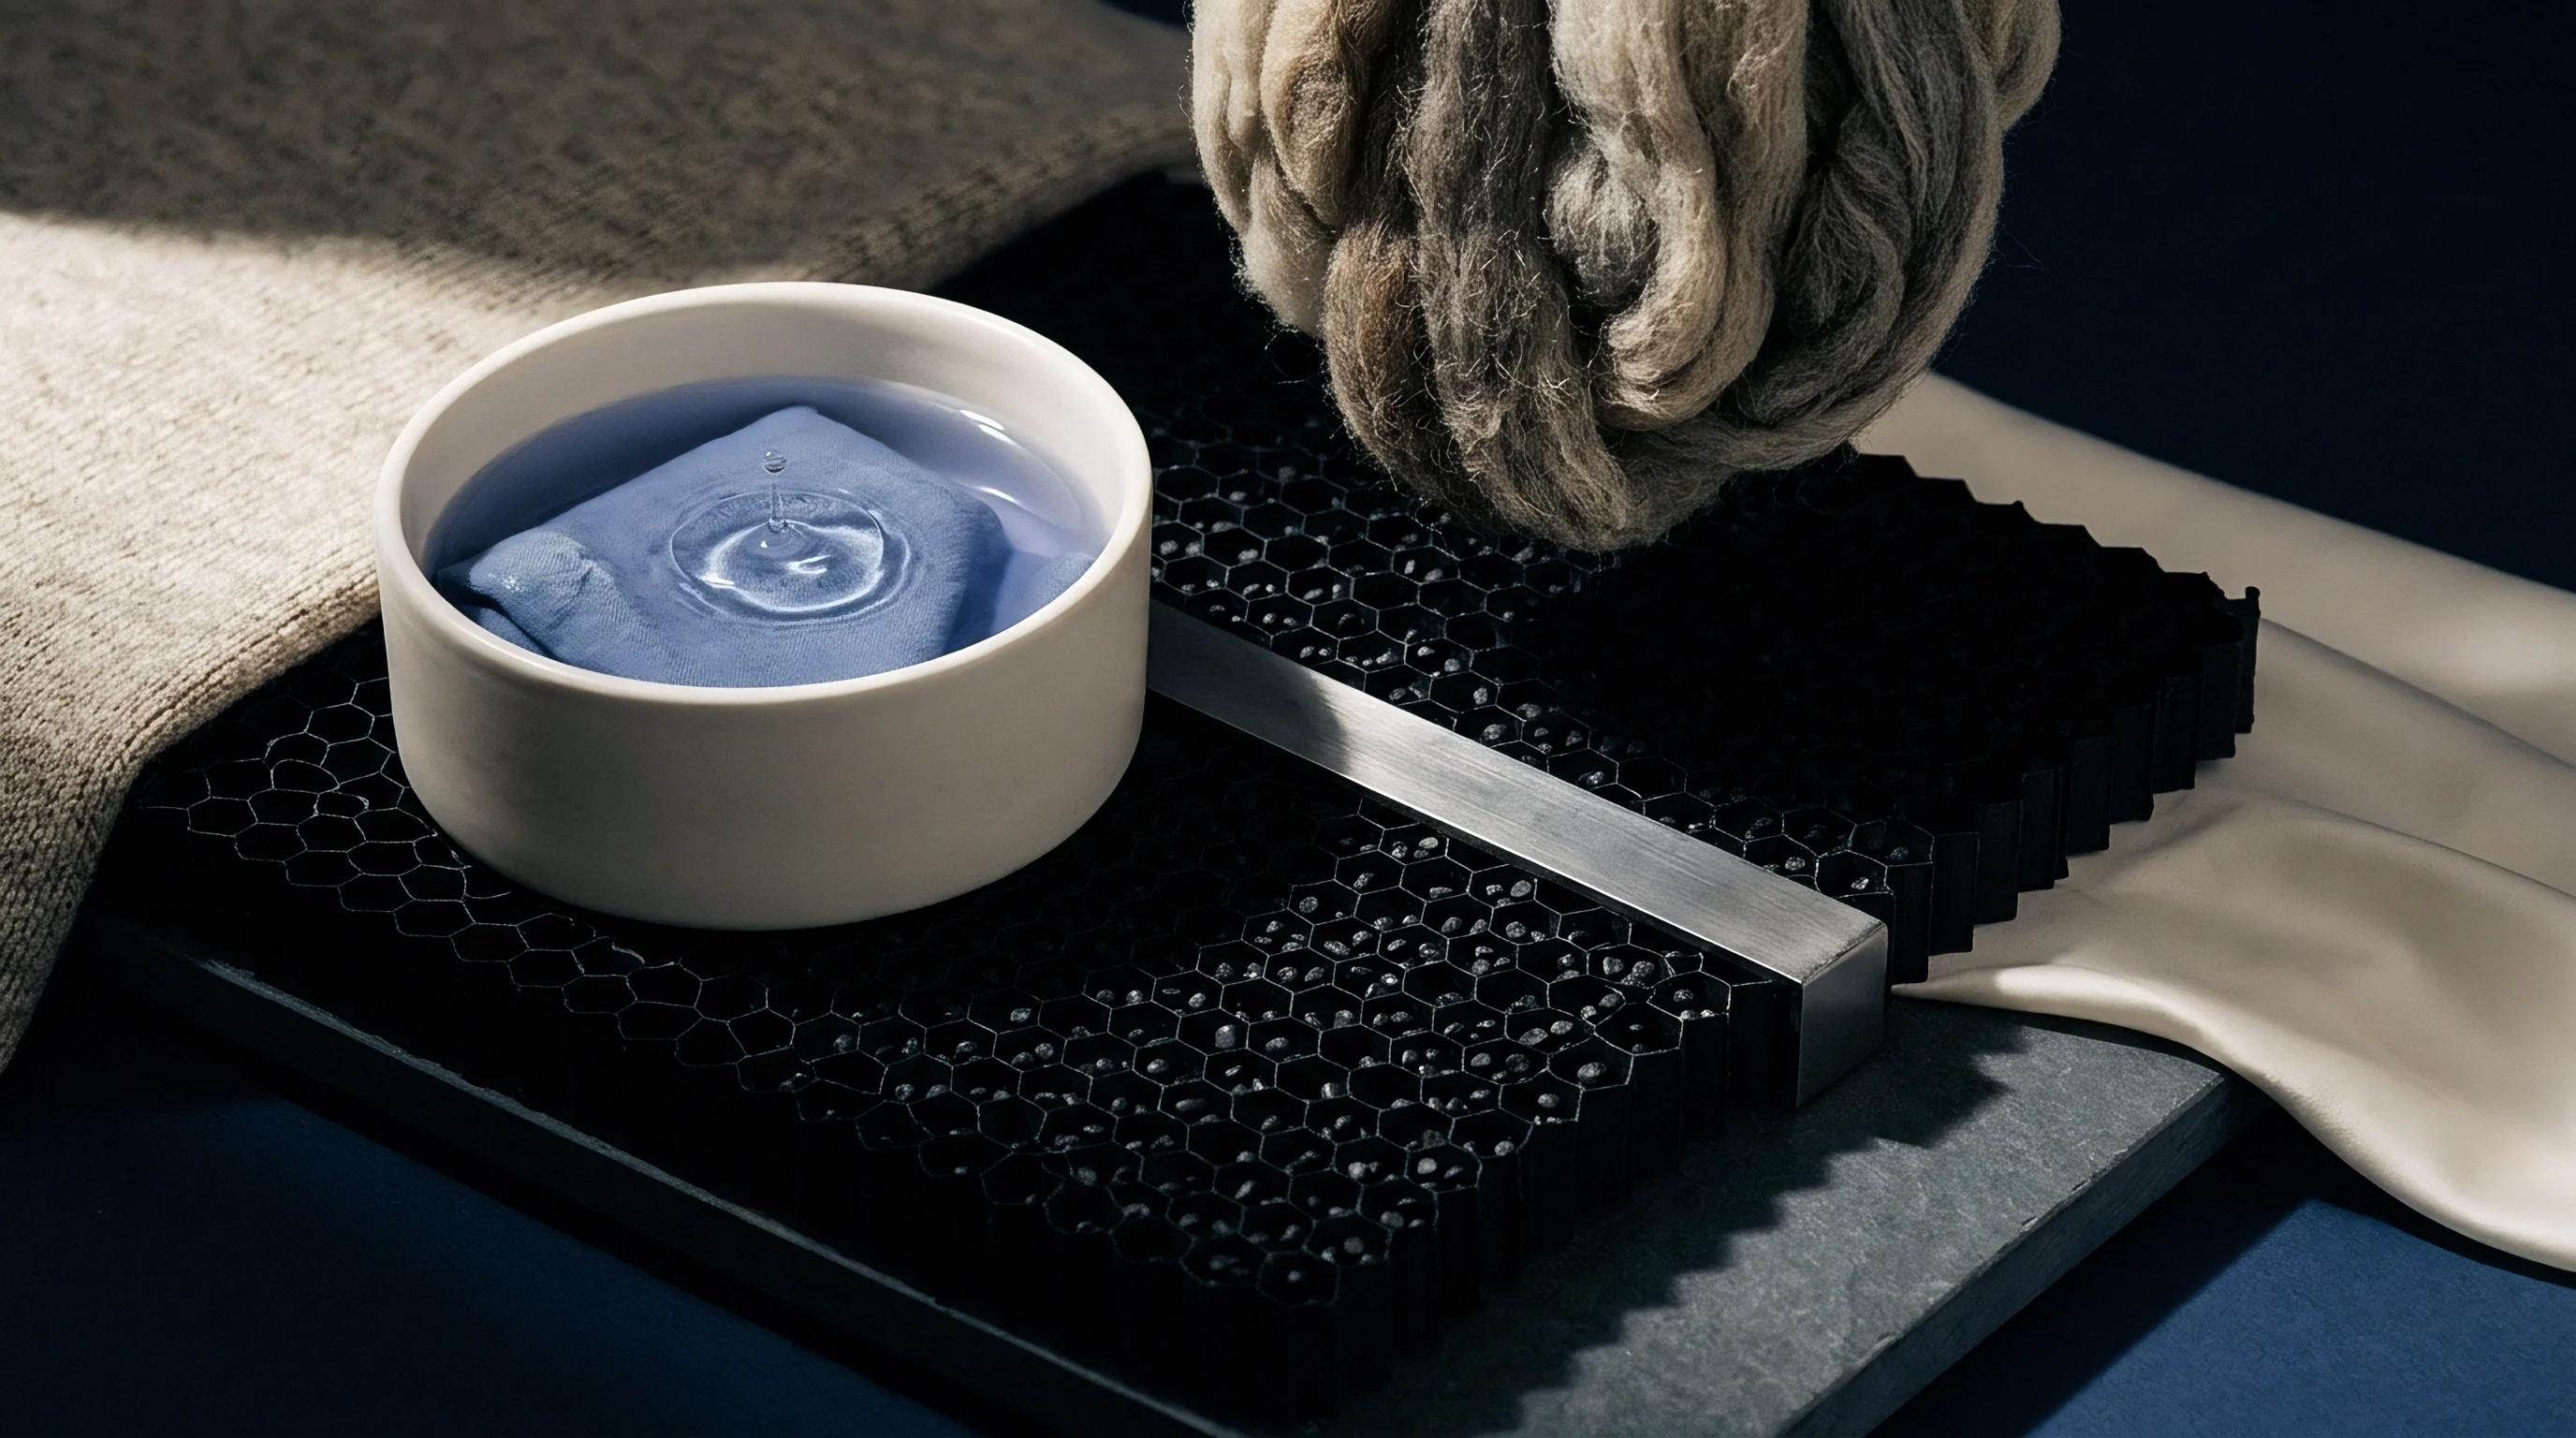
Raw cashmere down arrives in the supply chain as a dense mixture of coarse guard hair and fine undercoat, harvested from Capra hircus goats during spring molting. What a lot is worth depends on the mass ratio of these two fiber populations. Guard hair runs anywhere from 30 to 90 micrometers in diameter, while top-tier Mongolian and Chinese undercoat ranges between 13.5 and 17.5 micrometers.
Industrial dehairing strips out stiff guard hairs, vegetable debris, and dander using repeated carding and air-separation cylinders. Fine down yield ranges from 30 percent to 55 percent of scoured raw weight, driven by origin and harvest technique ~ combed fleeces deliver higher fine down recovery than sheared ones, which carry heavy loads of cut root ends and stubble. Adulteration usually happens at regional assembly markets before the fiber ever reaches dehairing mills.
Traders stretch scoured lots by blending in sub-16.5 micrometer Merino wool or coarse yak down measuring 17.5 to 19.0 micrometers before sending the material into processing machinery.
Catching composition fraud requires systematic sampling right when bales are opened. Hand-drawn tufts are practically useless for multi-bale shipments because adulterant fibers settle in localized zones within individual bales. The core sampling procedure defined in IWTO-19 is the only way to get a statistically sound specimen of a raw or dehaired lot.
A rotating, sharp-tipped core tube drives deep through the compressed bale, taking cross-sectional samples across the entire compression plane. On a standard twenty-bale lot, a technician takes at least twenty cores with an 18-millimeter or 25-millimeter tube, yielding a combined specimen mass of at least 200 grams. This combined core is mechanically blended and solvent-extracted to remove residual grease and dirt before division into test portions.
Fiber dimensions drive processing performance and commercial pricing alike. Because ultra-fine Merino wool shares a mean diameter with medium-grade cashmere, measuring diameter alone cannot prove composition. Diagnostic work looks instead at cuticular structure, cross-sectional shape, and crimp frequency.
Cashmere fibers have a round cross-section, long scale length, and low scale height; wool shows higher cuticle scale margins and pronounced crimp. Yak down matches cashmere in dimensions but comes with heavy dark pigmentation ~ bleaching it out requires harsh chemical processing that alters surface morphology.
| Fiber Type | Mean Diameter (µm) | Cuticle Scale Height (µm) | Scale Frequency (per 100 µm) | Cross-Sectional Shape | Commercial Value Index |
|---|---|---|---|---|---|
| Fine Cashmere (Alashan/Outer Mongolia) | 13.5 – 15.5 | 0.35 – 0.45 | 6.0 – 7.0 | Circular to oval | 100 |
| Medium Cashmere (Qinghai/Central Asia) | 15.6 – 17.0 | 0.38 – 0.48 | 6.2 – 7.2 | Circular | 75 |
| Ultra-Fine Merino Wool | 14.5 – 16.5 | 0.58 – 0.85 | 8.5 – 11.0 | Circular | 22 |
| Dehaired Yak Down | 17.5 – 19.5 | 0.40 – 0.52 | 6.5 – 7.8 | Circular to slightly flattened | 35 |
| Coarse Guard Hair (Goat) | 35.0 – 90.0 | 0.65 – 1.10 | 3.0 – 5.0 | Irregular with continuous medulla | 2 |
Sampling raw bales requires a precise sequence of steps to maintain testing integrity across commercial deliveries.
- Position the consignment bales on a level inspection deck and verify that lot numbers match shipping manifests.
- Select twenty percent of the total bale count, with a minimum floor of ten individual bales chosen at random across the container layout.
- Drive a pneumatic core sampler equipped with a 20-millimeter sharpened stainless steel tube through the compression face of each selected bale to a depth exceeding 500 millimeters.
- Combine extracted fiber cores into a sealed, airtight moisture-proof container to prevent changes in regain during transit to the testing laboratory.
- Homogenize the consolidated core lot in a laboratory carding blend box to achieve uniform distribution of fiber lengths and types.
- Extract three equal specimen masses of five grams each for solvent extraction, moisture testing, and microscopic composition analysis.
Undeclared wool in a dehaired lot messes with downstream spinning efficiency. Higher scale heights on fine sheep wool raise inter-fiber friction during drafting, producing yarn count variations and frequent end-breaks on ring frames. When high-twist worsted yarns start snapping continuously, mills usually trace the issue back to undisclosed wool blends in the raw lot.
The commercial damage extends past spinning into handfeel and pilling. Cashmere gets its soft drape from low flexural rigidity ~ a function of fine diameter and low cuticle scale height. Mixing in wool stiffens the yarn’s bending modulus, producing a harsher feel and encouraging pilling over the life of the garment.
Plotted as frequency histograms, fiber diameter distributions quickly expose adulteration patterns. Pure cashmere clips show a tight, unimodal Gaussian distribution centered on the mean diameter. Blends containing fine sheep wool or coarse goat hair display skewed or bimodal distributions, revealing secondary fiber populations even when the mean diameter falls within contract specs.
Sourcing practices must examine diameter standard deviations and coefficients of variation rather than relying exclusively on average micrometer values.
Elevated cuticle scale counts can result from unseasonal pasture conditions in the Alashan region altering goat hair follicle morphology during winter fleece development.


Microscopy
Optical analysis relies on structural differences in cuticular scale layers and diameter consistency along the hair shaft. Light microscopy under IWTO-58 and ISO 17751-1 was the standard approach for decades for identifying animal fibers. The technician mounts washed, cut fiber snippets in a medium of known refractive index, evaluating individual shafts at 400x to 500x magnification.
Cashmere cuticular scales show a smooth, distant scale pattern with faint, widely spaced scale margins. Wool scales have prominent, sharp edges with a higher spatial frequency along the fiber axis. The key metric is cuticle scale height ~ how far the scale margin stands proud of the main fiber shaft wall.
Scanning electron microscopy under ISO 17751-2 delivers three-dimensional surface imaging at magnifications exceeding 1,500x. High-resolution electron beam imaging reveals subtle cuticular features invisible under optical light instruments, measuring scale step height with nanometer precision. Cashmere scale heights measure consistently below 0.55 micrometers, typically hovering between 0.35 and 0.48 micrometers.
Standard sheep wool scales exceed 0.55 micrometers, ranging from 0.60 to 0.90 micrometers. That physical threshold forms the primary cutoff for microscopic species differentiation in commercial disputes.
Optical fiber analysis remains dependent on analyst calibration against reference standard hair collections.
Even with precise instruments, microscopic methods retain inherent limitations in commercial dispute scenarios. The primary weakness rests on subjective operator interpretation: technicians must visually categorize hundreds of individual fibers per sample, creating variance across operators and testing facilities. Finishing treatments can also alter fiber scale morphology to defeat optical identification.
Descaling processes, light chlorination, enzyme washes, and silicone softeners strip or level cuticle margins on fine sheep wool, driving scale heights below the 0.55 micrometer threshold. Mercerization strips outer cuticles entirely, leaving smooth, featureless fiber shafts that mimic cashmere under scanning electron examination.
Statistical confidence hinges directly on how many individual fiber shafts get evaluated. A sample of 300 fibers leaves a wide confidence interval, opening up significant error margins in borderline blend ratios. ISO 17751 mandates counting a minimum of 500 to 1,000 fibers to reach acceptable statistical confidence for quantitative composition claims.

Statistical Confidence Limits in Quantitative Fiber Analysis
The precision of fiber count results varies with sample size and the underlying blend proportion. Counting a small fiber population introduces sampling error that distorts the reported percentage of cashmere against sheep wool or yak down. The formula for the standard error of a proportion guides statistical boundaries in fiber counting:
SE = sqrt( (p (1 – p)) / N )
In this equation, p represents the true proportion of the target fiber in the sample, and N represents the total count of individual fibers examined under the microscope. At a 95 percent confidence level, the margin of error equals approximately 1.96 times the standard error.
When a laboratory analyzes 300 fibers from a yarn sample containing an actual composition of 90 percent cashmere and 10 percent sheep wool, the calculated margin of error equals approximately 3.4 percentage points. The laboratory report for this pure 90/10 blend can range anywhere between 86.6 percent and 93.4 percent cashmere. Increasing the count to 1,000 fibers reduces the margin of error to 1.86 percentage points, narrowing the reported range to between 88.1 percent and 91.9 percent.
In commercial contracts where a two percent deviation triggers severe financial penalties or shipment rejections, counting only 300 fibers creates unacceptable legal exposure for both buyers and suppliers.
Scale shape changes along a single fiber length from root to tip. Proximal sections near the skin display lower scale profiles than distal sections near the tip. Alpine weathering degrades outer cuticle scale margins, flattening scale margins on raw cashmere harvested late in the season.
On the flip side, fine sheep wool fibers extracted from protected body regions of specialized Merino sheep display abnormally low scale heights that overlap with degraded cashmere profiles. Microscopy alone struggles to deliver definitive quantitative conclusions when evaluating blends containing ultra-fine wool treated with cuticle-smoothing polyesters or siloxanes.
Yak down makes visual identification even more complex. Scale heights on yak fibers run between 0.40 and 0.52 micrometers, matching cashmere dimensions. Scale frequencies also overlap, running between 6.5 and 7.8 scales per 100 micrometers of fiber length.
While pigmented yak fibers stand out under light microscopy due to heavy melanin granules dispersed throughout the cortex, dehaired and bleached yak down removes this visual marker. Bleached yak down presents a clear, smooth fiber shaft virtually indistinguishable from cashmere under both optical and electron beam inspection. Testing laboratories relying exclusively on microscopic methods regularly misidentify bleached yak down as cashmere, leading to erroneous composition reports that fail to survive secondary forensic validation.
When scale heights on a processed sample read precisely at the threshold between species, the chemical treatment history of the yarn clarifies whether the cuticle was artificially shaved or naturally smooth.
Chemistry
Mass spectrometry resolves species identity by analysing distinct amino acid sequences in keratin proteins extracted from the fiber matrix. Liquid chromatography coupled with tandem mass spectrometry (LC-MS/MS) and Matrix-Assisted Laser Desorption/Ionization Time-of-Flight Mass Spectrometry (MALDI-TOF MS) represent the current state of forensic fiber testing under ISO 20418-1 and ISO 20418-2. These analytical methods look past surface physical morphology, targeting internal chemical composition.
Keratins and keratin-associated proteins (KRTAPs) contain species-specific amino acid substitutions that survive mechanical processing and superficial surface modifications.
Getting usable peptide fragments out of insoluble hair requires chemical reduction and enzymatic digestion. The laboratory homogenizes the fiber sample into a fine powder, applying dithiothreitol or 2-mercaptoethanol to cleave disulfide bonds cross-linking the keratin polypeptide chains. Subsequent alkylation with iodoacetamide stabilizes free cysteine residues, preventing re-oxidation.
Trypsin enzyme breaks down the denatured keratin proteins at specific cleavage sites, yielding a complex mixture of tryptic peptides. These peptides pass through a reverse-phase liquid chromatography column, separating components by hydrophobic interaction before injection into the mass spectrometer ionization chamber.
Liquid chromatography mass spectrometry resolves species origin down to one percent total weight in blends subjected to high temperature piece dyeing.
Mass spectrometers identify species-specific peptide biomarkers by measuring exact mass-to-charge ratios (m/z) and fragment patterns from collision-induced dissociation. Specific tryptic peptides derived from intermediate filament proteins KRT31, KRT33a, and KRT85 serve as diagnostic markers for Capra hircus (goat/cashmere), Ovis aries (sheep wool), and Bos grunniens (yak). Peak intensity ratios corresponding to these diagnostic biomarkers allow precise quantification of fiber blend percentages down to a detection limit of 1.0 percent by weight, operating independent of fiber surface descaling or soft finish application.

Does Peptide Biomarker Mass Spectrometry Overcome Thermal Fiber Damage?
High-temperature processing, aggressive acid carbonization, and chlorine-based decolorization degrade protein structures within animal fibers. Severe chemical processing fragments polypeptide chains non-specifically, reducing the yield of intact target peptides during subsequent trypsin cleavage. When heating cashmeres or wools above 130 degrees Celsius during high-pressure piece dyeing, heat-induced cross-linking occurs, forming lysinoalanine and lanthionine bridges.
These non-native amino acid linkages impede enzymatic digestion, lowering the absolute signal intensity of diagnostic biomarker peaks during liquid chromatography separation.
Proteomic methodologies overcome processing damage by analyzing multiple marker peptides across different keratin classes. Rather than relying on a single peptide candidate susceptible to thermal degradation, ISO 20418-2 monitors a panel of tryptic peptides spanning intermediate filament proteins and matrix proteins. Software algorithms compute blend ratios by normalizing signal intensities across conserved background peptides present in all mammalian keratins, compensating for overall digest efficiency losses.
Even when chemical bleaching destroys 80 percent of native protein structures, residual intact keratin regions retain sufficient biomarker sequence integrity to confirm or refute species claims.
Protein extraction efficiency differs between raw stock and finished goods. Raw cashmere down extracts readily under standard urea and dithiothreitol buffer systems. High-twist worsted yarns or resin-finished fabrics require extended denaturation times and higher surfactant concentrations to achieve complete protein solubilization.
Incomplete protein extraction skews quantitative results if one fiber type in a blend dissolves more readily than another. Sheep wool keratins display slightly higher solubility than cashmere keratins under mild extraction conditions, potentially overrepresenting wool content if digestion procedures deviate from standardized incubation times.
Proteomic mass spectrometry remains expensive and demands specialized equipment operated by skilled analytical chemists. The calibration of mass spectrometers requires authentic, certified reference material collections of pure goat down, sheep wool varieties, and yak fibers. Commercial laboratories lacking proper reference standards risk misinterpreting close peptide mass overlaps between wild caprine species and domestic goat strains.
Standardizing biomarker ion selection and calibration curves across international testing facilities remains an active focus for international standardization bodies working to eliminate inter-laboratory testing discrepancies.
The buyer absorbed the full re-testing bill after an initial chemical screen failed to distinguish ultra-fine mercerized wool from raw goat down in a high-twist worsted yarn.
Genomics
Deoxyribonucleic acid isolation from animal hair follicles provides an absolute species identifier when structural and protein markers sustain damage during textile finishing. Real-time quantitative Polymerase Chain Reaction (qPCR) and Next-Generation Sequencing (NGS) target specific genomic sequences unique to the nuclear or mitochondrial genomes of Capra hircus, Ovis aries, and Bos grunniens. Mitochondrial DNA targets, specifically within the cytochrome b (cyt b) gene and the hypervariable D-loop region, offer high sensitivity due to their elevated copy numbers per cell compared to single-copy nuclear genes.
Standardized testing frameworks outlined in ISO 22864 govern sample extraction, primer design, and amplification protocols for textile identification.
Extracting amplification-grade genomic material from commercial textiles poses severe technical challenges. Fully processed cashmere down consists almost entirely of dead keratinized hair shafts, which lack nucleated cells found in root bulbs. The cellular material present consists of trace amounts of degraded mitochondrial genomic fragments trapped within the cortical cell matrix.
Extraction protocols utilize specialized lysis buffers containing proteinase K and high concentrations of chaotropic salts to break down the dense keratin structure and liberate micro-ng quantities of highly fragmented template DNA.
Contract clauses specifying DNA testing as the sole arbiter of fiber purity invalidate claims on dark-dyed finished garments where nuclear material has undergone thermal degradation.
Thermal and chemical treatments applied throughout textile manufacturing systematically destroy nucleic acid polymer chains. Scouring, hydrogen peroxide bleaching, sulfuric acid carbonization, and reactive dyeing at 98 degrees Celsius break phosphodiester backbones, reducing DNA strand lengths to fragments below 50 base pairs. Standard PCR primers requiring template lengths of 100 to 200 base pairs fail to bind intact template targets in heavily dyed or bleached finished goods.
This degradation causes amplification failure, leading to false-negative results where genuine fibers yield no detectable genetic signal.
| Analytical Method | Primary Standard | Target Biomarker / Feature | Detection Limit | Primary Failure Mode | Suitability for Dyed/Finished Goods |
|---|---|---|---|---|---|
| Optical Light Microscopy (LM) | IWTO-58 / ISO 17751-1 | Cuticle scale morphology, fiber diameter | 3.0% – 5.0% | Operator visual fatigue, chemical descaling bias | Moderate (distorted by dark dyes) |
| Scanning Electron Microscopy (SEM) | ISO 17751-2 | Cuticle scale height (threshold 0.55 µm) | 2.0% – 3.0% | Enzyme/chlorination surface levelling | High (unaffected by dye color) |
| LC-MS/MS Proteomics | ISO 20418-2 | Keratin tryptic peptide mass fractions | 1.0% | Extreme thermal protein cross-linking | Very High (survives chemical treatments) |
| Real-time qPCR Genomics | ISO 22864 | Mitochondrial cyt b gene fragments | 0.1% | Severe DNA fragmentation (<50 bp) | Low to Moderate (fails on dark dyes) |
High-throughput Next-Generation Sequencing handles heavy fragmentation by enabling ultra-short fragment library construction and deep sequencing coverage. Short-read sequencing platforms target fragment sizes as small as 30 to 40 base pairs, matching amplicon fragments recovered from heavily processed finished garments. Sequencing read counts assigned to species-specific reference genomes provide qualitative identification and quantitative estimations of species proportions in mixed fiber lots.
Environmental cross-contamination introduces substantial risk in high-sensitivity genetic testing. Trace amounts of extraneous sheep or goat dander present in spinning mill air ducts, shearing sheds, or transit containers transfer onto fiber lots during processing. Because real-time PCR amplifies single template molecules through thirty to forty replication cycles, trace dust contamination yields positive amplification signals, falsely flagging pure cashmere shipments as adulterated.
Laboratories must maintain strict physical segregation between extraction suites, pre-PCR preparation rooms, and post-amplification analysis areas, running rigorous negative control samples alongside commercial test specimens.
The open question remains whether low-input single-cell sequencing protocols can extract usable genomic markers from heavily carbonized post-consumer recycled cashmeres without false-positive cross-contamination.

Dispute
Commercial conflicts over fiber composition standardly erupt when a receiving country’s port customs lab reports non-cashmere fibers in a consignment certified pure at origin. Resolving these impasses requires a systematic audit of testing methodology, laboratory accreditation scopes, and physical sample handling histories. Simple reliance on a single laboratory test report is insufficient to defend or prosecute a commercial claim.
The dispute process turns on establishing which analytical method yields legally defensible evidence under international arbitration standards like the International Wool Textile Organisation Blue Book guidelines.
Laboratory competence rests on formal accreditation under ISO/IEC 17025, which governs testing and calibration laboratory operations. However, general ISO 17025 accreditation is insufficient on its own; the laboratory’s formal scope of accreditation must explicitly list the specific testing standards used for the evaluation, such as ISO 17751-2 for SEM or ISO 20418-2 for LC-MS/MS. Participating in regular inter-laboratory comparison trials, known as round-robin testing, provides verification of a facility’s quantitative accuracy.
Laboratories demonstrating low z-scores in annual international round-robin proficiency trials establish evidence of technical capability that carries weight in judicial proceedings and trade arbitration panels.
The buyer rejected 4,200 kilograms of dehaired hosiery yarn after mass spectrometry confirmed five percent sheep keratin in the blend. Managing retain samples using a tripartite protocol protects both buyer and seller against post-shipment sample tampering or degradation.
Legal claims against suppliers fail when lab reports lack rigorous structural and methodological documentation.
- Unaccredited Method Scope happens when testing houses issue composition reports using modified internal methods that lack explicit inclusion under their formal ISO 17025 accreditation parameters.
- Insufficient Sample Population occurs when microscopic evaluation reports rest on counting fewer than 500 individual fibers, violating statistical confidence boundaries mandated by ISO 17751.
- Omission of Measurement Uncertainty occurs when laboratory certificates present composition figures as flat absolute integers without stating expanded confidence intervals or standard deviations.
- Absence of Chain-of-Custody Protocols emerges when submitted test swatches lack documented, tamper-evident seals linking the physical specimen directly to the disputed commercial consignment lot.
- Failure to Account for Process Alterations arises when laboratories misinterpret descaled fine wool as pure cashmere because they failed to perform confirmatory LC-MS/MS proteomic validation on chemically finished yarns.
Inter-laboratory variance naturally exists across testing methodologies. A relative variance of plus or minus two to three percent is common between two accredited laboratories using microscopic optical methods on identical fiber lots. Standard commercial purchase contracts must account for this tolerance by establishing acceptable compositional ranges rather than absolute single-digit specifications.
When origin certificates state 100 percent cashmere but arrival testing indicates 97.5 percent goat down and 2.5 percent fine sheep wool, arbitration boards evaluate whether the difference represents genuine deliberate adulteration or falls within the standard statistical uncertainty of ISO-approved test protocols.
Cross-examination of testing evidence in commercial arbitration focuses on method selection hierarchy. Optical light microscopy evidence yields to scanning electron microscopy when scale height measurements are contested. Furthermore, scanning electron microscopy observations are subordinated to LC-MS/MS proteomic mass spectrometry when chemical cuticle modifications, such as enzyme stripping or chlorination, are suspected of altering fiber surfaces.
Demonstrating that an opposing laboratory relied exclusively on optical methods to evaluate a chemically finished worsted yarn routinely invalidates their test findings in arbitration hearings.
Section 14 of the standard yarn purchase agreement replaces individual laboratory certificates with a mandatory dual-testing protocol using the arithmetic mean of two ISO 17025 accredited facilities whenever fiber blend declarations fall within two percent of tariff threshold boundaries.

Ledger
Customs tariff classifications enforce severe financial consequences on fiber misdeclarations across international borders. Fine animal hair and wool enter global commerce under Chapter 51 of the Harmonized Commodity Description and Coding System. Uncarded and uncombed dehaired cashmere down falls under HS code 5102.11, while combed cashmere top enters under HS 5105.31.
Spun cashmere yarns clear under HS 5106.10 or 5107.10 depending on carded or worsted construction, and finished knitted garments pass under HS 6110.12. Tariff rates vary substantially across these headings, with pure cashmere products often enjoying preferential trade agreement duty rates, whereas blended or wool-dominant textiles incur higher import duty tariffs.
Customs authorities in major import markets execute regulatory compliance checks using proteomic and microscopic methods to detect tariff classification fraud. Under regulatory regimes such as United States Code Title 19 (19 U.S.C. 1592) or European Union Customs Code regulations, importing a garment declared as 100 percent cashmere that contains undeclared sheep wool constitutes misdeclaration. Legal liabilities include shipment seizure, retroactive duty re-assessments at higher rate schedules, structural civil penalties reaching up to four times the domestic value of the merchandise, and formal import license suspensions.
Reclassification shifts financial projections on bulk garment orders. Consider an import shipment of 10,000 unit knitted cashmere sweaters with a declared invoice value of 80 US dollars per unit, totaling 800,000 dollars. Pure cashmere sweaters enter the destination market under HS 6110.12 at a preferential import tariff rate of 16 percent, yielding an expected duty bill of 128,000 dollars.
If customs authorities extract samples and detect 6 percent undeclared Merino wool via LC-MS/MS mass spectrometry, the entry gets reclassified under a wool-blend heading carrying an elevated duty rate of 24 percent plus flat specific duties per kilogram.
| Declared Composition | Actual Lab Composition | HS Tariff Line Shift | Duty Rate Differential | Penalty Structure / Legal Risk | Landed Cost Impact per Unit |
|---|---|---|---|---|---|
| 100% Cashmere Yarn | 100% Cashmere | 5107.10 (No Shift) | 0% (Base Rate) | Zero exposure; full compliance | $0.00 (Baseline) |
| 100% Cashmere Sweater | 95% Cashmere / 5% Wool | 6110.12 to 6110.11 | +8.0% Ad Valorem | Duty re-assessment + 2x duty civil fine | +$12.80 per unit |
| 85/15 Cashmere/Silk Yarn | 75/15/10 Cashmere/Silk/Yak | 5107.10 to 5107.20 | +4.5% Ad Valorem | Administrative re-classification penalty | +$4.15 per kg |
| 100% Cashmere Sweater | 88% Cashmere / 12% Wool | 6110.12 to 6110.11 | +8.0% + Specific Duty | Seizure, 19 U.S.C. 1592 fraud investigation | +$28.50 per unit (incl. fines) |
Commercial procurement contracts must incorporate clear technical specifications to protect purchasing entities from composition claims and regulatory liabilities.
- Mandatory Sampling Method specifies that core sampling per IWTO-19 must occur at the seller’s facility prior to container loading, supervised by an independent accredited surveyor.
- Primary Test Method Hierarchy establishes that LC-MS/MS proteomic profiling per ISO 20418-2 serves as the final technical arbiter for species purity disputes, superseding visual optical microscopy.
- Acceptable Blend Tolerance sets absolute allowable limits for accidental wool contamination, capping non-goat animal fiber presence at a maximum threshold of 1.0 percent by weight.
- Laboratory Accreditation Mandate requires that all composition testing certificates originate exclusively from facilities holding active ISO/IEC 17025 accreditation explicitly covering ISO 17751-2 and ISO 20418-2.
- Financial Indemnification Clause states that suppliers absorb all custom fines, retroactive duty adjustments, demurrage costs, and legal fees resulting from composition misdeclarations verified by independent audit.
- Retain Sample Custody Protocol mandates the creation of three identical sealed cores, establishing an untouched arbitration sample maintained under neutral third-party control for twelve months post-delivery.
Calculating landed costs requires building composition risk allowances directly into the unit economic model. Sourcing raw yarn without rigorous composition verification exposes the buyer to unexpected margin loss when shipments face commercial rejection or customs re-classification. A five percent undeclared wool content discovery instantly converts a profitable sweater program into a net commercial loss once re-labeling labor, warehouse hold charges, testing fees, and import duty adjustments filter through the ledger.
The landed cost calculation absorbs the penalty tariff rate, the re-labeling labor in the distribution warehouse, and the six-week delay in delivery to retail floors. Freight forwarding documents must reflect the adjusted composition before clearance paperwork reaches the port authority.