Cotton Fiber Length Distribution Metrics and Carded Yarn Quality
AFIS short fiber content by weight in raw cotton must remain below 8.5 percent to prevent severe mass variance and tenacity drop in carded yarn spinning.


Distribution
A cotton bale’s length distribution sets the limits on carded yarn strength, nep formation, and spinning performance well before the fiber ever reaches the blowroom. Carded processing skips combing entirely, so short fiber in the raw bale passes directly into the sliver and finished yarn. Buyers looking for carded ring-spun or open-end yarns often rely strictly on quoted staple length or HVI upper half mean length, but judging cotton on a single point measurement carries real commercial and technical risks.
Two lots with the exact same 1.12-inch upper half mean length can have drastically different length spreads, leading to major variations in yarn strength, mass evenness, and surface hairiness.
Raw cotton is inherently variable. Lengths within a single bale range anywhere from short fragments under 4 millimeters up to fully developed fibers over 38 millimeters. Capturing that distribution takes multi-parameter metrics capable of isolating the sub-12.7 millimeter short fiber fraction from the main long-fiber population.
High Volume Instrument systems scan a clamped fiber beard optically to yield two key numbers: Upper Half Mean Length (the weight-average length of the longer 50 percent of fibers) and Uniformity Index (the ratio of Mean Length to Upper Half Mean Length multiplied by 100). HVI parameters give quick numbers for commercial grading, but they tend to hide critical skewness down in the short-fiber tail.
Bale Array Mechanics
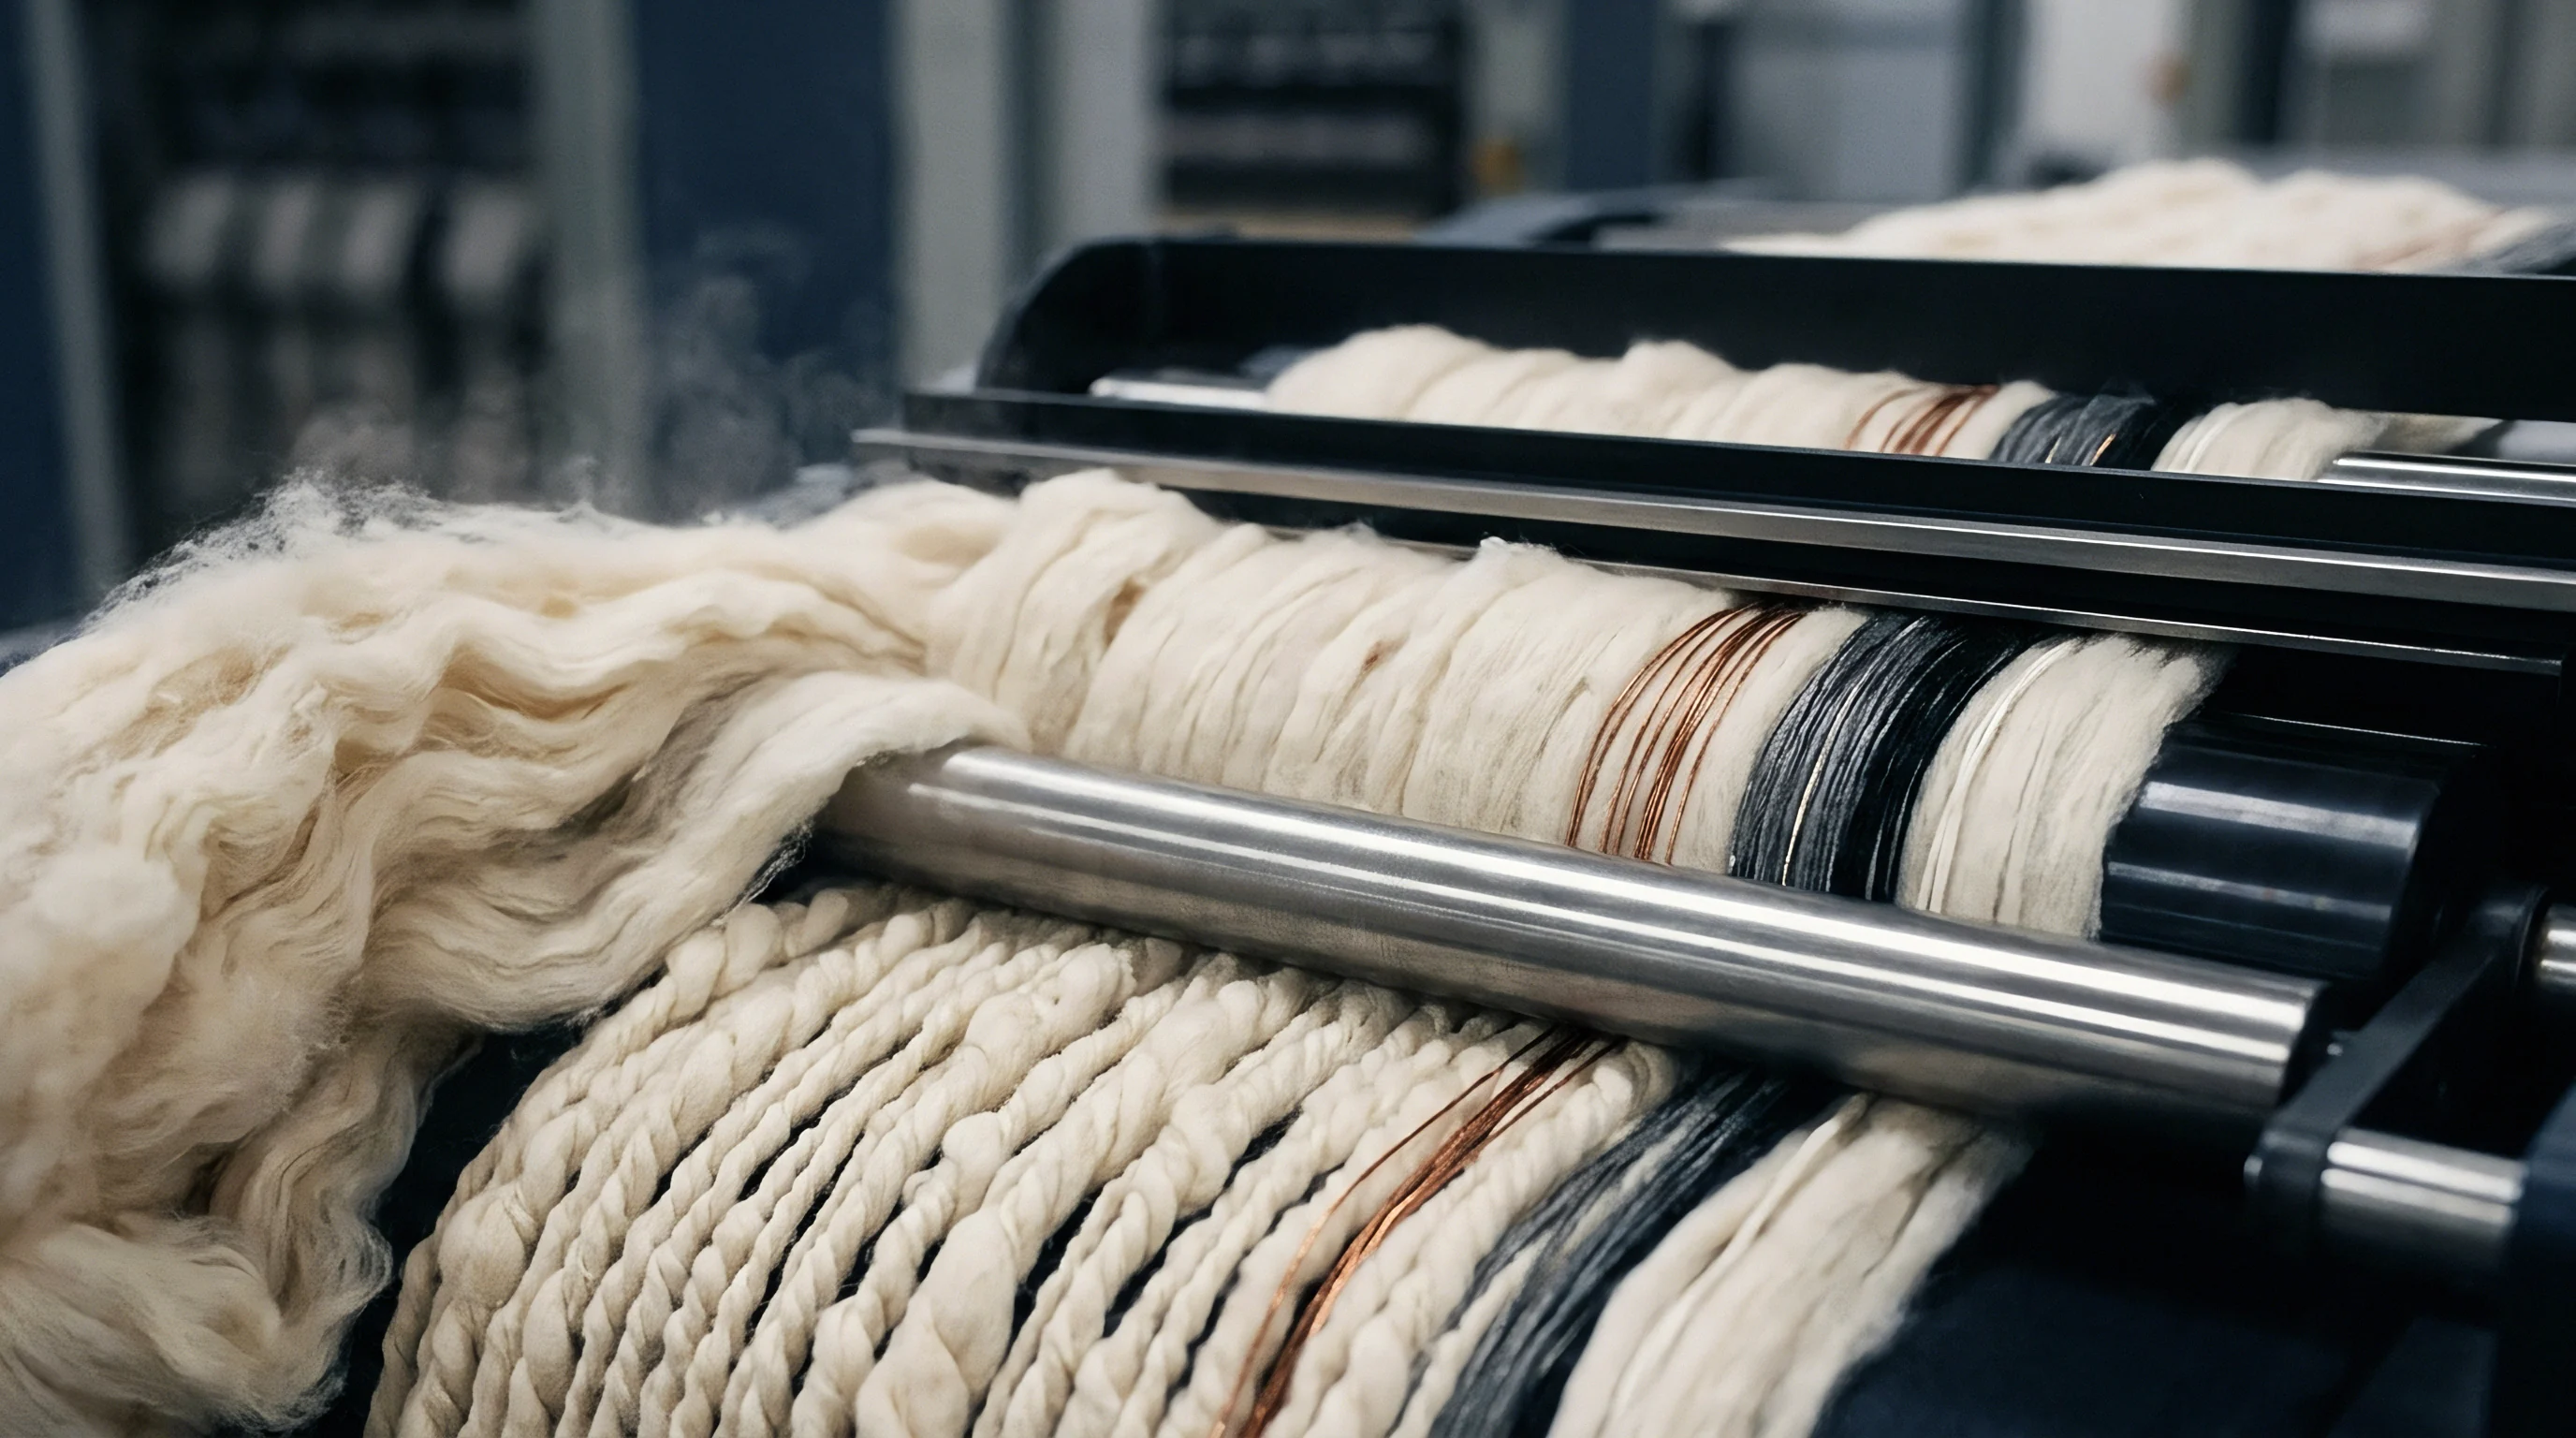
Raw lint entering the mill contains individual fibers anywhere from under 3 millimeters to over 38 millimeters long. The overall profile of this population dictates how fibers behave through card drafting and roving attenuation. In carded spinning, fibers shorter than 12.7 millimeters cannot reach across the gap between drafting roller nips; floating uncontrolled in the draft zone, they either gather into thick clusters or drop out as fly waste.
That leaves the yarn with high mass variance, poor tensile strength, and frequent imperfections. Advanced testing methods isolate these specific fractions so mills can anticipate performance before committing bales to the laydown.
Mapping an entire length distribution once meant manual comb sorting with tools like the Suter-Webb array. Technicians would pull, align, and group fibers into 1/16-inch increments, weighing each group on analytical balances to build cumulative length-weight curves. Modern high-throughput labs rely on single-fiber electro-optical testing using the Advanced Fiber Information System.
AFIS aerodynamically separates thousands of individual fibers from a sliver sample and passes them through an optical sensor to measure each strand individually. This gives two separate profiles: length by number, L(n), and length by weight, L(w).
Cotton lots exhibiting an AFIS short fiber content by weight above 9.5 percent generate card room fly waste exceeding 2.2 percent during high-speed carding.
High Volume Instrument Span Metrics
Scanning a clamped fiber beard photoelectrically gives statistical averages based on optical mass. High Volume Instrument lines measure two specific locations on the beard’s attenuation curve: the 100 percent density point right at the clamp and the 2.5 percent or 50 percent span length points further along the beard. Historically, the 2.5 percent span length reflected the distance spanned by the longest 2.5 percent of fibers, aligning closely with manual hand-classing staples.
Current HVI lines output Upper Half Mean Length together with Uniformity Index, linked through a simple relationship:
Uniformity Index = (Mean Length / Upper Half Mean Length) 100
A Uniformity Index below 80 percent points to a heavy proportion of short fibers relative to the upper quartile length. That imbalance hurts fiber control during drafting. HVI software estimates a Short Fiber Index using empirical regression models, but these optical calculations often understate the short fiber content in cotton that has been aggressively ginned or over-dried.
Direct, single-fiber measurement is still essential when evaluating raw stock for fine-count carded yarns.

Advanced Fiber Information System Discrete Length Metrics
Single-fiber optical testing evaluates upward of twenty thousand individual strands per sample to build accurate population counts. The Advanced Fiber Information System records the optical length and cross-sectional area of each fiber as it travels through an infrared beam at speeds over 6 meters per second. Analyzing particles individually provides detailed metrics that bundle-scanning instruments cannot supply, including Upper Quartile Length by weight, Mean Length by weight and number, and Short Fiber Content by weight and number.
Short fiber content measures the proportion of fibers under 12.7 millimeters (0.5 inches) in the sample.
The numerical average length, L(n), runs well below the weight-average length, L(w), because short fibers add up quickly in count while contributing very little to overall mass. A raw cotton sample with an L(w) of 24.5 millimeters might show an L(n) of just 18.2 millimeters. This gap between weight and count highlights how heavily skewed a distribution really is ~ something seen regularly when testing low-grade Upland cottons put through multi-stage saw ginning.
| Test Parameter | Measuring Principle | Standard Test Method | Primary Output Metric | Commercial Operating Tolerance |
|---|---|---|---|---|
| Upper Half Mean Length (UHML) | Optical beard attenuation mass profile | ASTM D5867 / ISO 139 | Inches / Millimeters | +/- 0.02 inches |
| Uniformity Index (UI) | Ratio of Mean Length to UHML | ASTM D5867 / ISO 139 | Percentage (%) | +/- 1.0 % absolute |
| Short Fiber Index (SFI) | High Volume Instrument optical calculation | ASTM D5867 | Index Value | +/- 0.8 index points |
| Upper Quartile Length by Weight | Discrete individual fiber optical length | ASTM D5340 / ISO 2060 | Inches / Millimeters | +/- 0.4 mm |
| Short Fiber Content by Weight | Discrete fiber mass below 12.7 mm | ASTM D5340 / ISO 2060 | Percentage by weight (%) | +/- 0.5 % absolute |
| Short Fiber Content by Number | Discrete fiber count below 12.7 mm | ASTM D5340 / ISO 2060 | Percentage by count (%) | +/- 1.2 % absolute |
Reading these metrics requires keeping weight distributions distinct from numerical ones. Because short fibers weigh less individually, a sample where 25 percent of the fibers by count are short might show a weight-based Short Fiber Content of only 9 percent. In carded spinning, individual fiber ends drive surface hairiness and friction, making numerical distributions reliable predictors of yarn surface characteristics.
Weight distributions, meanwhile, determine mass evenness and the force needed during drafting. Whether high-speed optical array analyzers can deliver enough resolution to replace manual Suter-Webb comb sorting in contract arbitrations remains an open question.


Clamp
Comb sorters and automated jaws separate staple samples into discrete length classes using controlled holding pressure. Across both laboratory testing and mill preparation, clamping mechanics dictate how fibers get gripped, aligned, and drawn. Lab sorters use metal needles and padded clamps to hold tufts so technicians can pull length groups without slipping or breaking fibers.
On spinning frames, rubber top rolls press against fluted steel bottom rolls to grip slivers and rovings in the draft zones. The gap between consecutive nip lines ~ the gauge setting ~ must match the cotton’s fiber length profile.
Clamping a fiber bundle subjects individual strands to concentrated shear and compression. If holding pressure is too light, long fibers slip early during comb extraction, artificially shortening the measured distribution. If pressure is too heavy, the pull tears fibers at the grip line, inflating the Short Fiber Content count.
The Suter-Webb method avoids breakage by using dual comb beds with fine steel needles spaced at 1/16-inch intervals to support the sample while padded forceps pull the exposed tips.

Suter Webb Comb Extraction Sequence
Manual sorting relies on paired wire beds to separate fibers in order of length. The analyst prepares a 75-milligram raw cotton sample, opening tufts by hand to remove trash without damaging fibers. The sample goes into the left comb bank, where top combs drop down to hold the main mass.
Forceps grip the fibers projecting nearest the comb edge, pulling small sub-samples horizontally before transferring them to the right comb bank, aligned evenly along a common baseline.
Repeating this process builds an array laid out from longest to shortest across a velvet mounting board. Lowering the comb bank in 1/16-inch steps, the analyst gathers and weighs each fraction on a microbalance sensitive to 0.01 milligrams. Adding these fractional weights yields the cumulative length-weight curve.
This manual method remains the primary reference standard for calibrating automated platforms like AFIS and HVI.

Nip Mechanics in Roller Attenuation
Drafting rollers grip sliver and roving cross-sections to reduce linear mass density, using pairs of rolls running at progressively higher surface speeds. The contact line between a top press roll and a fluted bottom roll forms the nip line, acting as a continuous clamp. The distance between front and back nip lines defines the gauge setting.
If this setting is narrower than the longest fibers in the mix, fibers break ~ a single strand caught in the back nip gets pulled aggressively by the faster front nip.
Opening the gauge setting too wide leaves an unguided floating zone where short fibers, unsupported by either nip, drift under the drag of longer adjacent fibers. That irregular movement creates drafting waves ~ repeating thickness variations along the sliver that show up as elevated mass CVm in the yarn. Setting nip clearance correctly requires knowing the length distribution (specifically the Upper Quartile Length or 2.5 percent span length) so nips can be set 2 to 4 millimeters wider than the longest major fiber group.
Contracts referencing USDA cotton classification rules enforce a 0.02-inch tolerance on Upper Half Mean Length before price adjustments apply.
Manual sorting highlights how mass distributes across length classes, where holding pressure directly influences test precision. The standardized double-comb extraction follows a set four-step sequence:
- Specimen Preparation ~ Open raw cotton tufts by hand into a 75-milligram aligned slab, taking out leaf fragments and seed coat neps without pulling abruptly on the fibers.
- Primary Transfer ~ Place the opened bundle into the primary comb bed, drop the top comb needles to secure the body lint, and extract exposed tips with padded flat-jaw forceps.
- Array Assembly ~ Lay pulled fiber groups onto a velvet board, aligning their bases along a zero-datum line starting from the left.
- Fractional Weighing ~ Lower the comb beds in 1/16-inch steps, pull each length group, and weigh it on an analytical microbalance to four decimal places.
When cotton lots fail length specifications, elevated short fiber counts can stem from aggressive pneumatic clamping in AFIS analyzers or actual fiber damage. Manual Suter-Webb array extractions resolve the ambiguity by directly measuring physical fiber lengths.

Sliver
Carding converts loose bale lint into a continuous sliver weighing 3.5 to 5.5 grams per meter. It is the core mechanical stage in a carded mill: blowroom tufts are opened to single fibers, trash and dust drop out, neps are untangled or removed, and fibers align along the strand axis. But carding works both ways on length distribution.
While flat strip waste removes fine dust and ultra-short fibers, heavy shearing between cylinder and flat wire inevitably snaps some sound long fibers.
Comparing fiber length metrics before and after carding shows how aggressively the line is treating the stock. On a properly calibrated card, weight-based Short Fiber Content in the sliver shouldn’t exceed the raw bale mix by more than 1.0 to 1.5 percentage points. Misconfigurations ~ like excessive cylinder speeds paired with overly tight flat settings ~ can drive short fiber content up by 3.0 to 5.0 points, permanently degrading sliver quality.

Carding Action and Fiber Degradation
Cylinder wire running at high speed works against stationary or revolving flats to tease tufts down to single fibers. Main cylinders turn at surface speeds from 1,500 to 2,200 meters per minute. Fibers fed from the licker-in are caught by cylinder teeth and swept past flats set as close as 0.15 millimeters (0.006 inches), subjecting individual strands to heavy tensile and bending loads.
Immature or thin-walled fibers lack bending stiffness and snap easily under impact. Even strong mature fibers can rupture if caught between opposing wire teeth. Carding breakage shows up as a leftward shift on the AFIS length curve, with lower mean weight length L(w) and higher short fiber content SFC(w).
Balancing licker-in speed, cylinder wire angles, and clothing sharpness keeps mechanical damage down while preserving nep removal.
Setting carding flat clearance tighter than cylinder wire height breaks longer fibers into short fragments that accumulate as thick places in carded yarn.
Is Short Fiber Content More Critical than Mean Fiber Length?
Spinners routinely debate whether average staple length or the amount of sub-12.7 millimeter fiber has a bigger impact on yarn quality. Mills historically bought cotton based on upper half mean length or classer staple, assuming longer cotton guaranteed stronger yarn. In carded ring and rotor spinning, however, high Short Fiber Content degrades yarn structure even when upper half mean length looks ideal on paper.
Short fibers are simply too short to carry tension inside the yarn core. In ring spinning drafting, fibers shorter than the apron-to-front-nip distance drift without guidance, gathering into slubs or migrating outward to create surface hair while leaving weak thin spots behind. In rotor spinning, short fibers collect in the rotor groove, interrupting ribbon formation and causing end breaks.
For carded counts, keeping Short Fiber Content by weight under 8.5 percent matters far more for efficiency and evenness than adding 1/32 inch to upper half mean length.
| Process Stage | Mean Length L(w) | Upper Quartile Length UQL(w) | Short Fiber Content SFC(w) | AFIS Nep Count | AFIS Seed Coat Neps |
|---|---|---|---|---|---|
| Raw Bale Laydown Mix | 24.8 | 29.2 | 7.8 | 210 | 18 |
| Blowroom Cleaning Output | 24.2 | 28.9 | 8.6 | 265 | 14 |
| Card Sliver (Standard Carding) | 24.1 | 28.8 | 8.9 | 68 | 3 |
| Card Sliver (Aggressive Carding) | 22.6 | 27.5 | 12.4 | 42 | 2 |
| Breaker Drawframe Sliver | 24.3 | 28.9 | 8.7 | 62 | 3 |
| Finisher Drawframe Sliver | 24.4 | 29.0 | 8.5 | 58 | 2 |
Monitoring fiber metrics through preparation shows the clear trade-off between cleaning efficiency and length preservation. Aggressive carding drops neps from 210 down to 42 per gram, but pushes Short Fiber Content up from 7.8 to 12.4 percent while trimming Upper Quartile Length by 1.7 millimeters. Heavy carding breaks brittle fiber; maintaining sliver quality requires balancing nep removal against mechanical damage.
Cotton selection for carded yarn rests on clear physical constraints: raw stock with over 10 percent short fiber by weight cannot produce carded ring yarn finer than Ne 30 without exceeding standard mass variance limits.

Imperfection
Carded yarns show mass variations, structural defects, and surface fuzz whenever short fibers dominate the mix. Without combing to pull out short material, defects in the yarn trace straight back to raw cotton length profiles and drafting control. Capacitive testers like the Uster system group yarn imperfections into three types: thin places (-50%), thick places (+50%), and neps (+200%).
All three track directly with high Short Fiber Content, low Uniformity Index, and wide length distributions.
Overall mass variation is expressed as Coefficient of Variation, CVm. A high CVm signals an uneven strand with repeating thick and thin sections. Short fibers drive mass variation because they move unpredictably through drafting: when a cluster of floating short fibers passes the front nip together, it forms a thick place, leaving a depleted thin place right behind it.
Thin places are the main structural point of failure when yarn is stressed in weaving or knitting.

Uster Mass Variation and Structural Defects
Capacitive testers track cross-sectional mass along a running yarn strand at standard speeds. As yarn moves between sensor plates, changes in capacitance give millimeter-by-millimeter mass readings, flagging defects when mass crosses set thresholds relative to the average. Thin places (-50%) mark spots where mass drops to half the yarn average.
Thick places (+50%) are mass spikes over 150 percent lasting 4 millimeters, while neps (+200%) reflect tight mass spikes exceeding 300 percent over a 1-millimeter length.
Short fiber content drives thin places exponentially. On a Ne 20/1 carded ring yarn, increasing raw cotton SFC(w) from 7.5 to 11.5 percent jumps thin places from 8 per 1,000 meters up to over 65. Thick places increase right alongside them.
Neps ~ mostly tangled fibers from ginning and opening ~ worsen when short, immature fibers lack the stiffness to resist rolling into tight knots under friction.

Tensile Mechanics of Uncombed Assemblies
Yarn breaking strength relies on inter-fiber friction and strand overlap created during twisting. Under tension, yarn fails in one of two ways: fiber rupture or inter-fiber slippage. In combed yarns with long, uniform fibers, breakages happen mostly through fiber rupture.
In carded yarns carrying high short fiber fractions, failure comes mainly from fibers slipping past one another.
Fibers shorter than 12.7 millimeters contribute very little frictional grip. When tension is applied, short fiber ends slip out of the core without bearing load, effectively leaving only the longer fibers to hold the strand together. Single-end yarn strength is governed by:
Yarn Tenacity (cN/tex) = Fiber Tenacity Twist Efficiency Factor
Here, K accounts for fiber friction and short fiber mass fraction. As short fiber content rises, Effective Staple Length drops, cutting yarn tenacity. In tests on carded Ne 30/1 ring yarn, tenacity dropped from 16.5 down to 12.8 cN/tex when the raw cotton Uniformity Index fell from 83 to 78 percent.
Hairiness Profiles and Surface Fiber Dynamics
Optical sensors count fibers projecting from the core to measure surface hairiness. The Uster Hairiness Index, H, measures the total length of protruding fiber ends in centimeters per centimeter of yarn. Zweigle testers offer complementary counts grouped by length from 1 millimeter to over 10 millimeters (where S3 is the count of fibers >= 3 mm).
Short fibers contribute heavily to hairiness. During twisting, fiber ends migrate toward the strand exterior. Having fewer anchorage points in the yarn core, short fiber ends get thrown outward by centrifugal force to form a halo of fuzz.
High hairiness causes downstream issues: increased pilling in knits, warp entanglement during weaving shed opening, and excessive lint shed in knitting operations.
Carded ring spun yarns produced from bales with low uniformity index demand higher twist multipliers to maintain spinning tenacity.
Carded spinning performance depends heavily on tight length distributions. Poor fiber profiles trigger four main failure modes:
- Drafting Wave Inconsistency ~ Uncontrolled floating short fibers move erratically in the draft zone, forming thick and thin slubs that drive up yarn mass CVm.
- Tensile Failure via Slippage ~ Weak anchorage allows fibers to slip under load rather than break, dropping tenacity below weaving minimums.
- Excessive Surface Hairiness Spike ~ Unanchored short ends migrate outward during twisting, spiking Uster H values and pushing Zweigle S3 counts above 250 per 100 meters.
- Elevated Fly Waste Accumulation ~ Fibers under 6 millimeters escape twisting control altogether, shedding into room air and clogging traveler clearers.
| Yarn Spec & SFC Tier | CVm | Thin Places (-50%) | Thick Places (+50%) | Neps (+200%) | Tenacity | Uster Hairiness H |
|---|---|---|---|---|---|---|
| Ne 20/1 Carded (SFCw < 8.0%) | 12.2 | 4 | 110 | 180 | 16.8 | 5.8 |
| Ne 20/1 Carded (SFCw 8.0-10.5%) | 13.8 | 22 | 240 | 310 | 14.9 | 6.6 |
| Ne 20/1 Carded (SFCw > 11.5%) | 15.9 | 85 | 480 | 590 | 12.8 | 7.9 |
| Ne 30/1 Carded (SFCw < 8.0%) | 13.6 | 18 | 220 | 340 | 15.2 | 4.9 |
| Ne 30/1 Carded (SFCw 8.0-10.5%) | 15.4 | 72 | 460 | 680 | 13.1 | 5.7 |
| Ne 30/1 Carded (SFCw > 11.5%) | 18.1 | 260 | 920 | 1240 | 10.8 | 7.1 |
Buying raw cotton without maximum Short Fiber Content specs directly undermines yarn quality. Allowing raw SFC(w) to drift from 8.0 to 11.5 percent brings a 25 percent rise in yarn mass variance, ten times more thin places, and a 20 percent loss in tensile strength ~ leading directly to fabric seconds, dye streaks, and lot rejections.

Valuation
Sourcing practices balance fiber parameters against spot premiums to calculate net raw material costs for carded mills. Base cotton contracts typically assume Strict Low Middling 1-1/16 inch (34 staple), micronaire between 3.5 and 4.9, and a Uniformity Index of 80 to 82 percent. Deviations trigger premiums or discounts on exchanges like the Intercontinental Exchange (ICE) Cotton No. 2 contract or physical spot sheets.
Staple length premiums are quoted explicitly, but short fiber penalties rarely appear as separate line items. Merchants fold short fiber risks into Uniformity Index discounts or staple deductions. Advanced procurement unbundles these numbers using independent AFIS lab screening to negotiate claims or reject substandard lots before bales reach the laydown.

Commercial Discount Matrices for Short Fiber Skew
Cotton exchanges apply financial discounts when HVI tests show high short fiber levels. Uniformity Index values below 80 percent trigger progressive discounts in points per pound (100 points equaling 1 US cent). A lot testing between 77.0 and 78.9 percent Uniformity Index, for example, receives a discount of 250 to 400 points per pound off base price ~ equivalent to 5.5 to 8.8 US cents per kilogram.
Standard HVI Uniformity Index discounts rarely cover the actual mill costs of high-SFC cotton. When weight-based Short Fiber Content exceeds 10.5 percent, card room fly waste rises by 2.0 percent, breaker drawframe end breaks double, and ring spinning efficiency drops 4.5 percent. Mill losses and fabric markdowns cost 12 to 18 US cents per kilogram of yarn ~ far outweighing the initial 5.5 to 8.8 cent purchase discount.
Procurement Contract Specifications for Mill Delivery
Raw material contracts bind fiber properties to laboratory standards before shipment release. Relying solely on standard trade rules ~ like ICA or ACSA frameworks ~ provides basic arbitration rules but often leaves short fiber limits vague unless specific technical addendums are written in.
Buying cotton for quality carded yarns requires writing specific length clauses straight into purchase orders, setting hard rejection limits on AFIS Short Fiber Content, HVI Uniformity Index, and Upper Half Mean Length. Pre-shipment sampling catches outlier bales early so they can be swapped out before container loading.
Raw material qualification requires rigorous verification when sourcing for carded spinning. Contracts should specify four key verification requirements:
- Dual Laboratory Test Specification ~ Require both High Volume Instrument (ASTM D5867) and Advanced Fiber Information System (ASTM D5340) test dossiers for every 100-bale lot before authorizing shipment.
- Uniformity Index Hard Floor ~ Set minimum HVI Uniformity Index limits at 81.5 percent for Ne 20 carded yarn and 83.0 percent for Ne 30, with full rejection rights below those thresholds.
- Discrete Short Fiber Ceiling ~ Cap AFIS Short Fiber Content at 8.5 percent by weight and 22.0 percent by number.
- Bale Blend Variance Control ~ Cap Upper Half Mean Length standard deviation within a 100-bale laydown mix at 0.03 inches to avoid drafting surges between bales.
Bale qualification follows a structured receiving sequence upon arrival at the mill:
- Sample 10 percent of incoming bales using mechanical core borers, drawing 100-gram specimens from opposing sides of each sampled bale.
- Condition samples in an accredited lab at 20 +/- 2 degrees Celsius and 65 +/- 4 percent relative humidity for at least 24 hours per ISO 139 standards.
- Test conditioned samples on calibrated HVI and AFIS lines to establish lot averages for UHML, UI, UQL(w), and SFC(w).
- Compare lot averages and standard deviations against contract specs, issuing debit notes or lot rejections within 14 business days of delivery.
Commercial contracts for carded cotton typically include explicit dispute clauses. A standard agreement reads: “Should AFIS Short Fiber Content by weight exceeding 9.0 percent be established by an accredited independent laboratory using ASTM D5340 test protocols on joint core samples, the buyer reserves the right to reject the delivered lot in its entirety or claim a net invoice price adjustment of 1.5 US cents per kilogram for every 0.5 percent SFC(w) increment above the contract baseline limit.”