Calibrating Optical Laser Instruments for Fine Cashmere Fiber Testing
Precise optical calibration against certified wool and cashmere standards prevents costly diameter drift, securing accurate micron declarations and customs tariffs.
Beam
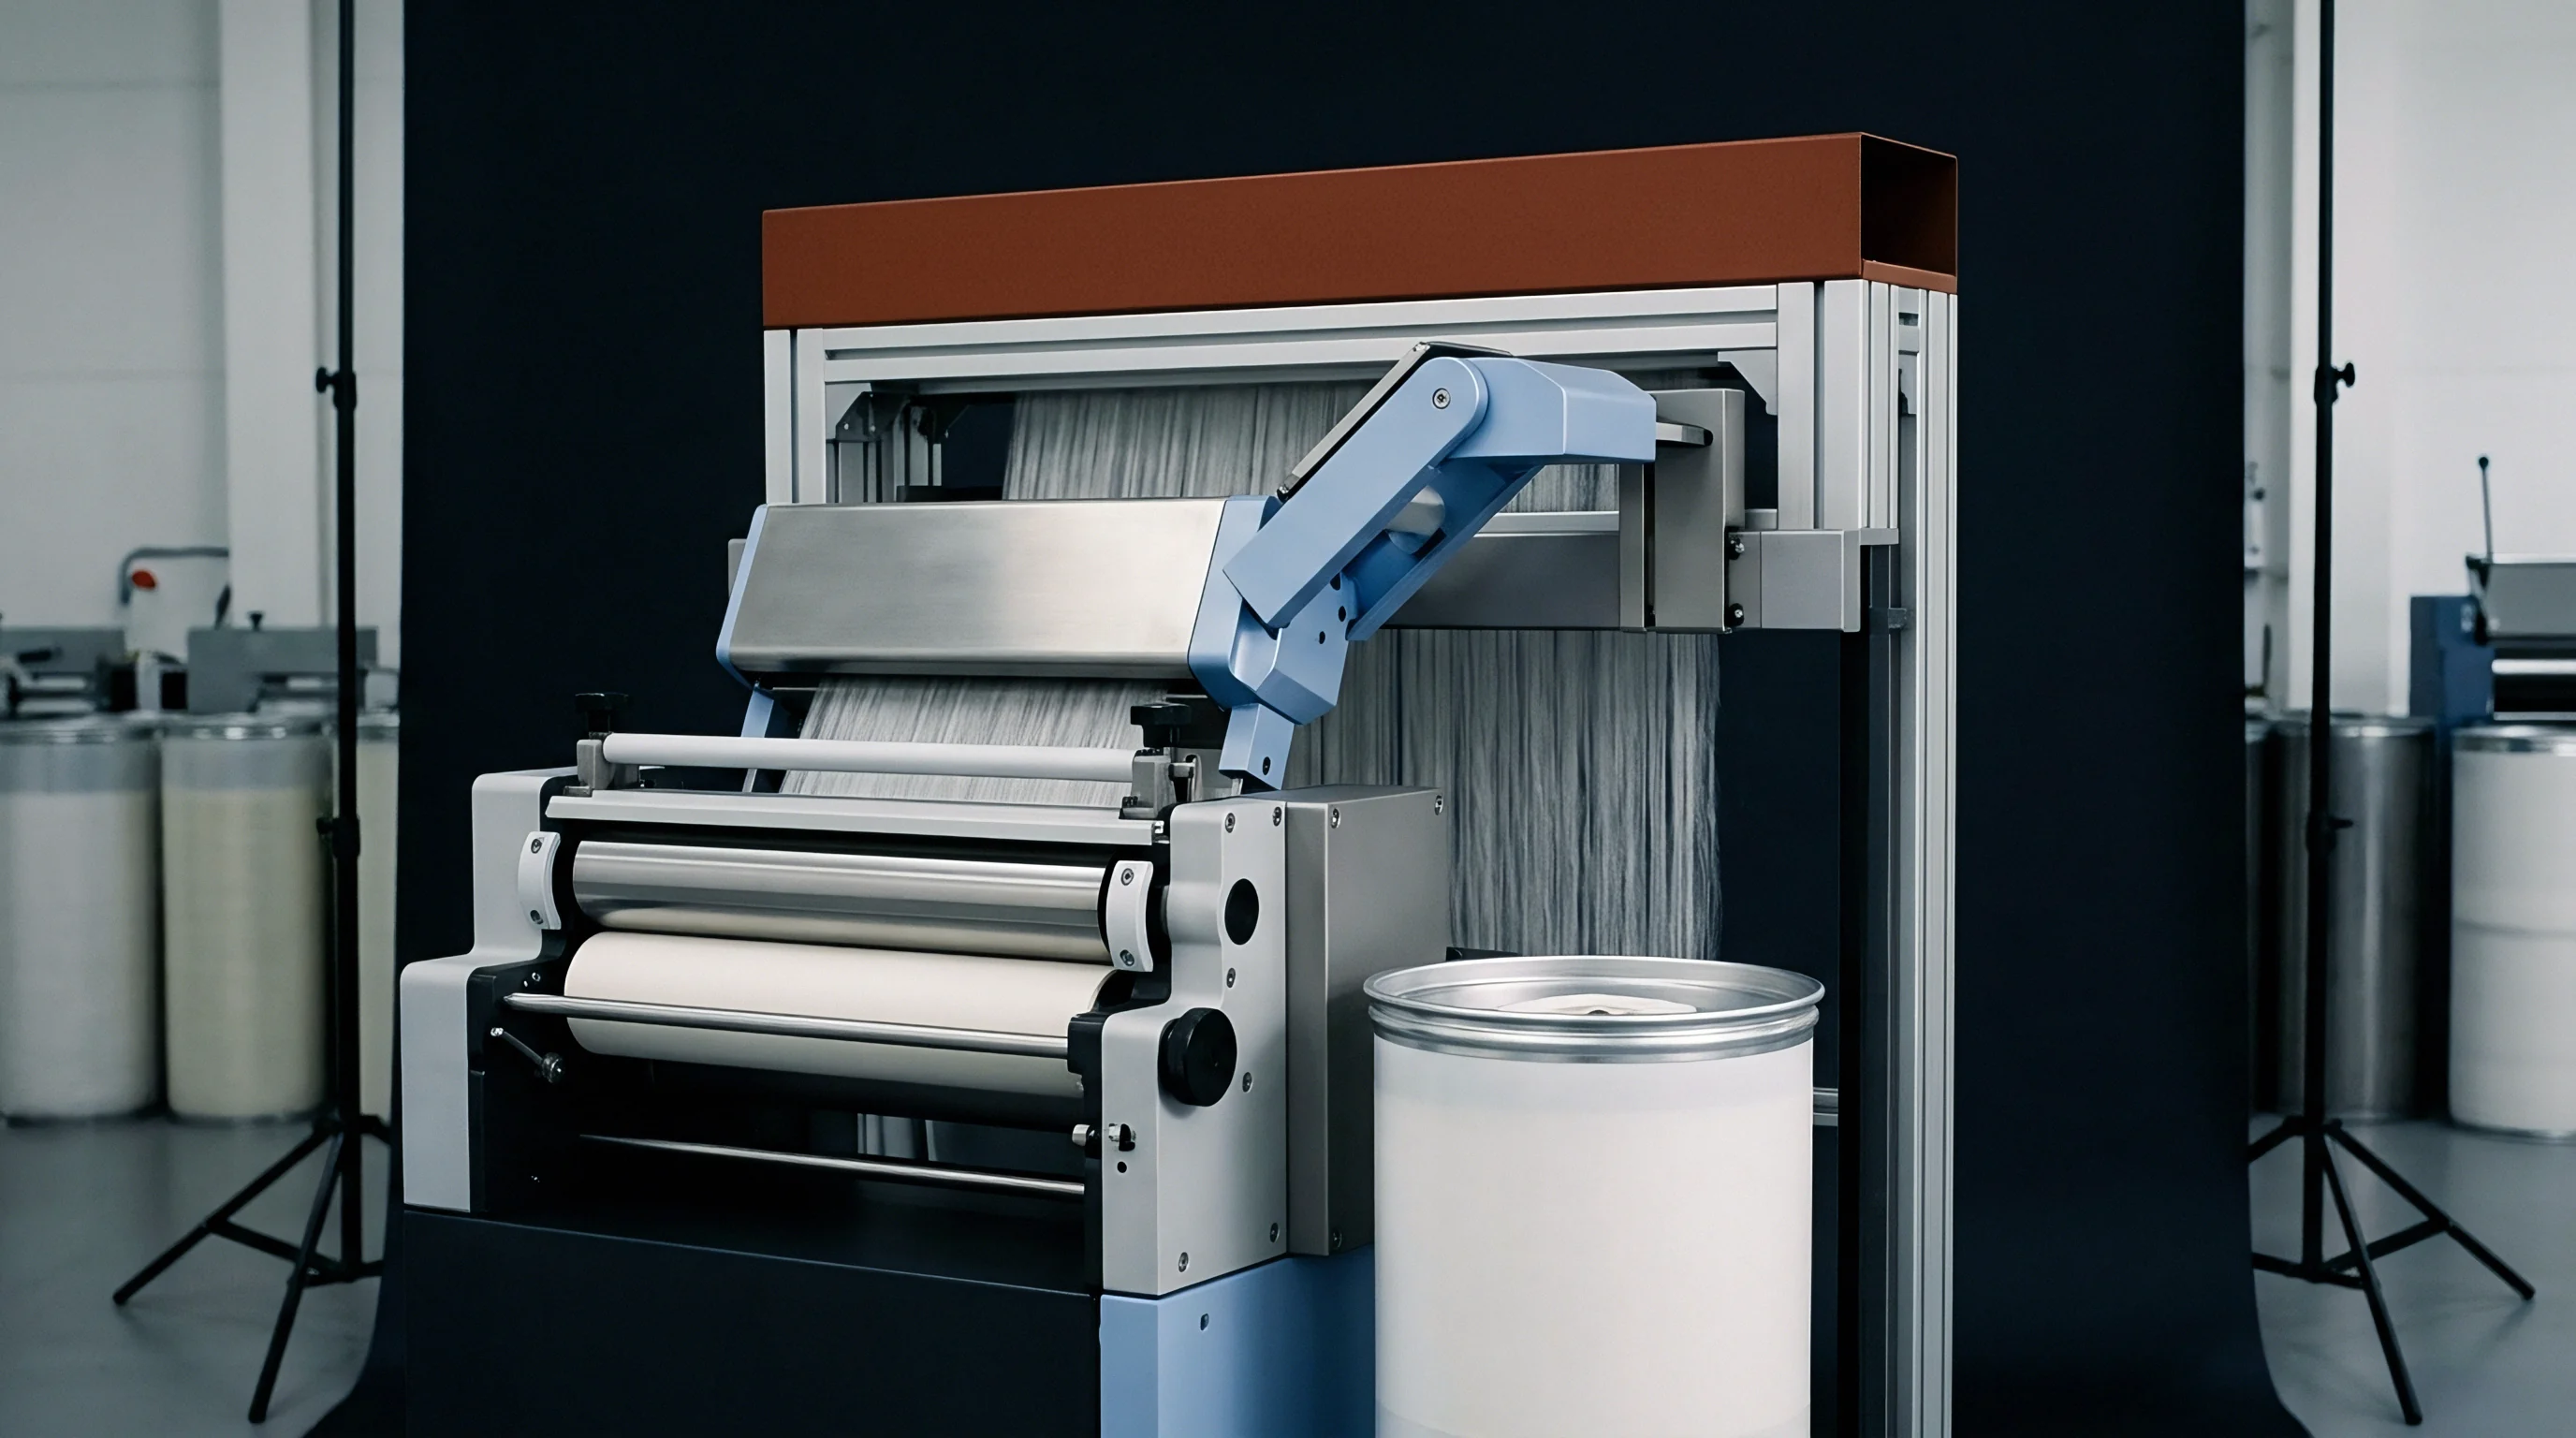
Coherent illumination sources in automated fiber diameter analyzers project monochromatic light through a focused measuring cell where suspended snippets pass across the focal plane. In instruments like the Optical Fibre Diameter Analyser and the Sirolan LaserScan, laser light interacts with single fiber profiles to produce micro-shadows or forward-angle diffraction patterns. Photo-detector arrays translate these optical interruptions into voltage changes proportional to individual fiber cross-sections.
Fine cashmere fibers, possessing mean diameters between 14.0 and 16.5 microns, demand exceptional focal precision because light diffraction angles widen significantly as fiber dimensions shrink toward the wavelength of the light source.
Laser diode emission power shifts over time, while thermal expansion of chassis components alters the critical distance between projection lenses, micro-fluidic channels, and charge-coupled sensor arrays. Without regular calibration against certified reference materials, subtle optical misalignments read as artificial diameter shifts. A drift of merely 0.2 microns distorts the true distribution curve of a dehaired cashmere lot, misrepresenting fine fiber fractions as coarse hair or under-reporting the presence of damaging guard hair fragments.
Optical bench configurations vary between shadow-imaging systems and pure laser diffraction instruments. Shadow-imaging units calculate diameter by digitizing grayscale pixel edges of individual fiber images captured on a glass slide. Laser diffraction units calculate diameter by measuring light scatter intensity across photo-diode rings as snippets move in a liquid medium through a flow cell.
Both physical mechanisms rely on absolute optical zeroing and linear calibration curves established using standard wool calibration tops across a 12 to 35 micron range.
Optical Diffraction Mechanics in Diameter Measurement
Light passing around a fine animal fiber generates a characteristic Fresnel diffraction envelope. Diffraction angle varies inversely with fiber thickness, meaning thinner cashmere strands scatter coherent light at wider angles than coarse wool. The instrument sensor maps this scatter pattern to convert angular displacement into linear spatial dimensions.
When measuring cashmere below 15 microns, rayleigh-gans scattering dynamics demand stable monochromatic wavelengths, typically 632.8 nanometers from helium-neon units or solid-state laser diodes operating at 650 nanometers.
Progressive diode degradation shifts central emission wavelengths and reduces peak illumination intensity, causing shadow edges to blur at the sensor plane. When edge thresholding algorithms process softened diffraction boundaries, the software overestimates fiber thickness. Daily verification of optical baseline signals prevents systematic over-sizing of fine fiber lots.

Diode Emission Stability and Thermal Drift
Temperature variations within testing facilities alter optical alignment. Bench components expanded by ambient heat displace the laser diode relative to the pinhole aperture by fractions of a millimeter. This spatial shift alters beam spatial uniformity, creating intensity gradients across the measuring zone.
Fiber snippets passing through warmer, lower-intensity regions cast fainter shadows, which optical algorithms misinterpret as smaller diameters.
Dust accumulation on mirrors and receiver windows absorbs light and creates stationary optical artifacts that systematically corrupt fiber diameter distribution statistics. Standard testing environments control atmospheric conditions to 20°C ± 2°C and 65% ± 4% relative humidity under International Wool Textile Organisation standard IWTO-47 to stabilize bench optics.
| Parameter | Laser Scan Flow Cell System | OFDA Image Analysis System | Tolerance Limit |
|---|---|---|---|
| Light Source | Solid-state Laser Diode (650 nm) | Halogen / LED Array (550 nm) | ± 5 nm Wavelength |
| Measuring Zone Depth | 0.5 mm Liquid Flow Channel | 0.1 mm Glass Slide Depth | ± 0.02 mm Position |
| Carrier Medium | Isopropanol / Water Mixture | Air / Dry Glass Slide | 1.38 Refractive Index |
| Sample Throughput | 2,000 Snippets per Minute | 10,000 Snippets per Minute | 1.0% Coincidence Cap |
| Calibration Standard | IWTO Interwoollamb Tops | IWTO Interwoollamb Tops | ± 0.1 µm MFD Accuracy |
Operating an uncalibrated optical bench leaves the buyer exposed to systematic diameter underestimation, yielding raw stock that fails spinning performance targets and triggers client rejections.

Preparation
Representative sample extraction determines the validity of all downstream optical measurements. Cashmere raw stock arrives in compressed bales containing highly variable fiber populations, including fine down, intermediate coarse fibers, and heavy guard hair. Classers draw core samples across multiple bale locations using pneumatic coring tubes fitted with sharp cutting tips.
These raw cores undergo thorough scouring to remove grease, suint, sand, and vegetable matter, as residual impurities distort laser beam paths and contaminate liquid carrier suspensions.
Cleaned down fibers require uniform snippet cutting to present precise cross-sections to the laser sensor. Guillotine cutters produce snippets between 1.2 mm and 2.0 mm in length. Snippets cut too long entangle in transport channels, forming multi-fiber clumps that pass the optical sensor as single ultra-coarse structures.
Snippets cut too short tilt off-axis within flow channels, presenting oblique cross-sections that register as false high-diameter readings.

Micro Coring Precision and Snippet Length Distribution
Guillotine blade condition governs snippet edge quality. Dull blades crush fiber ends during cutting, creating splayed fibrils and flattened tips that scatter light abnormally and inflate measured standard deviations. Blade sharpening intervals must follow strict sample-count limits to prevent physical fiber degradation during snippet preparation.
Dry ambient conditions cause fine cashmere strands to build static charges and cling to metal micro-coring dies or glass dispersion vessels. Anti-static ionization bars installed above sample preparation stations neutralize surface charges, allowing individual fibers to separate cleanly during fluid mixing or pneumatic dispersion.

Solvent Suspension and Coincidence Error Minimization
Fluid-based laser instruments disperse cut snippets into an isopropanol-water carrier solution. Solvent density and viscosity dictate fiber transit speed through the measuring flow cell. If solvent mixing ratios drift, fiber transit speed alters, causing the signal processing unit to miscalculate shadow duration.
IWTO-47 mandates secondary calibration checks whenever ambient laboratory temperatures fluctuate beyond two degrees Celsius during continuous testing runs.
Coincidence errors occur when two fibers cross the laser beam simultaneously. The instrument optical sensor reads overlapping cashmere snippets as a single fiber of double thickness. High sample concentration in the solvent slurry elevates coincidence rates, skewing the overall diameter distribution curve to the right.
Technicians control slurry concentration to maintain coincidence frequency below one percent of total counted snippets.
The list below identifies critical failure modes encountered during sample snippet presentation for laser analysis.
- Fluidic snippet clumping occurs when inadequate surfactant concentration permits hydrophobic cashmere fibers to agglomerate in liquid transport channels.
- Oblique alignment drift develops when fluid transport velocities drop below recommended laminar flow thresholds, causing snippets to tumble past optical sensors.
- Refractive solvent contamination results from particulate accumulation or chemical evaporation in recirculated isopropanol baths, shifting light diffraction angles.
- Air bubble interference manifests when un-degassed liquid carrier solutions release micro-bubbles that mimic small round fiber profiles under laser illumination.
Solvent temperature variations during routine testing runs can drift enough to alter fluid viscosity and transit velocity even when thought to sit within ambient noise limits.


Adjustment
Linearization procedures convert optical voltage outputs into certified mean fiber diameter values. Calibration relies on official Interwoollamb wool calibration tops possessing known mean diameters verified by international round-robin microscopy trials. Because cashmere down fibers possess distinct optical and physical traits compared to wool, calibration mathematical curves must incorporate specific offset factors.
Fine cashmere exhibits a smoother scale structure and lower optical reflectance than fine merino wool, altering light scattering efficiency at fiber boundaries.
Software adjustment parameters fit raw instrument voltage output against a set of eight Interwoollamb calibration standards spanning 14.5 to 35.0 microns. The instrument software calculates a least-squares polynomial regression line. Calibration acceptance criteria mandate a coefficient of determination exceeding 0.998.
If regression slope or intercept shifts beyond defined threshold limits, mechanical optical cleaning and laser re-alignment must precede further software adjustment.

Which Calibration Standards Resolve Optical Diameter Drift?
International wool standards provide the global reference framework, but dedicated cashmere calibration tops establish the precise optical baseline for fine animal fiber testing. Wool fibers feature pronounced cuticle scale edges averaging 0.5 to 0.8 microns in thickness, whereas cashmere scales feature thinner edges under 0.4 microns. These structural differences affect peripheral light refraction.
Using wool calibration curves without cashmere-specific offset corrections introduces a systematic positive diameter bias of 0.2 to 0.4 microns on fine cashmere samples.
Fiber regain state directly impacts physical dimensions, as cashmere fibers swell in cross-sectional area when ambient humidity rises. Calibration tops must equilibrate in standardized atmospheric chambers for 24 hours prior to optical bench runs to eliminate moisture-induced calibration error.
Clean optical glass slides produce tighter diameter distributions by preventing dust artifacts from skewing baseline intensity signals.
The following sequence outlines the standard procedure for performing monthly multi-point instrument calibration alignment.
- Purge fluidic transport lines with fresh, filtered electronic-grade isopropanol to remove residual fiber snippets and particulate contamination.
- Inspect optical windows and laser focusing lenses under 10x magnification, cleaning surfaces with lint-free optic wipes soaked in pure ethanol.
- Run a zero-baseline optical count with pure solvent to verify that particulate counts remain below five items per minute.
- Introduce Interwoollamb standard sample 1450, recording mean voltage and calculated diameter across 2,000 individual valid counts.
- Process sequentially six additional calibration tops up to standard 3500, generating a multi-point optical response array.
- Execute polynomial regression fitting within system software, verifying that slope values sit within standard operational tolerances.
- Run a certified cashmere check sample of known diameter to confirm that optical offset corrections perform accurately.
Refractive Index Variance between Cashmere and Merino Calibration Tops
Refractive index properties govern light bending angles as laser beams pass through the fiber edge into carrier fluid. Keratin protein in cashmere exhibits a refractive index near 1.54. Minor variations in lipid content or residual scouring grease alter edge light refraction, altering perceived fiber width.
Isopropanol-water mixtures engineered to match keratin refractive indices reduce scattering noise at fiber perimeters.
Temperature shifts alter fluid refractive index values. As carrier liquid warms during extended testing cycles, solvent density drops, changing the refractive index differential between fiber snippet and liquid medium. Thermal stabilization loops inside instrument fluid circuits protect measurement consistency across multi-shift testing regimes.
Calibration runs using wool standards always precede official cashmere testing when ambient bench humidity moves outside nominal range.

Validation
Inter-laboratory validation protocols ensure that laser measurement instruments return identical mean fiber diameter values across global testing locations. Under IWTO-57, certified laboratories participate in regular proficiency testing where identical samples of dehaired cashmere top are analyzed under strict blind conditions. Statistical metrics evaluate mean fiber diameter, standard deviation, and coefficient of variation.
Laboratory instruments failing tolerance limits undergo mandatory re-calibration and optical maintenance.
Mean fiber diameter controls commercial pricing in fine fiber markets. A raw cashmere lot measuring 15.0 microns commands a substantial market premium over a 15.5 micron lot. When instrument calibration errors introduce bias, buyer and seller face immediate monetary misallocation.
A positive optical drift of 0.3 microns on a 20-tonne shipment alters lot grading, reducing landed revenue by significant margins.
Statistical Dispersion Limits under International Standards
Standard deviation reflects diameter uniformity within a cashmere lot. Fine cashmere down typically exhibits a standard deviation between 3.2 and 3.8 microns, corresponding to a coefficient of variation around 22% to 25%. Laser instruments record thousands of snippets per minute, offering tight statistical confidence intervals.
However, if optical zeroing shifts during testing, instrument software inflates the calculated standard deviation, masking the true uniformity of fine fiber stock.
Instrument validation requires thorough verification of upper and lower distribution tails. The presence of fibers exceeding 30 microns indicates residual guard hair contamination, which degrades yarn spinning efficiency and produces prickle discomfort in finished garments.
A calibration offset of zero point three microns shifts the commercial value of top-grade cashmere by twelve percent per clean kilogram.
Worked Valuation Impact of Laser Calibration Bias
To examine the commercial consequences of laser calibration bias, consider a bulk procurement contract for 20,000 kilograms of clean dehaired cashmere top. The target specification calls for Grade A cashmere with a mean fiber diameter of 15.20 microns at a base price of $135.00 per kilogram clean weight. Market contract clauses state that mean fiber diameters exceeding 15.20 microns incur price discount penalties of $12.00 per kilogram per 0.1 micron increase.
Furthermore, if the verified mean fiber diameter exceeds 15.50 microns, the buyer holds the legal right to reject the lot entirely or reclassify the shipment under a coarse fiber tariff line.
Assume an uncalibrated optical laser instrument exhibits a positive systematic bias of +0.30 microns due to optical lens contamination and thermal drift. The instrument records an actual 15.15 micron lot as measuring 15.45 microns. The table below demonstrates the resulting financial adjustments and customs duty implications generated by this optical measurement error.
| Evaluation Variable | True Fiber Value (15.15 µm) | Biased Laser Value (15.45 µm) | Financial Variance |
|---|---|---|---|
| Mean Fiber Diameter | 15.15 µm | 15.45 µm | +0.30 µm Calibration Bias |
| Contract Base Price | $135.00 / kg | $135.00 / kg | $0.00 Base Change |
| Penalty Discount Applied | $0.00 / kg (In Spec) | -$30.00 / kg (0.25 µm excess) | -$30.00 / kg Price Penalty |
| Total Clean Lot Value | $2,700,000.00 | $2,100,000.00 | -$600,000.00 Commercial Loss |
| Customs Tariff Heading | HS 5102.11 (Fine Cashmere) | HS 5102.11 (Borderline Coarse) | Risk of HS 5102.19 Reclassification |
| Import Duty Rate (EU/US) | 3.2% Preferential Duty | 6.0% Coarse Fiber Rate | +$75,600.00 Additional Duty Exposure |
The total financial exposure generated by an uncorrected 0.30 micron optical calibration bias amounts to $675,600.00 across price penalties and elevated duty lines on a single 20-tonne shipment, making routine calibration logging essential for protecting trade valuation.
A comprehensive laboratory validation dossier must include specific analytical artifacts to survive commercial audits.
- Daily optical zero calibration sheets recording baseline dark noise, beam intensity voltage, and clean solvent background counts.
- Interwoollamb regression curve charts demonstrating slope coefficients, intercept values, and r-squared values above 0.998.
- Secondary cashmere standard check logs showing mean diameter agreement within ± 0.10 microns against certified reference top values.
- Environmental monitoring records detailing continuous 24-hour temperature and relative humidity traces within testing chambers.
- Blade maintenance and snippet distribution audits proving uniform sample preparation without fibrillated cut edges.
ISO 13735 annex guidelines specify that inter-laboratory variances exceeding two tenths of a micron void the origin certification and force primary laboratory re-testing at the exporter expense.

Discrepancy
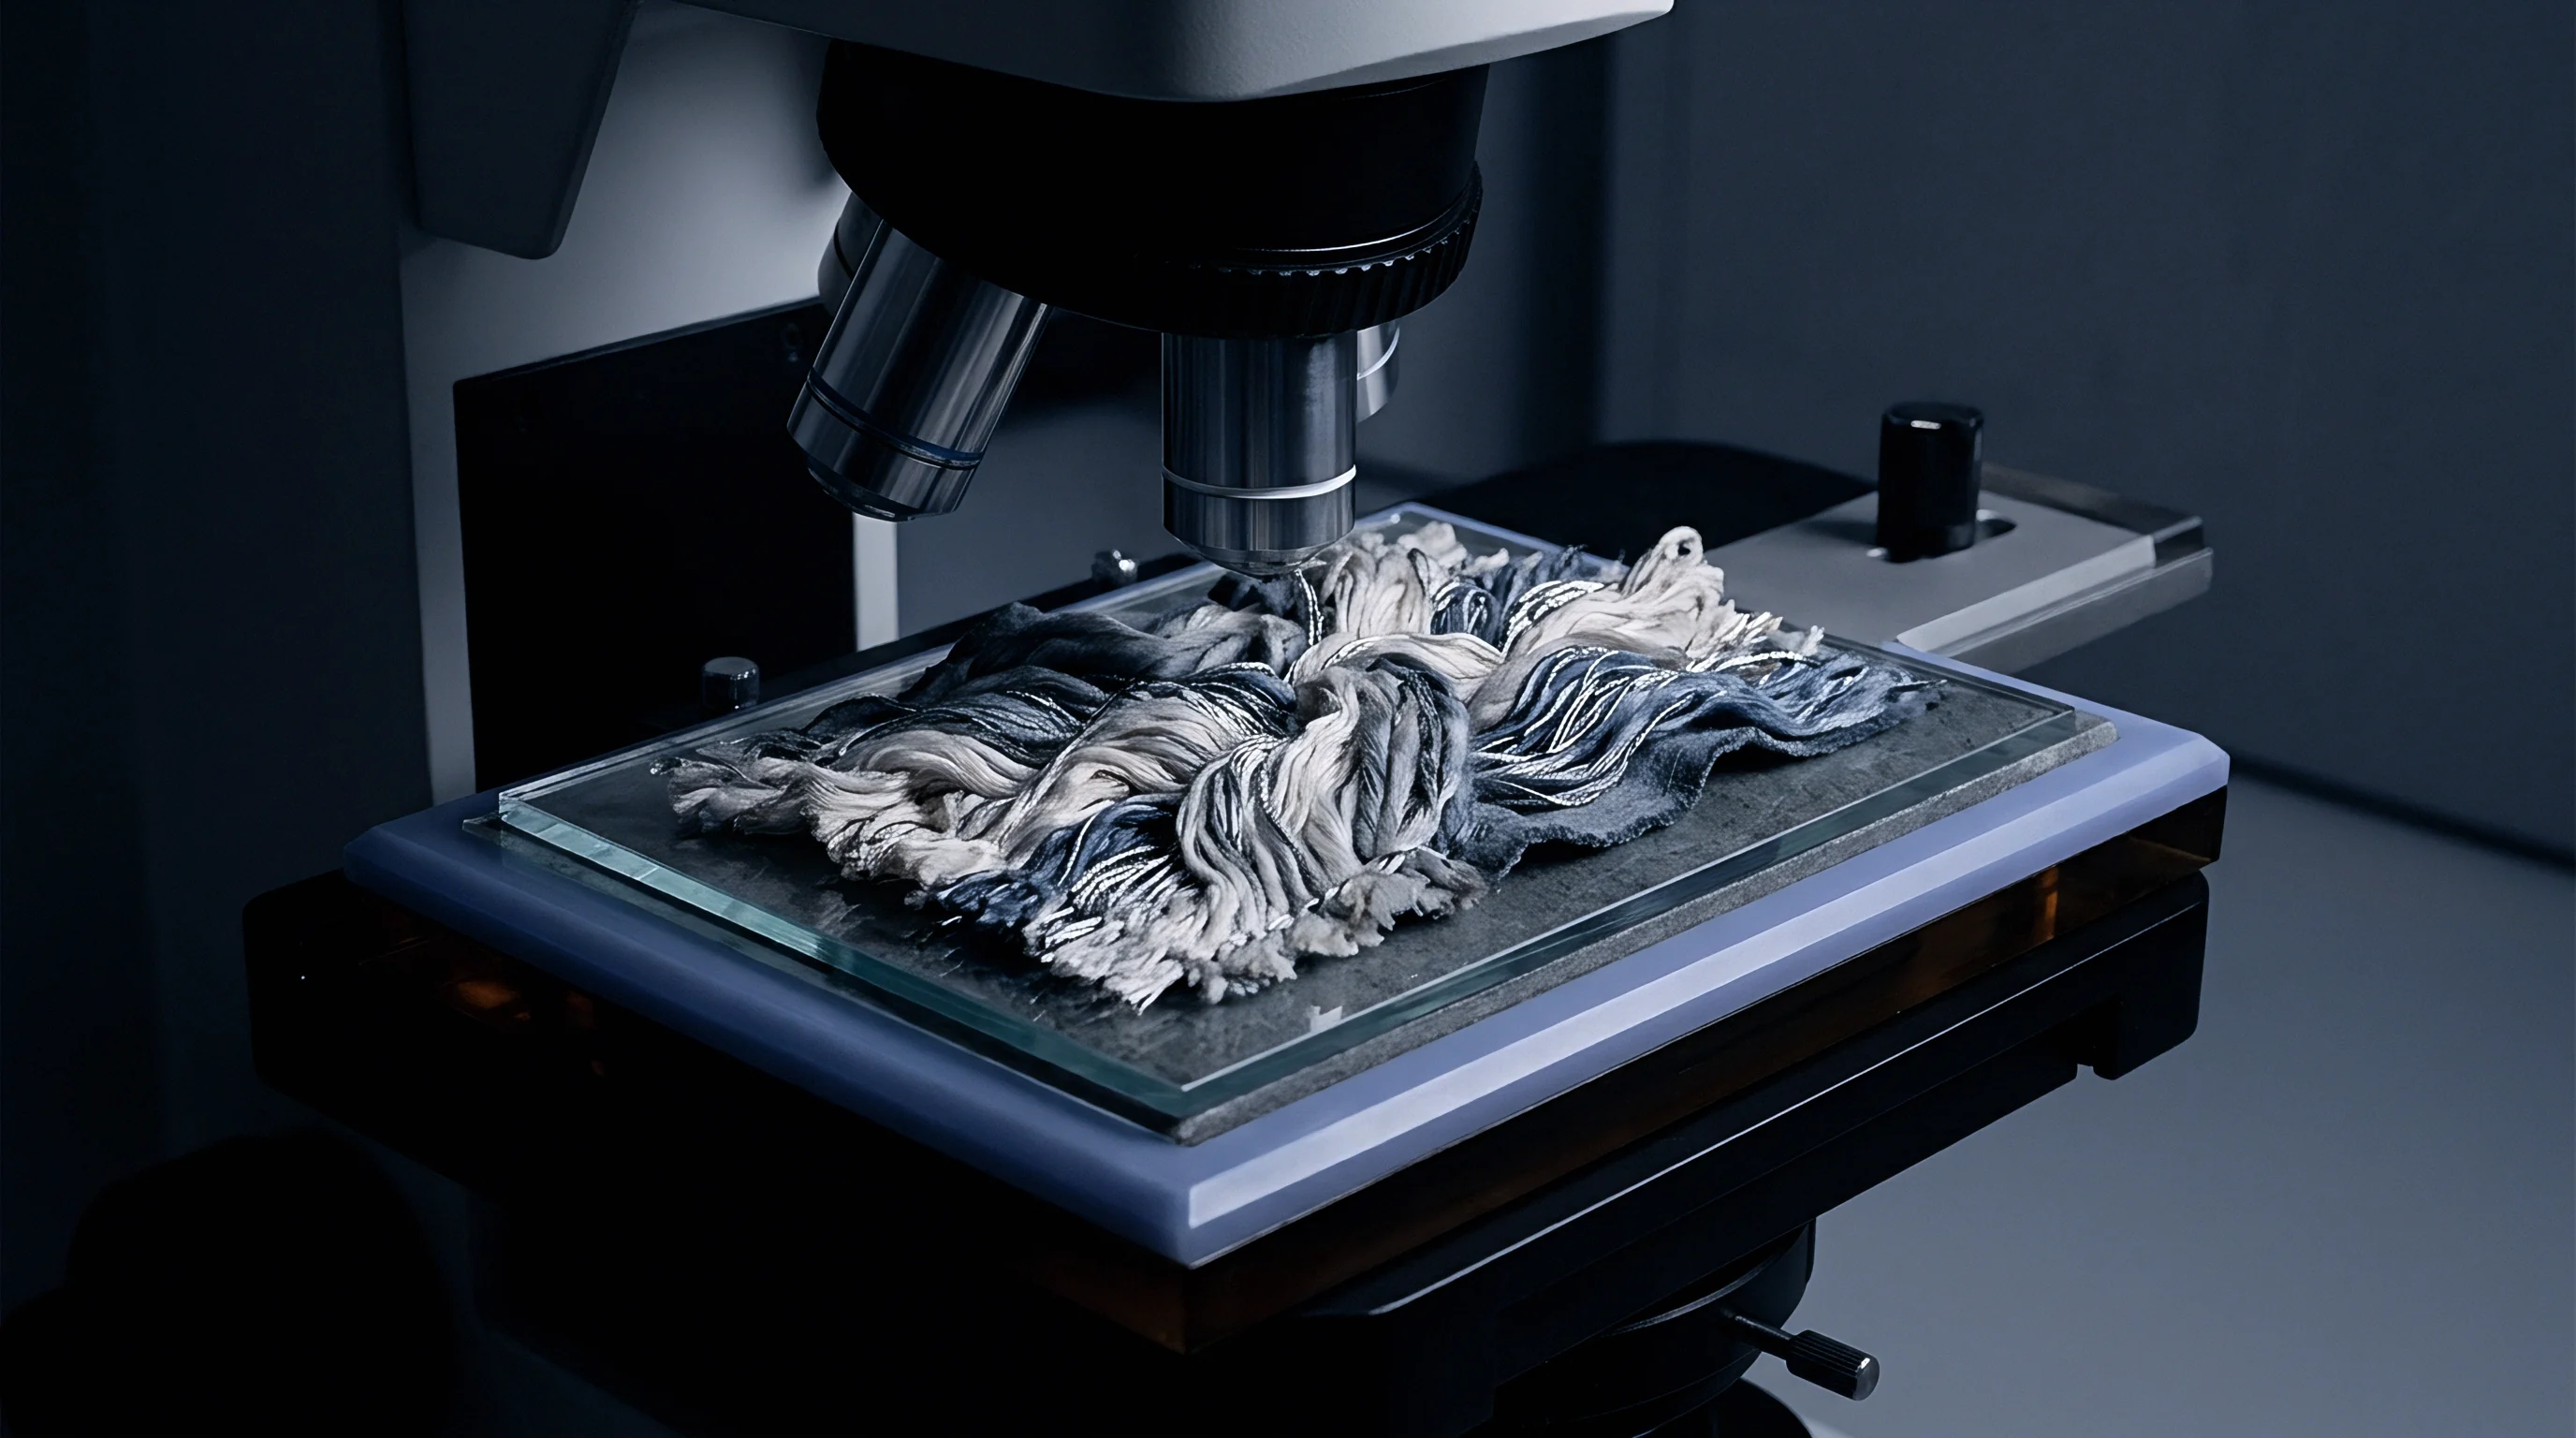
Discrepancies between optical laser analysis and classical projection microscopy under ISO 137 often lead to commercial disputes. Projection microscopy involves direct human measurement of fiber images magnified 500 times on a translucent screen. While projection microscopy serves as the legal primary standard in international trade disputes, human operator fatigue introduces subjective bias, particularly when differentiating between fine cashmere down and flattened coarse fiber fragments.
Automated laser instruments eliminate operator subjectivity and evaluate far larger snippet populations, providing higher statistical precision.
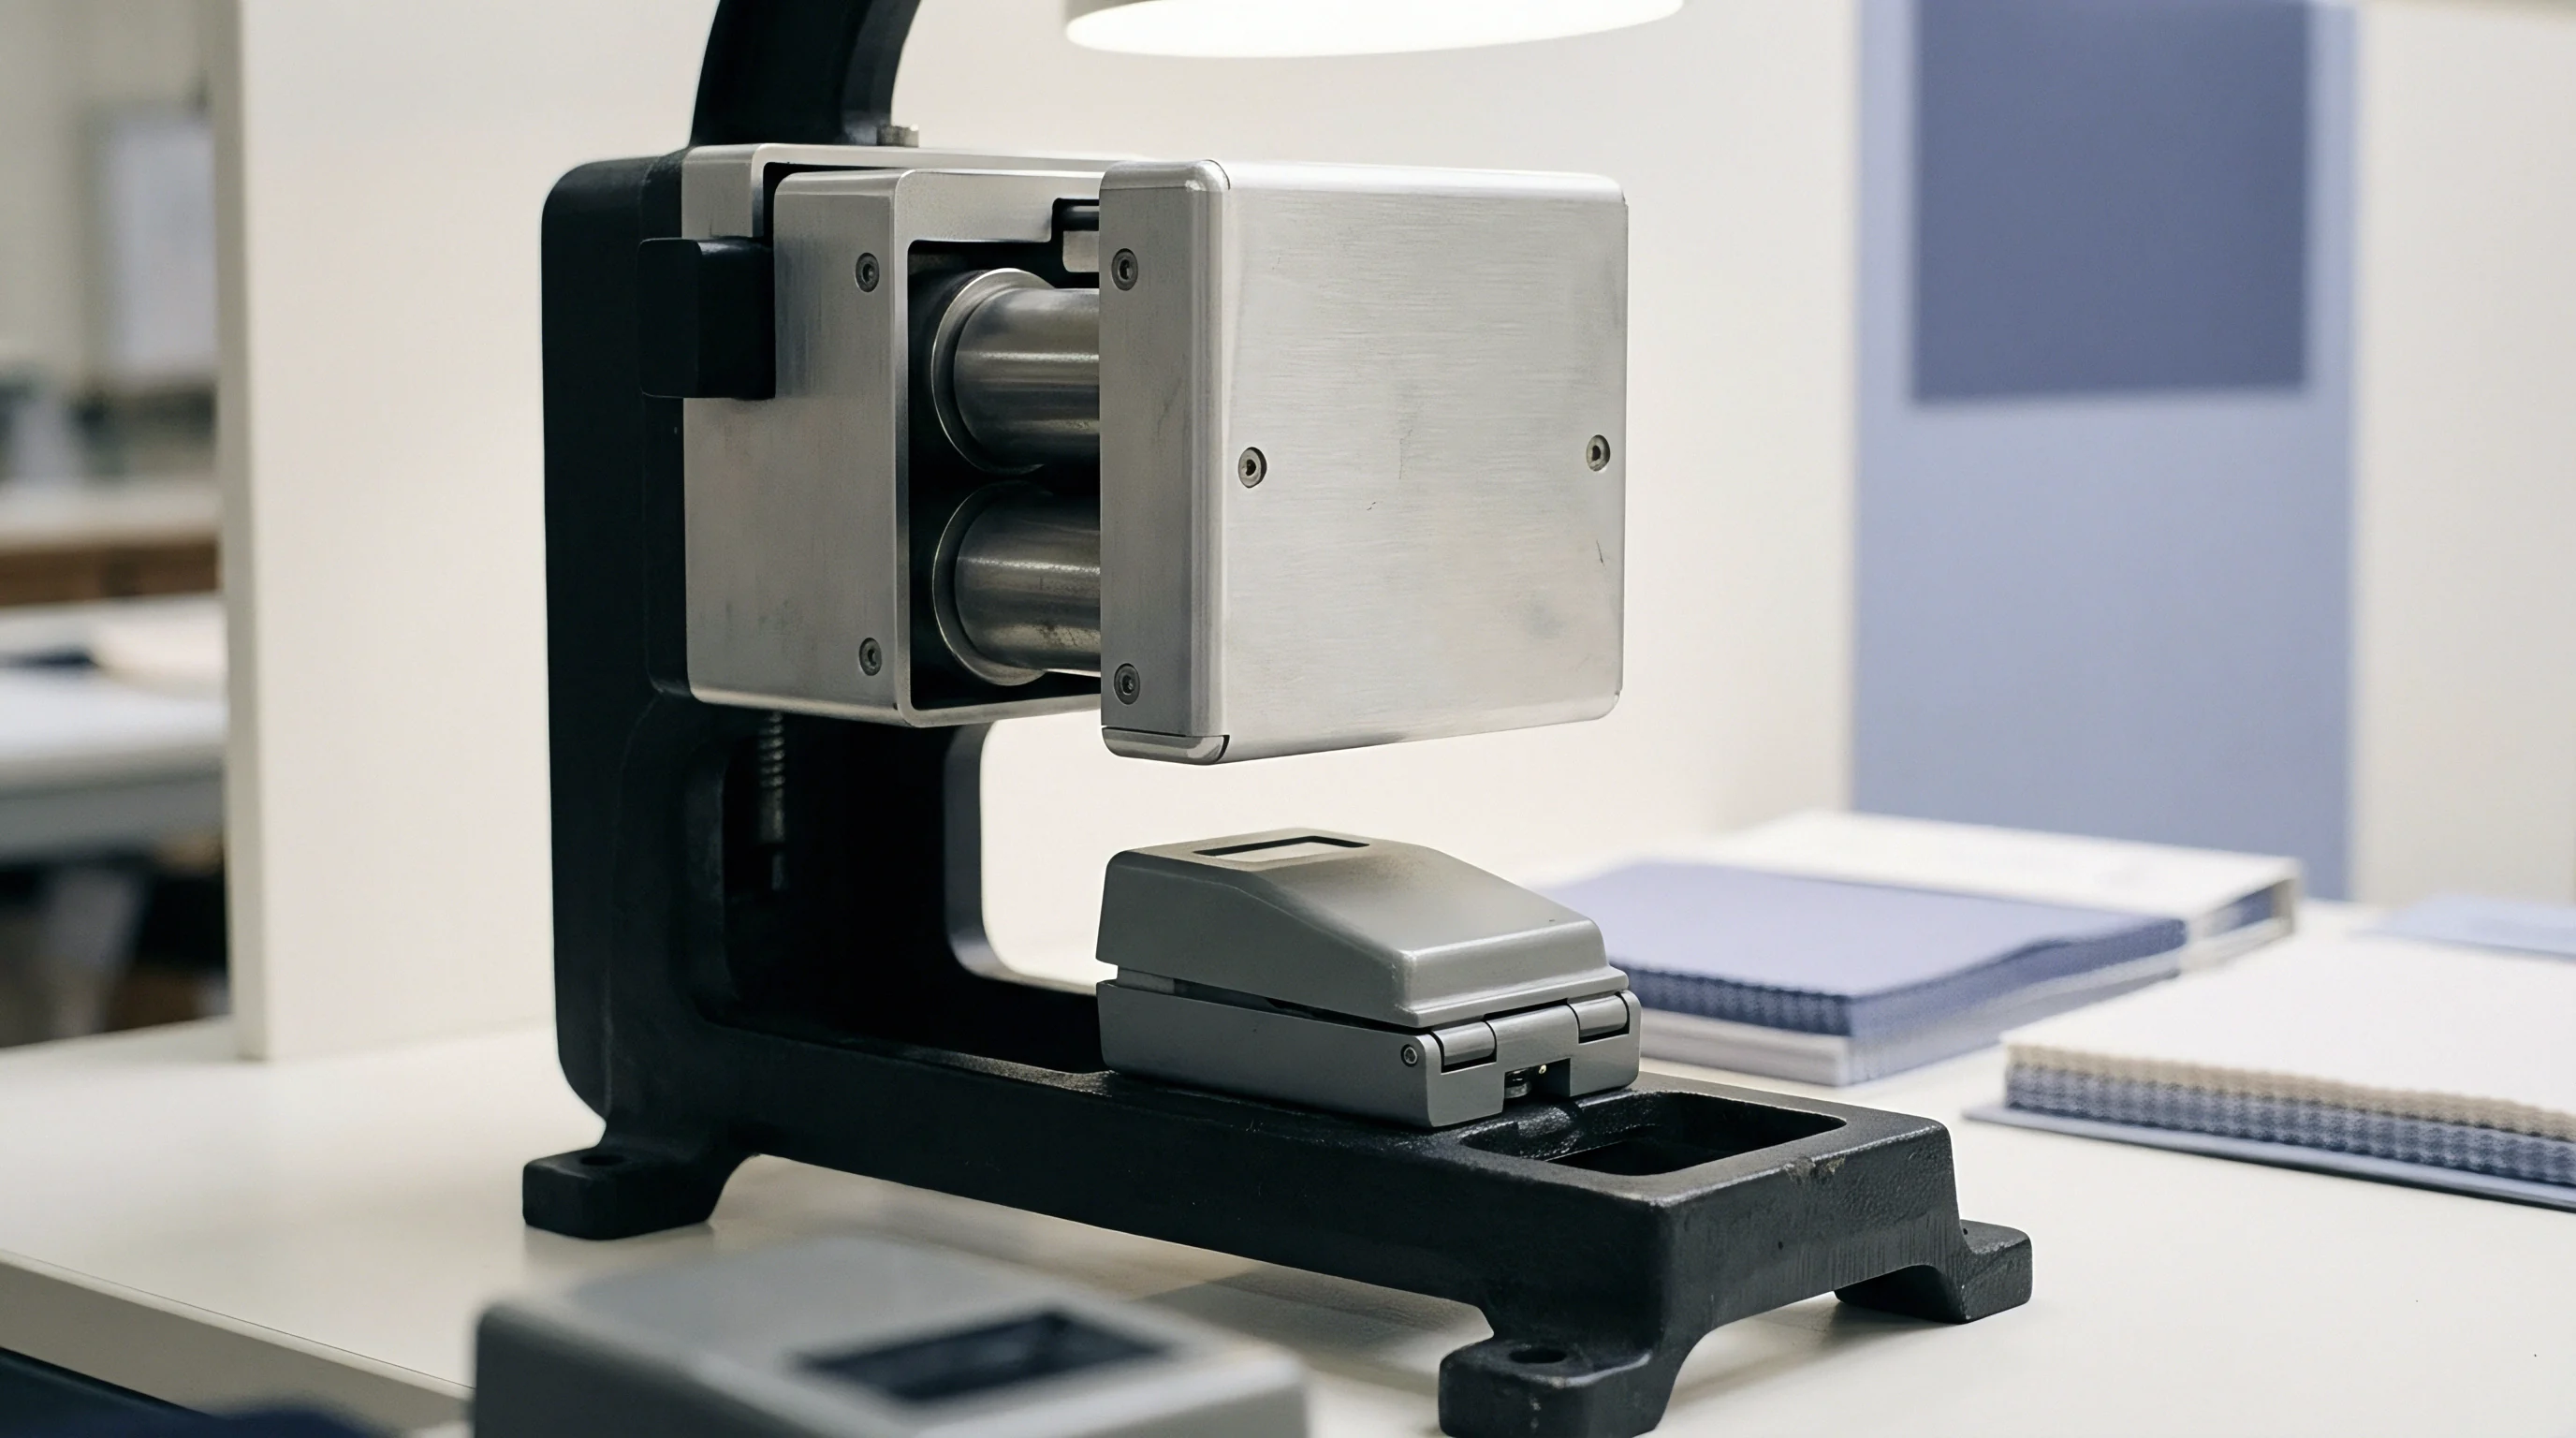
When optical laser readings conflict with projection microscope results, difference analysis evaluates instrument optical offsets, operator technique, and sample conditioning state. Projection microscopy yields slightly higher mean fiber diameter values on non-circular fibers because flat fibers lie horizontally on glass slides, exposing their widest axis to the microscope objective. Laser flow instruments capture fibers in random spatial orientations within fluid channels, returning an average equivalent optical cross-section.
Arbitration Pathways in Microscopic versus Laser Disputes
Import declarations entering major markets under HS 5102.11 for fine cashmere face rigorous customs testing to prevent tariff evasion through mislabeling. Authorities utilize both optical laser analysis and DNA-based species identification assays to verify fiber origin and diameter compliance. An uncalibrated laser reading that overestimates fiber thickness exposes importers to administrative holds, re-classification under higher duty tariffs, and punitive fines for false composition labeling.
Maintaining verified calibration trails establishes legal defense during customs audits. When commercial contracts name a specific testing method, arbitration panels uphold results derived strictly from instruments calibrated in full compliance with IWTO standards on the date of official testing.

Tariff Heading Shifts Driven by Micron Fractions
Harmonized System tariff codes establish strict boundary definitions between fine animal hair and coarse wool, requiring fine cashmere under HS 5102.11 to meet specific regional micron limits. If optical drift causes a certified test report to record a mean fiber diameter of 18.5 microns on a lot containing true 16.0 micron down mixed with guard hair, customs authorities reclassify the shipment under HS 5102.19 or HS 5101, fundamentally altering landed duty structures.
Customs authorities classify fine cashmere shipments strictly on mean fiber diameter figures confirmed through certified optical testing methods.
Arbitration guidelines require retained sample portions to undergo joint testing at an accredited third-party facility using freshly calibrated optical instruments. Both commercial counterparties must sign off on calibration documentation prior to executing arbitration runs to ensure absolute measurement transparency.
Technical committees continue to evaluate whether digital image recognition algorithms can entirely eliminate human bias when separating ultra-fine cashmere snippets from medullated guard hair fragments during automated optical sweeps.