Determining Statistical Precision Limits in ASTM and ISO Textile Testing
Statistical precision limits define allowable repeatability and reproducibility corridors, preventing false batch rejections in cross-border textile trade.

Scatter
Analytical instruments report numerical values that reflect both intrinsic material dispersion and measurement error. In textile physics, breaking strength determinations under ASTM D5034 or tear force measurements under ISO 13937-1 never generate identical readings across successive specimens pulled from the same bolt. Inherent spatial variations in yarn linear density, twist distribution, and fiber orientation produce natural dispersion.
Tension alters yarn geometry. When testing technicians record ten consecutive grab breaks on a single roll of plain-weave cotton sheeting, the observed spread represents the combined action of batch heterogeneity, atmospheric conditioning fluctuations, specimen clamping mechanics, and load cell noise. Establishing exact precision boundaries separates true lot performance from instrument noise.
Precision defines the degree of mutual agreement among independent test results obtained under stipulated experimental conditions. ASTM D2906 and ISO 5725-1 formalize this concept by separating experimental error into within-laboratory and between-laboratory components. The within-laboratory component, termed repeatability, isolates the minimum variation achievable when identical test items undergo evaluation by a single operator using one instrument inside an identical facility over a minimal time interval.
In contrast, reproducibility captures the expanded variation that appears when different technicians evaluate identical lot samples in separate commercial laboratories using different apparatus across multiple operating days. Batch variance outstrips machine error.
Testing machines report numbers without regard to the heterogeneity of the incoming fiber stock.
International commercial contracts depend on these mathematical boundaries to define enforceable rejection limits. When a technical data sheet specifies a minimum warp grab tensile strength of 450 newtons, an incoming border inspection result of 438 newtons does not automatically establish contractual non-compliance. If the established 95 percent repeatability limit for that test method equals 18 newtons, the observed reading sits within the statistical margin of normal measurement variance.
Specimen conditioning stabilizes fiber regain. Disregarding these limits triggers false lot rejections, expensive freight detentions, and unwarranted claims disputes between converters and garment manufacturers.
Repeatability Limits and Operator Variance
Single-operator consistency represents the primary baseline of physical measurement stability. In a controlled facility meeting ISO 139 standard atmospheric conditions of 20 ± 2 degrees Celsius and 65 ± 4 percent relative humidity, a technician cutting specimens parallel to the warp line introduces minimal angular deviation. Moisture shifts tensile response.
The repeatability standard deviation, denoted as sr, quantifies this internal dispersion. The repeatability limit r equals 1.960 multiplied by the square root of two and multiplied by sr, which simplifies to approximately 2.8 multiplied by sr. Two single test determinations conducted within one laboratory on identical materials differ by more than r only five percent of the time.
Calculating this boundary demands rigorous specimen handling protocols. ASTM D2904 dictates the collection of replicate readings from homogeneous material segments to prevent process drift from inflating the calculated variance. When an operator cuts twenty specimens across the usable width of a finished woven textile, edge-to-center tension variations during wet finishing often introduce systematic lateral gradients.
Technicians isolate test equipment variability from processing artifacts by randomizing the specimen assignment order. Technicians calculate repeatability directly from these duplicate trials within a single shift.
Reproducibility across Commercial Testing Laboratories
Commercial transactions encounter substantial friction when test specimens move across independent testing houses. Even when accredited under ISO/IEC 17025, two commercial facilities testing specimens from the same master roll produce differing mean values. Differences in jaw grip face hardness, pneumatic clamping pressure, crosshead speed calibration, and local relative humidity cycles generate between-laboratory variance, denoted as sL2.
The total reproducibility variance, sR2, represents the sum of the repeatability variance sr2 and the between-laboratory variance sL2.
The reproducibility limit R equals 2.8 multiplied by sR. This metric establishes the maximum difference expected between two independent single determinations generated by different laboratories on identical material lots at the 95 percent probability level. When testing laboratories evaluate heavy woven twills under ISO 13934-1, between-laboratory standard deviations regularly exceed single-operator figures by sixty to one hundred percent.
Importers referencing strict rejection limits without accommodating reproducibility boundaries expose their supply lines to unrecoverable testing disputes.
Jaw
Clamping mechanics dictate the reliability of mechanical textile testing data. In tensile, seam slippage, and tear evaluations, the interface between the pneumatic grip faces and the textile specimen introduces mechanical distortion. Grip friction distorts rupture readings.
When an operator places a strip of high-tenacity polyester cloth into smooth flat jaws, compressive stress concentrates directly along the front clamp line. If clamping pressure remains insufficient, the specimen slips outward as crosshead displacement increases, producing artificial elongation plateaus and depressed peak load recordings. Jaws pinch fragile yarn crowns.
Applying extreme clamping force generates a secondary failure mode known as jaw breaks. High contact pressure shears individual yarn filaments at the metal contact boundary, causing premature tensile failure below true ultimate strength. ASTM D5034 requires the elimination of any test result where the specimen ruptures within 5 millimeters of the jaw edge if that value falls below the minimum specification limit.
The design of the grip system directly influences the calculated experimental variance. Higher pressures cause premature rupture. Laboratories selecting inappropriate jaw faces inflate the within-laboratory standard deviation, skewing calculated precision limits.
| Grip Geometry | Clamping Mechanism | Target Substrate | Predominant Failure Mode | Observed Coefficient of Variation |
|---|---|---|---|---|
| Flat Metallic Faces (25 x 25 mm) | Manual Screw Thread | Lightweight Cotton Voile | Specimen Slippage | 8.4 Percent |
| Serrated Hardened Steel | Pneumatic Piston (6 bar) | Heavyweight Canvas (450 gsm) | Contact Line Shearing | 6.2 Percent |
| Rubber-Coated Polyurethane | Pneumatic Piston (5 bar) | Continuous Filament Nylon Taffeta | Normal Mid-Gauge Break | 3.1 Percent |
| Wave-Form Interlocking Jaws | Hydraulic Clamp (8 bar) | Industrial Webbing and Aramid Belts | Shoulder Fiber Pullout | 4.5 Percent |
Does Specimen Slippage Invalidate Tensile Replicates?
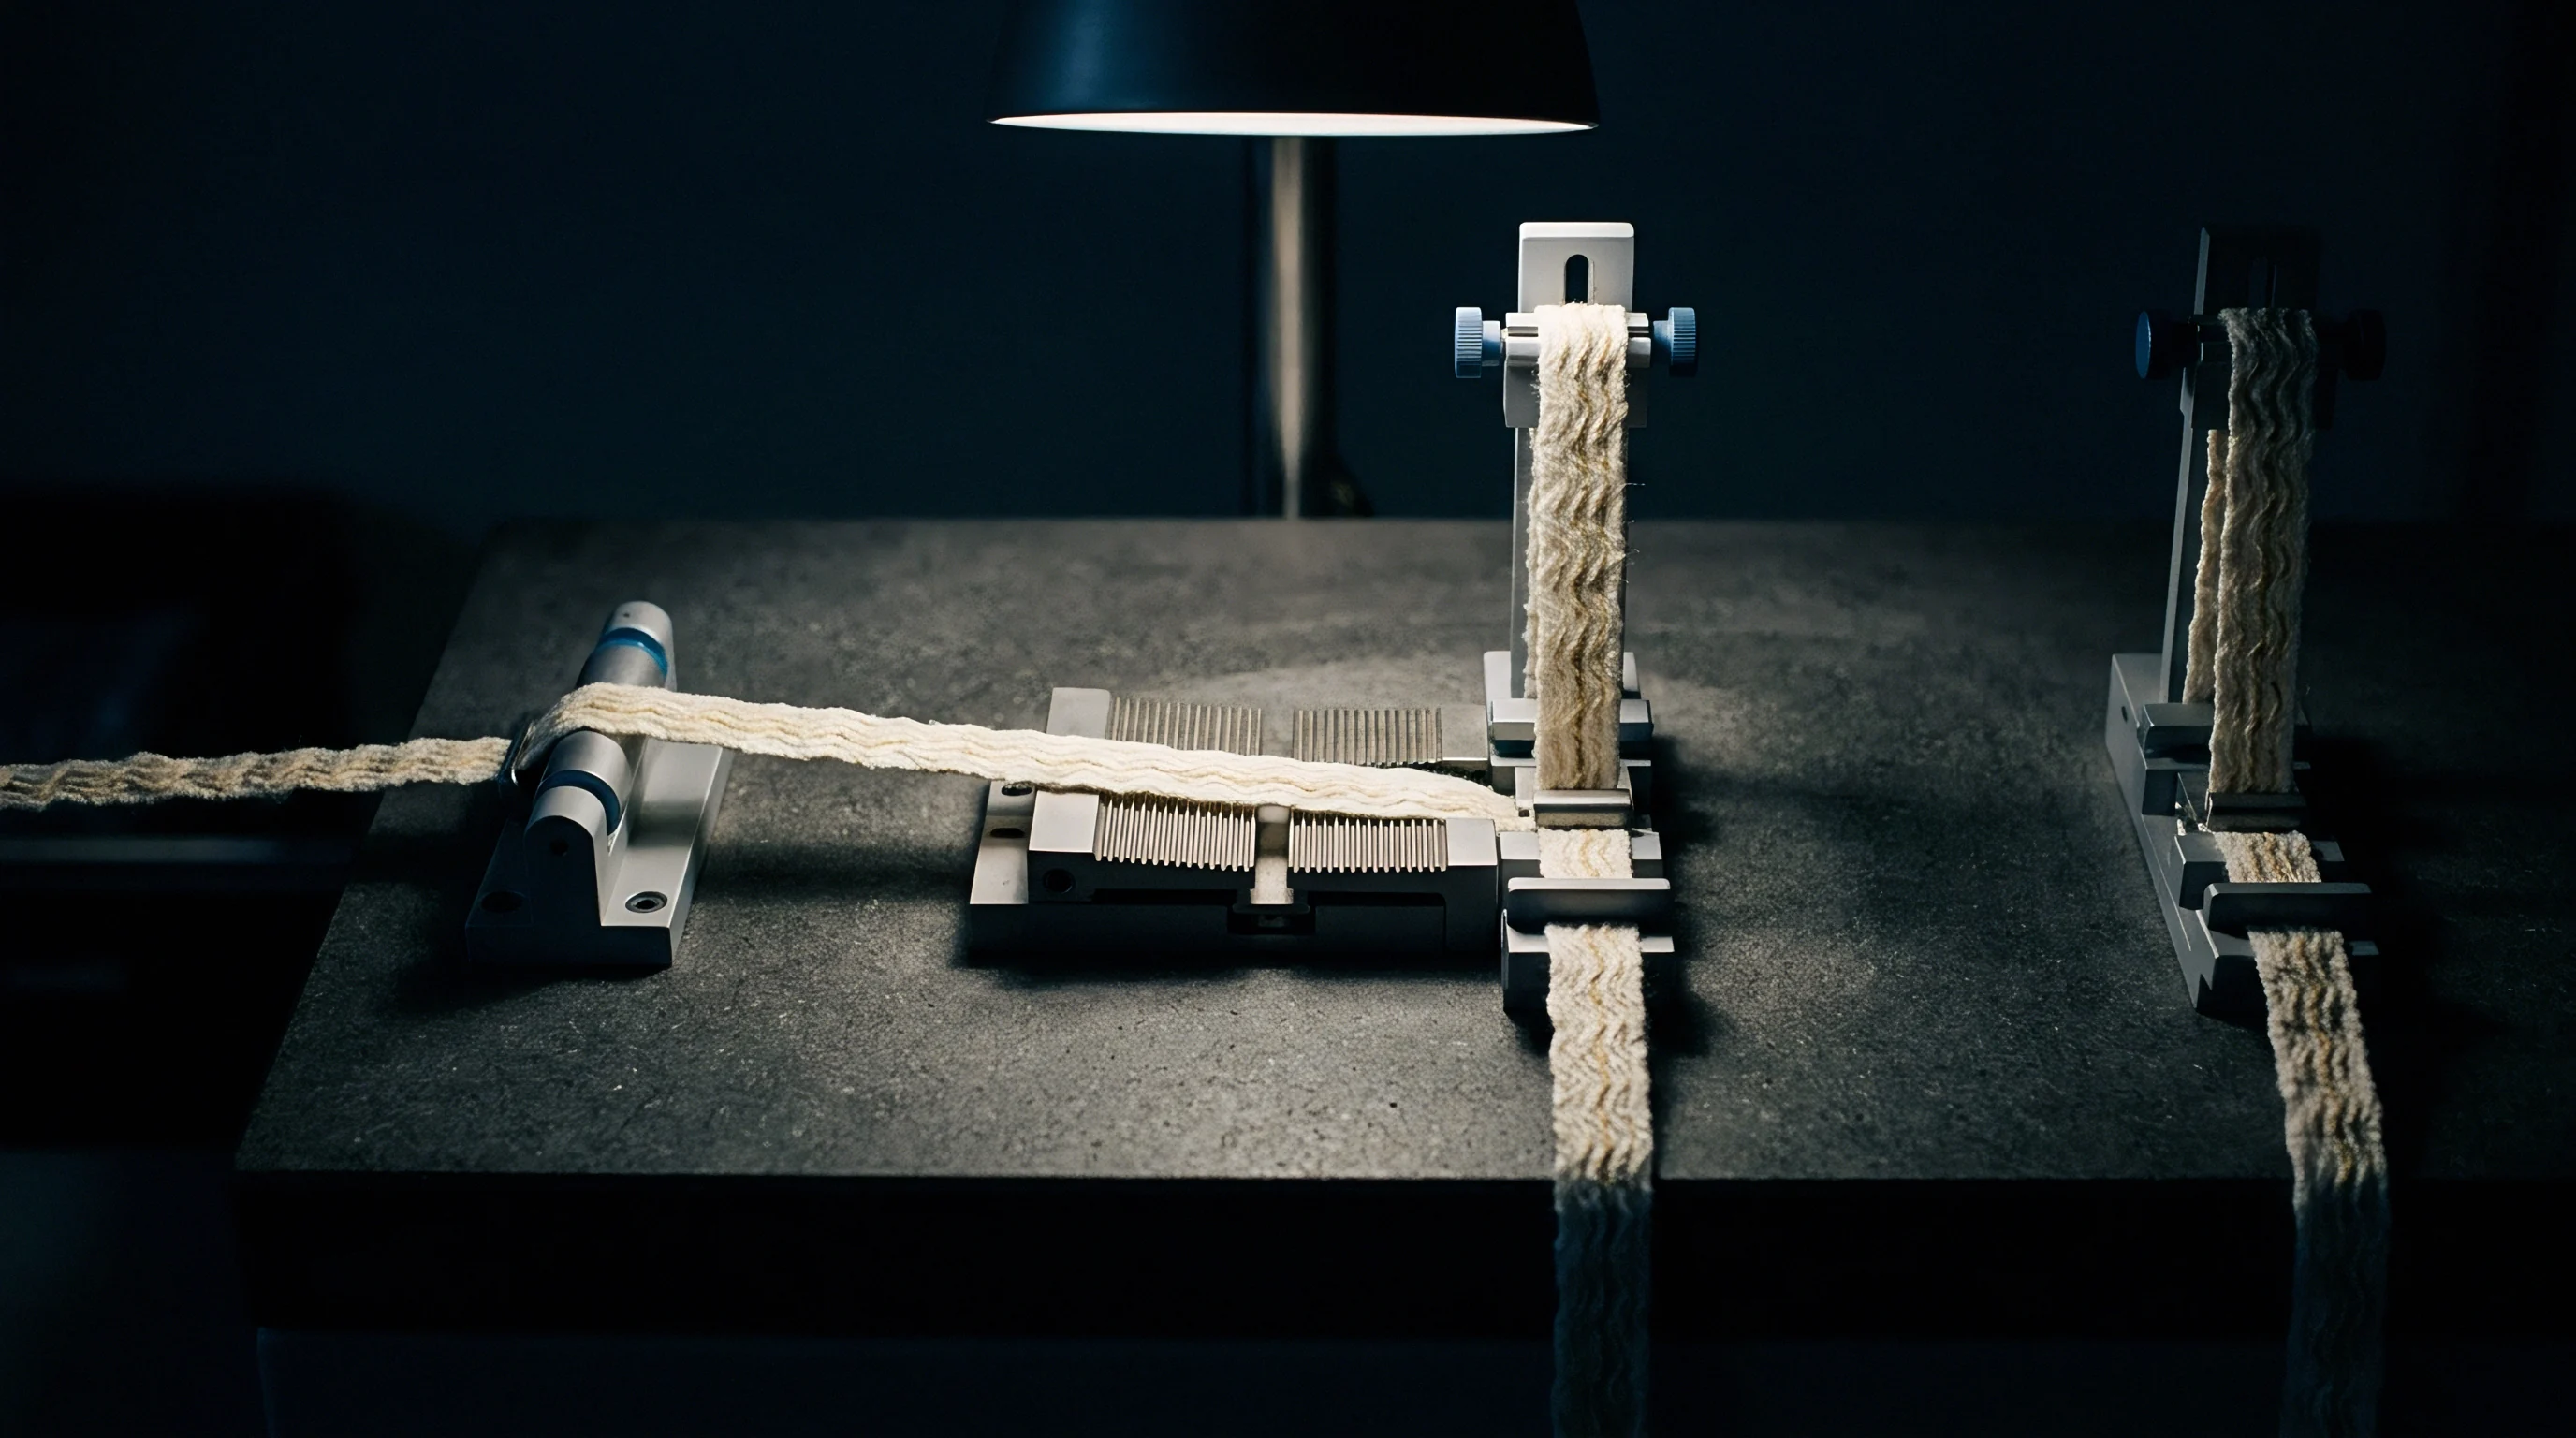
Specimens slip during extension. When internal displacement occurs within the jaw faces, the recorded stress-strain curve exhibits intermittent force drops and extended elongation values. This movement distorts the calculated modulus and inflates specimen variance.
Technicians identify slippage by marking a reference line across the specimen at the jaw face with an indelible marker. Any displacement of this line away from the grip boundary during tensile extension confirms mechanical movement, requiring the rejection of that specific test repetition.
Systematic slippage invalidates precision models constructed under ASTM D2905. The mathematical formulas governing specimen allocation assume normally distributed test errors centered around true material performance. Slippage introduces a negative skew in breaking force and a positive skew in elongation, corrupting normal distribution assumptions.
Ensuring proper jaw face selection eliminates this mechanical error source before interlaboratory testing programs commence.

Clamp Pressure and Gauge Geometry Effects
Pneumatic clamping systems maintain consistent contact pressure throughout the loading cycle. As a woven textile elongates under uniaxial tension, transverse necking reduces material thickness between the jaw faces. Manual mechanical screw grips fail to compensate for this thickness reduction, resulting in progressive slippage at peak loads.
Pneumatic actuators supply constant pressure that follows material compression, preventing late-stage specimen release. Physical clamp configurations introduce measurable variance channels that influence testing stability:
- Capstan jaw extrusion occurs when high-modulus aramid yarns crush over curved snubbing surfaces, altering stress distribution across internal yarn bundles.
- Pneumatic face misalignment induces asymmetric shear vectors across parallel warp yarns during the initial displacement phase.
- Serration tooth shearing cuts through external filament layers of delicate synthetic weaves when closing pressure exceeds six bar.
The dyehouse manager claimed the pneumatic jaws pinched too tightly on the selvage edge during the morning shift, producing artificial breaks along the line of jaw contact.

Replicate
Specimen sample sizes directly dictate the confidence interval surrounding any reported laboratory mean. Testing a single specimen yields an unverified measurement that provides zero insight into batch dispersion. Testing fifty specimens from every roll imposes unviable labor and material destruction costs.
ASTM D2905 provides the mathematical procedure for calculating the exact number of test specimens required to achieve a predetermined allowable error at a specified probability level. The procedure balances testing expenditure against risk of commercial misclassification.
The calculation hinges on the student t-distribution and the anticipated coefficient of variation. Degrees of freedom dictate uncertainty. When historical production data establishes an ongoing estimate of within-lot dispersion, testing personnel calculate the necessary specimen count n through the standard formulation: n equals (t2 multiplied by s2) divided by E2, where s represents the sample standard deviation and E denotes the allowable error expressed in measurement units.
When expressing error as a percentage of the mean, the formula substitutes the coefficient of variation v for standard deviation: n equals (t2 multiplied by v2) divided by A2, where A represents the allowable variation expressed as a percentage of the lot average.
Five specimens yield an allowable error of four percent at ninety-five percent probability when the coefficient of variation remains below six percent.
Because the student t value depends on the degrees of freedom associated with n minus one, solving the equation requires an iterative process. Technicians assume an initial estimate of n, identify the corresponding two-tailed t value at the 95 percent confidence level, calculate the revised n, and repeat until the integer converges. Neglecting this iterative refinement underestimates required testing volumes when working with highly variable textile substrates.
Specimen Allocation under ASTM D2905 Procedures
Textile specifications frequently mandate an arbitrary sample size of five specimens without validating whether five tests satisfy statistical confidence requirements. Standard deviations govern trade disputes. For uniform continuous filament synthetic fabrics, five specimens often suffice to secure an allowable error below three percent.
For coarse woolen tweeds, open knits, or nonwoven geotextiles, five specimens generate an allowable error exceeding ten percent of the mean value. A structured calculation sequence establishes defensible specimen numbers across diverse fabric categories:
- Target precision definition fixes the allowable variation band at a specific percentage of the mean, typically set between three and five percent for acceptance testing.
- Variance estimate retrieval draws historical standard deviations from continuous production charts or qualified preliminary trials of at least ten specimens.
- Student t selection establishes degrees of freedom based on preliminary test series at the 95 percent two-sided probability threshold.
- Sample calculation execution determines specimen counts through iterative squaring of variance ratios until the integer output stabilizes.

Worked Derivation of Tensile Sample Sizes
Evaluating a commercial woven twill intended for military protective apparel demonstrates the specimen allocation procedure. Assume a batch of 240 gsm nylon-cotton blend ripstop cloth requires warp grab breaking force verification under ASTM D5034. Historical laboratory records from ten preliminary rolls show a pooled within-laboratory coefficient of variation v of 5.8 percent.
The commercial purchasing specification dictates an allowable variation A of 4.0 percent of the true average breaking strength at a 95 percent probability level.
In the first iteration, assume n equals 8 specimens. The degrees of freedom equal 7, yielding a two-tailed Student t value of 2.365 at the 0.05 significance level. Squaring t yields 5.593.
Squaring the coefficient of variation v yields 33.64. The product of t2 and v2 equals 188.15. Squaring the allowable variation A of 4.0 yields 16.0.
Dividing 188.15 by 16.0 yields 11.76, which rounds up to 12 specimens.
In the second iteration, assume n equals 12 specimens. The degrees of freedom equal 11, yielding a revised two-tailed Student t value of 2.201. Squaring t yields 4.844.
Multiplying 4.844 by 33.64 yields 162.97. Dividing 162.97 by 16.0 yields 10.19, which rounds up to 11 specimens. In the third iteration with 10 degrees of freedom, t equals 2.228, yielding n equals 10.44, which confirms an operational sample size of 11 specimens.
Relying on a default five-specimen protocol on this cloth doubles the allowable uncertainty margin to approximately 6.5 percent.
| Substrate Classification | Test Parameter | Observed CV (Percent) | Allowable Error A = 3.0 % | Allowable Error A = 5.0 % | Allowable Error A = 8.0 % |
|---|---|---|---|---|---|
| Polyester Microfiber Pongee | Strip Tensile (ISO 13934-1) | 2.4 | 4 Specimens | 3 Specimens | 2 Specimens |
| Combed Cotton Ring-Spun Twill | Grab Breaking Force (ASTM D5034) | 4.2 | 10 Specimens | 5 Specimens | 3 Specimens |
| Viscose Plain Weave Sheeting | Tear Force (ASTM D1424) | 7.1 | 24 Specimens | 10 Specimens | 5 Specimens |
| Needle-Punched Geotextile | Trapezoid Tear (ASTM D5587) | 11.5 | 60 Specimens | 23 Specimens | 10 Specimens |
Higher yarn irregularity demands larger swatches from separate rolls.

Round
Validating precision statements for standard test methods requires coordinated interlaboratory trials across multiple independent commercial facilities. ASTM E691 and ISO 5725-2 govern the execution of these collaborative interlaboratory studies. In an interlaboratory program, an organizing laboratory prepares homogeneous fabric segments from identical production dye lots and distributes masked specimen packages to participating test facilities.
Outliers distort pooled variances. Each facility conducts a prescribed number of test repetitions under identical conditioning states, reporting raw determinations back to the coordinating biometrician.
Data validation begins by examining cell consistency across participating laboratories. The trial analyzes both within-laboratory consistency and between-laboratory consistency using Mandel h and k statistics. The Mandel h statistic measures between-laboratory consistency, identifying facilities whose mean values depart systematically from the grand average of all participating sites.
The Mandel k statistic measures within-laboratory consistency, highlighting facilities that report unusually elevated internal standard deviations compared to the pooled repeatability variance. Calibration certificates expire annually.
Clause eight of ISO 5725-6 assigns testing expenses to the purchaser whenever an independent laboratory confirms original lot conformity within the reproducibility limit.
When Mandel statistics exceed standard critical values at the 0.5 percent significance level, the coordinating team investigates potential operator error, environmental deviation, or equipment malfunction. Excluding problematic laboratories prevents artificial inflation of the published precision limit. The resulting cleaned data yields the formal repeatability and reproducibility statements published in test method annexes.
Interlaboratory Program Design under ASTM E691
ASTM E691 mandates strict minimum participation levels to guarantee statistical validity. The standard specifies a minimum of six laboratories, four distinct materials representing the functional range of the test method, and three valid test replicates per cell. Incorporating eight to ten laboratories provides redundancy against data attrition caused by facility non-compliance.
Interlaboratory project execution enforces strict administrative steps:
- Homogeneity testing validation verifies container integrity before shipment by executing ten preliminary tests across random roll sections.
- Atmospheric conditioning verification enforces twenty degrees Celsius across test racks using calibrated data loggers inside each participating chamber.
- Blind duplicate coding conceals specimen identity during cross-laboratory dispatch to eliminate expectations of material performance.
Outlier Rejection via Cochran and Grubbs Metrics
Statistical outlier rejection follows rigid decision trees under ISO 5725-2. Prior to pooling variances, data cells undergo the Cochran test to detect extreme within-laboratory variance. The Cochran statistic C equals the maximum cell variance divided by the sum of all cell variances across participating sites.
If C exceeds the critical threshold at the one percent level, the laboratory cell is classified as a statistical outlier and omitted from the repeatability variance calculation.
Following variance screening, cell averages undergo the Grubbs test to identify extreme systematic bias. The Grubbs test calculates the absolute deviation of the suspected laboratory mean from the overall consensus mean, divided by the pooled standard deviation of laboratory averages. Grubbs tests evaluate both single extreme values and pairs of outlying laboratories.
Cells identified as outliers at the one percent significance level are dropped from reproducibility determinations.
What Governs Retesting When Interlaboratory Variances Diverge?
Trade contracts frequently mandate retesting protocols when initial commercial laboratory determinations conflict. If an independent import inspection laboratory reports a breaking strength failing minimum specifications while the mill laboratory reports compliance, an immediate commercial dispute arises. ASTM D2906 establishes that neither single value should dictate acceptance.
The observed discrepancy must be evaluated against the critical difference calculated for the two testing laboratories.
The critical difference CD between two laboratory averages calculated from n1 and n2 specimens equals 1.960 multiplied by the square root of two, multiplied by the pooled between-laboratory standard deviation. If the difference between the buyer laboratory mean and the seller laboratory mean remains less than the CD value, the two test results exhibit mutual agreement within the expected boundaries of reproducibility variance. The invoice moves toward settlement without financial penalties.
If the difference exceeds CD, systematic laboratory bias exists, requiring reference testing by a third neutral laboratory accredited under ISO/IEC 17025.
Whether regional atmospheric swings introduce systematic shifts between coastal and mountain testing stations remains an unverified variable across international shipment lanes.
Settlement
Commercial acceptance sampling models in cross-border trade convert physical test dispersion into financial risk allocation. When an offshore converter supplies 50,000 meters of technical outerwear fabric, the importer cannot test every roll. Acceptance depends on cutting composite swatch packages from a designated lot fraction.
Cotton lots display inherent heterogeneity. If the contract defines a hard minimum threshold for tearing resistance without acknowledging test method uncertainty, normal statistical variance inevitably generates false rejections.
The margin settles the invoice. Contract specifications written by sophisticated purchasing desks incorporate statistical precision boundaries directly into quality clauses. When specifying compliance under ISO 13934-2, the contract establishes whether published test limits represent producer risk or consumer risk boundaries.
Producer risk alpha denotes the probability that a conforming material lot will be rejected due to a negative random test error. Consumer risk beta denotes the probability that a non-conforming lot will clear acceptance because of a positive random measurement deviation. Buyers absorb border detention fees.
Agreed tolerance bands between trading counterparties widen as specimen tensile variance expands.
Applying the critical difference formulation eliminates arbitrary commercial disputes. When contract language identifies the published precision table of the reference standard as the governing threshold for laboratory arbitration, neither counterparty can cancel purchase orders based on minor analytical variances. The legal dispute dissolves into an empirical calculation of probability bands.
Arbitration Clauses Grounded in Precision Thresholds
Effective procurement agreements specify an exact mechanism for resolving discrepancies between exporter certificate of analysis data and destination customs inspection reports. The contract explicitly identifies the neutral referee facility, the required sample size for confirmatory runs, and the financial liability allocation for testing fees. Incorporating standard precision limits ensures commercial stability:
| Test Method Standard | Physical Property | Specimens per Facility (n) | Single-Laboratory CD | Multi-Laboratory CD |
|---|---|---|---|---|
| ASTM D5034 Grab Test | Breaking Force, Warp | 5 Specimens | 6.2 Percent of Mean | 11.4 Percent of Mean |
| ASTM D5034 Grab Test | Breaking Force, Filling | 5 Specimens | 7.1 Percent of Mean | 12.8 Percent of Mean |
| ISO 13934-1 Strip Test | Maximum Force, Warp | 5 Specimens | 4.8 Percent of Mean | 8.6 Percent of Mean |
| ASTM D1424 Elmendorf Tear | Tear Force, Warp | 5 Specimens | 12.4 Percent of Mean | 21.2 Percent of Mean |
| ISO 13937-1 Ballistic Tear | Tear Force, Across | 5 Specimens | 13.8 Percent of Mean | 23.5 Percent of Mean |
| Critical differences calculated under two-tailed Gaussian distribution where CD equals 1.960 multiplied by square root of two and pooled standard error. | ||||

Commercial Rejection Boundaries on Physical Test Reports
When destination testing houses report values below contractual minimums, the discrepancy frequently falls entirely within the multi-laboratory critical difference corridor. Consider a high-visibility canvas specified at 1200 newtons warp tensile strength under ISO 13934-1. The manufacturer reports an export batch mean of 1240 newtons across five specimens.
The destination port laboratory reports a mean of 1150 newtons across five specimens. The numerical deficit equals 90 newtons, which represents 7.5 percent of the specified baseline.
Consulting the multi-laboratory critical difference table shows an allowable interlaboratory corridor of 8.6 percent for that material category. Because the observed 7.5 percent gap sits inside the 8.6 percent threshold, the two laboratories do not exhibit statistically significant divergence at the 95 percent probability level. The physical material complies with the purchase specification within the certified precision limits of the standard method.
Arbitration section 14.2 of the standard trade terms binds both parties to the reproducibility limit of ISO 13934-1, eliminating unilateral batch cancellations when independent laboratory means fall inside the mutual uncertainty corridor.