Statistical Lot Acceptance Protocols for Edge to Middle Textile Sampling
Stratified edge to middle textile sampling eliminates Consumer Risk by capturing process chemical gradients that simple random attribute inspection hides.


Gradient
Thermal imbalances across industrial tenter frames and nip-pressure variations across padding mangles introduce systematic physical and chemical non-uniformities across the width of finished textile webs. Continuous padded liquors pass through squeeze rollers during wet processing, intended to deliver even wet pickup from selvedge to selvedge. Hydraulic pressure on long mangle rolls causes roll deflection, resulting in higher nip compression at the center than at the edges.
This deflection forces a higher percentage of liquid add-on along the outer margins of the fabric. When moist fabric enters the multi-zone heating chambers of a stenter, hot air nozzles direct thermal energy onto both surfaces. Outer edges cool faster through ambient heat exchange with frame walls, while simultaneous drying air blasts induce rapid moisture evaporation at exposed margins.
Cross-web heat variation ultimately drives resin migration.
Water-soluble auxiliaries, unfixed reactive dyes, cross-linking glyoxal resins, fluorinated durable water repellents, and flame-retardant salts naturally move toward areas of highest evaporation. As water vaporizes from the fabric surface, liquid inside the yarn core moves outward along capillary pathways. Dissolved solutes follow this flow, building up at the evaporation front.
Because tenter chains clip or pin fabric edges near heated rail structures, the margins see localized thermal spikes and intense convective evaporation. This creates a much higher chemical density near the selvedges. Consequently, free formaldehyde content from dimethyloldihydroxyethyleneurea resins often measures thirty to seventy percent higher within ten centimeters of the selvedge than along the center line of the same bolt.
As drying fronts pull soluble low-molecular-weight compounds outward into the outer third of the textile width, they establish a distinct edge-to-middle concentration profile. Inspecting tenter exit zones reveals temperature differentials of six degrees Celsius across three meters, driving clear resin concentration gradients. Coloration density follows the exact same physics, creating listing defects where shade depth varies systematically from edge to center.
Functional finishes behave identically: hydrophobic fluorocarbon treatments, antimony trioxide synergists, and organophosphorus compounds partition unevenly across the weave. Standard laboratory certification testing performed on a single swatch cut from an easily accessible edge misses the concentration profile across the rest of the roll.
| Analyte Parameter | Left Edge (0 to 15 cm) | Mid-Left (15 to 45 cm) | Center (45 to 115 cm) | Right Edge (145 to 160 cm) | Test Standard |
|---|---|---|---|---|---|
| Free Formaldehyde (mg/kg) | 88.4 | 54.2 | 41.0 | 92.1 | EN ISO 14184-1 |
| Extractable Lead (mg/kg) | 1.85 | 1.12 | 0.85 | 1.92 | EN 16711-2 |
| Total Fluorine / Organic (mg/kg) | 420 | 310 | 260 | 445 | EN 17681-1 |
| Alkylphenol Ethoxylates (mg/kg) | 112 | 84 | 62 | 118 | EN ISO 18254-1 |
| pH of Aqueous Extract | 5.2 | 6.1 | 6.5 | 5.1 | EN ISO 3071 |
Tension variations during batching further worsen chemical non-uniformity across the roll. High-speed winders apply uneven radial forces across the package diameter. Because selvedges are often thicker than the body of the fabric ~ owing to specialized weave structures or dense pin-hole tracks ~ they build up higher pressure on the winding core.
This pressure forces residual moisture laterally outward toward the roll faces before curing is complete. If rolls sit damp before entering curing ovens, moisture redistribution carries active chemical agents along radial and axial pressure lines, causing edge swatches to fail first.
Thermal degradation of sensitive organic compounds mirrors these local temperature spikes inside the drying machinery. Organotins used as polyurethane catalysts, alkylphenol ethoxylates operating as surfactant emulsifiers, and azo dyestuffs capable of cleaving into carcinogenic aromatic amines suffer varying degrees of thermal stress based on cross-web position. Outer zones exposed to direct radiation from burner tubes hit higher peak temperatures than central zones shaded by steam clouds.
While dyers adjust exhaust air dampers to compensate for shade variations, cross-machine drying bias remains an inherent mechanical reality of continuous processing equipment.
Single-point swatches extracted from exposed outer selvedges reflect localized evaporation peaks rather than the true chemical average of the textile lot.
When an incoming lot fails regulatory testing at a buyer laboratory, disputes frequently arise over whether sampling occurred outside the usable width of the fabric. Edge cuts often consist of trim waste, pinning damage, and drying artifacts intended to be removed during garment cutting, while compliant fabric may lie entirely within the central body of the roll. However, unless a purchase contract explicitly defines the cut-line boundary and mandates edge-trim removal before delivery, standard regulatory surveillance pulls test specimens directly from accessible edges, holding the entire shipped web to statutory limits.
Bolt
Extracting physical specimens from finished fabric rolls requires geometric precision to isolate systematic cross-web gradients from random length-wise variation. Standard sampling guidelines like ASTM D3774 and ISO 2219 provide basic frameworks for measuring width and length, but they lack explicit instructions for trace chemical analysis. Pulling a swatch solely from the outermost wrap introduces atmospheric contamination and oxidation bias, as surface chemistry is continuously altered by exposure to ambient air, humidity, light, and packaging materials.
Reliable sampling protocols must cut past these protective outer wraps and reach the stabilized interior of the roll.
Cross-web harvesting strategies divide fabric into distinct physical zones along the transverse axis: an edge zone covering the outer ten percent of usable width next to each selvedge, and a middle zone spanning the central sixty percent. Sampling both zones allows technicians to plot a comparative profile that pinpoints chemical migration. Swatch geometry needs to stay uniform ~ square cuts measuring ten by ten centimeters prevent area-calculation errors during mass-per-unit-area and extraction testing.
These edge cuts must exclude the actual woven selvedge trim, since dense structural yarns hold excess finish chemicals that distort readings for the main fabric body.
Sampling depth along the longitudinal axis requires equal control. Fabric properties vary from the outer lap down to the cardboard core because of tension gradients and heat retained during cooling. In fact, core layers stay hot long after leaving stenter heat-setting zones, accelerating localized breakdown of chemical finishes.
Technicians should bypass the first three complete revolutions of a roll to avoid handling contamination and surface exposure artifacts. Comparing parallel swatches taken from outer laps and deep core layers reveals whether chemical non-compliance is confined to specific finishing passes or spans the entire production lot.
The sequence below details the multi-point physical harvesting protocol for cross-web chemical compliance verification.
- Discard the outermost three full wraps of fabric from the selected bolt to eliminate surface contamination and environmental aging effects.
- Unroll the fabric flat onto a neutral, cleaned stainless steel inspection table free from silicone lubricants or detergent residues.
- Measure total usable fabric width between selvedge pin-lines using a calibrated steel rule to determine target sampling locations.
- Cut a continuous full-width strip measuring twenty centimeters in length along the fill yarn line using clean stainless steel shears.
- Section the full-width strip into five discrete swatches: Left Edge, Left Center, Mid Center, Right Center, and Right Edge.
- Place each cut swatch immediately into an individual, pre-cleaned borosilicate glass container sealed with a PTFE-lined cap to prevent volatile organic cross-contamination.
- Label each specimen container with bolt identification, precise lateral position coordinates, timestamp, and operator credentials.
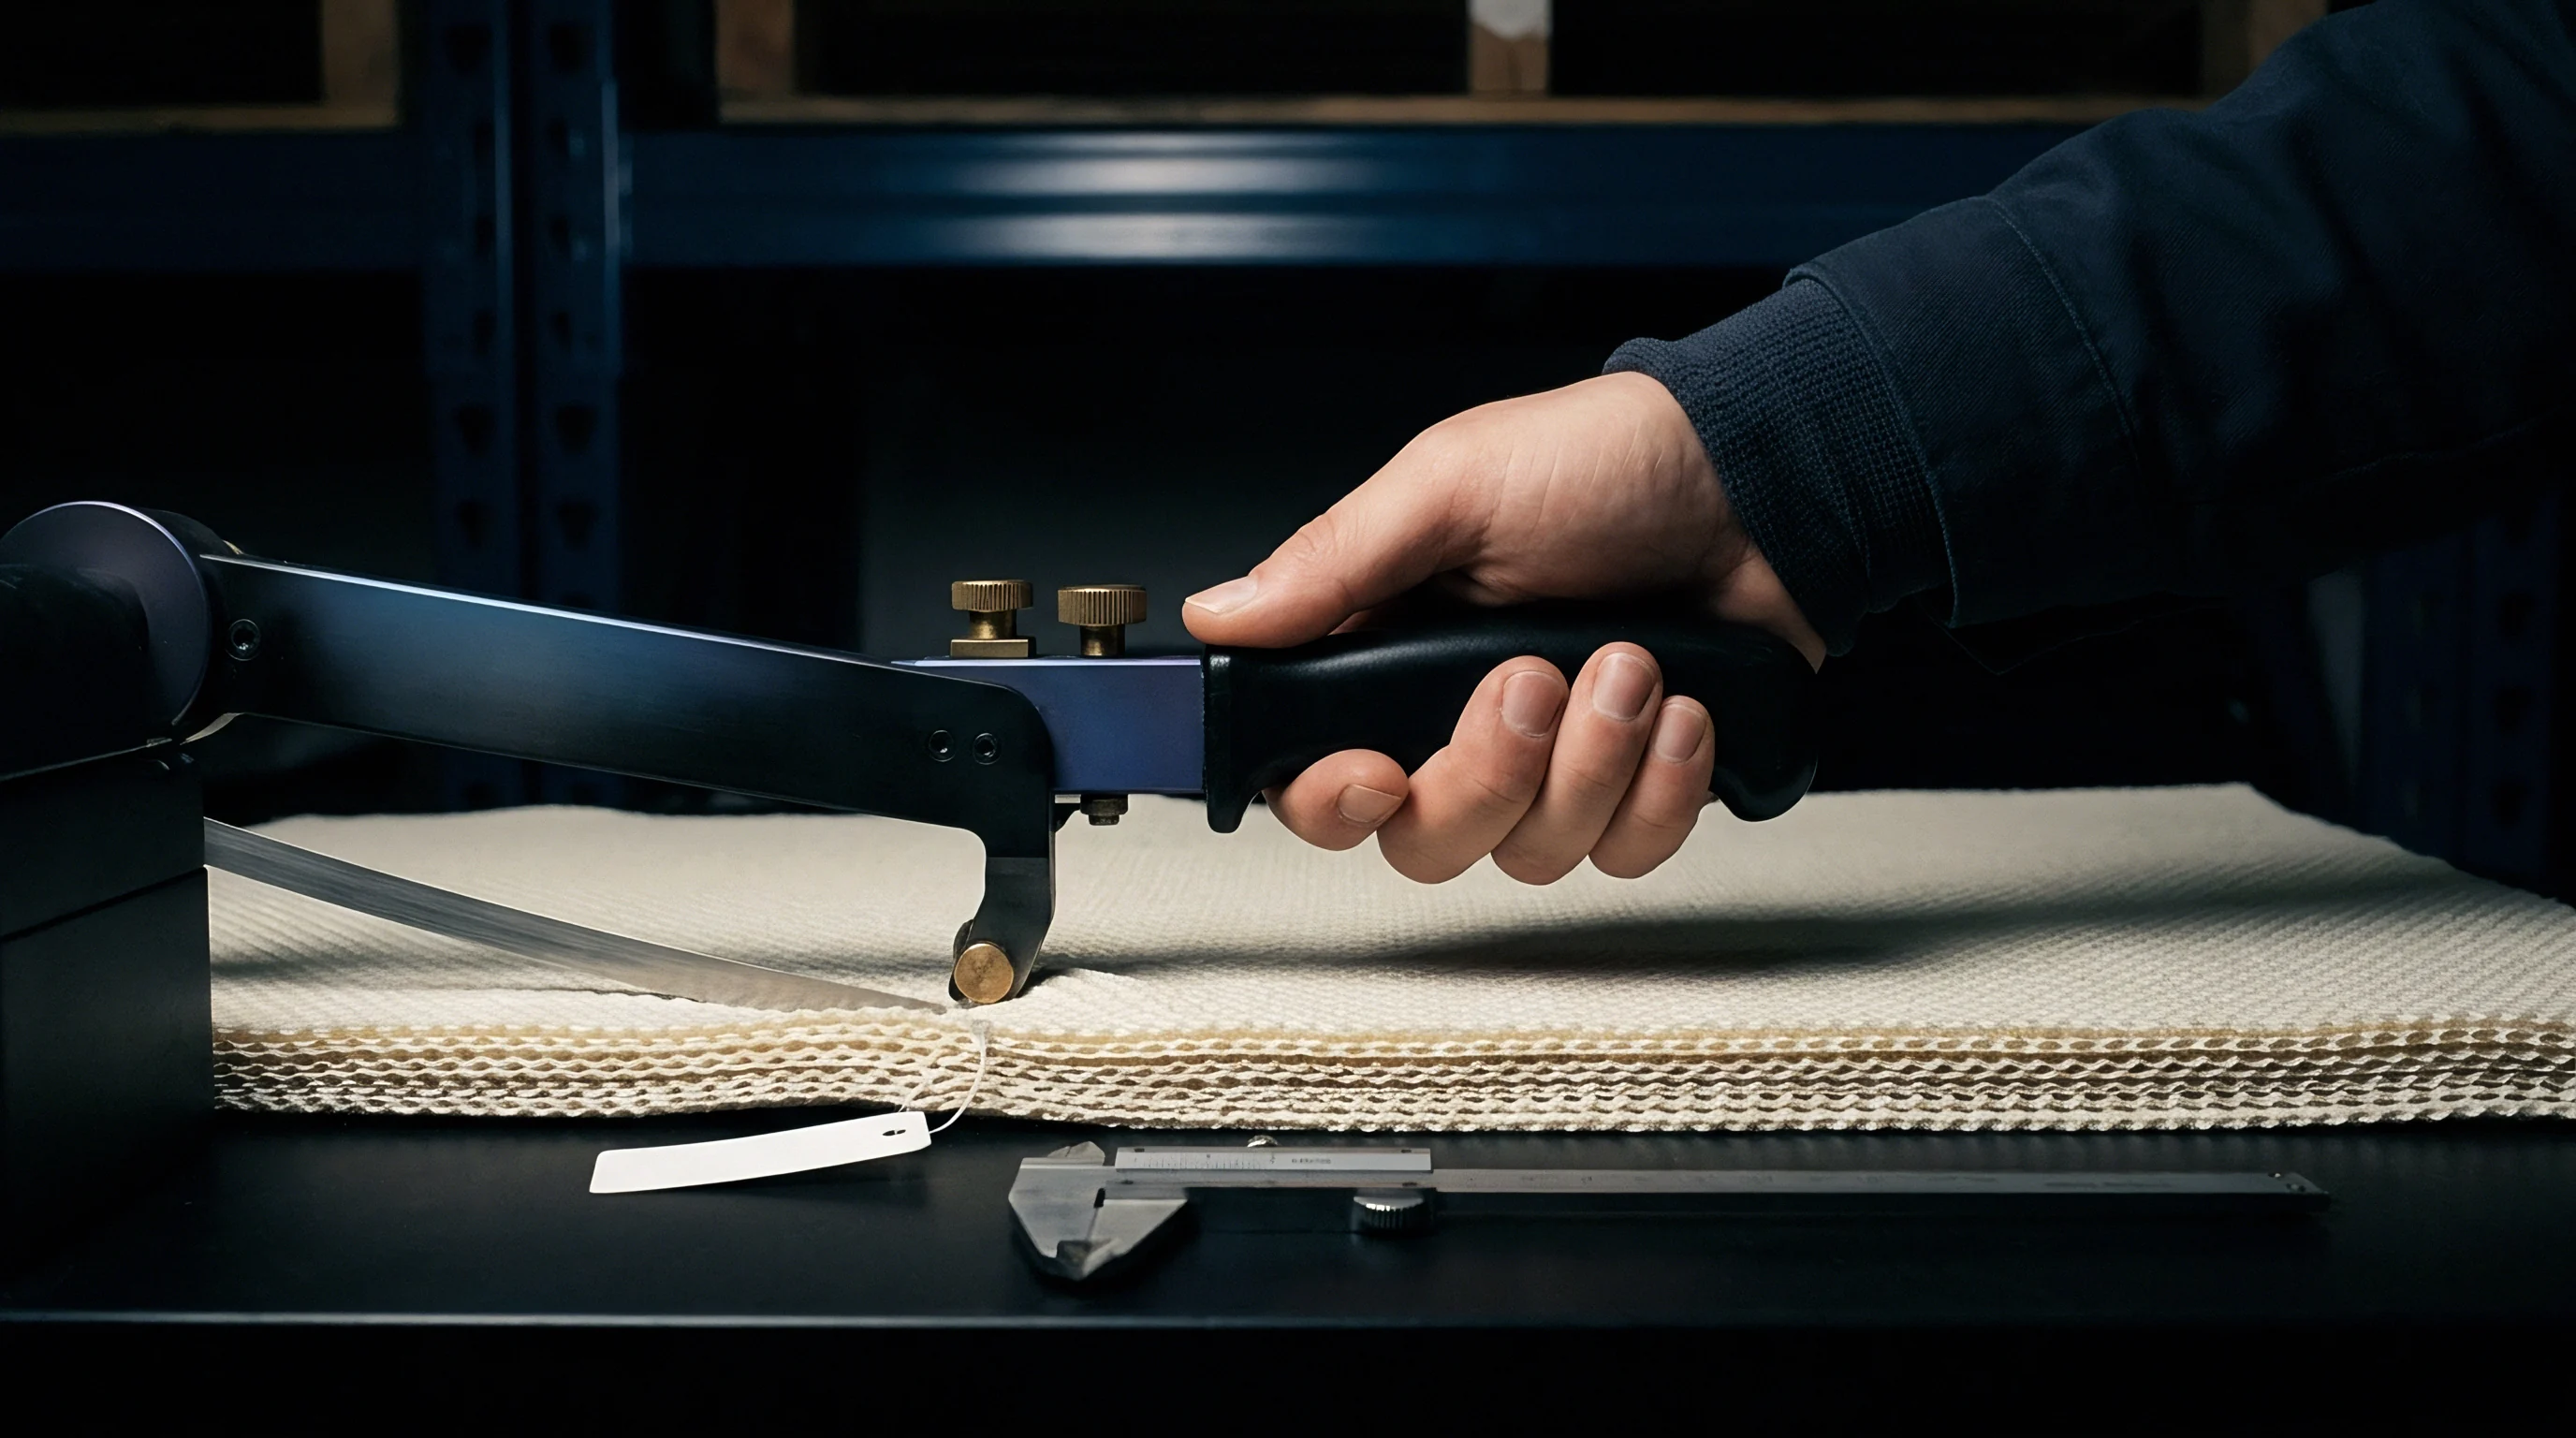
Nip pressure alters wet pickup, so multi-point physical cutting is necessary to separate structural variation from process-induced chemical buildup. Cutting speed also matters when evaluating rolls for volatile analytes like free formaldehyde or residual solvents like dimethylformamide. High-speed mechanical blades generate friction heat that vaporizes target volatile compounds before swatches even reach analytical balances.
Technicians must use cold-cutting hand tools and seal specimens into inert vessels within sixty seconds of harvesting to preserve analytical integrity.
Handling physical swatches requires strict cleanroom discipline, even on the mill floor. Gloves containing phthalate plasticizers or silicone oil residues readily transfer organochlorine and plasticizer contaminants onto the specimen matrix. Operators should wear clean, powder-free nitrile gloves during all cutting and packaging steps.
Table surfaces must be covered with fresh aluminum foil or unbleached, untreated virgin kraft paper replaced between every sampled roll. Without these precautions, cross-contamination between high-finish utility fabrics and sensitive organic rolls happens quickly on shared tables.
Analytical accuracy depends entirely on harvesting specimens from stabilized internal roll wraps using temperature-neutral tools and inert containment.
A practical rule governs acceptance testing across commercial shipments: any chemical compliance parameter that fails on an edge swatch will trigger regulatory rejection, regardless of how clean the central fabric body tests.


Attribute
Acceptance sampling protocols in textile QA rely heavily on standard attribute inspection systems like ISO 2859-1 and ANSI/ASQ Z1.4. These schemes assess lot quality by classifying individual sample units as conforming or non-conforming against set tolerance limits. This approach assumes defects occur randomly across the lot according to binomial or hypergeometric distributions.
Under classical random sampling theory, every square meter of fabric carries an equal probability of selection, allowing single swatches to represent overall lot quality.
Systematic chemical non-uniformity invalidates these classical attribute assumptions. When process physics force restricted substances ~ such as heavy metals, phthalates, or azo dyes ~ to concentrate along fabric selvedges, defect distribution is no longer random. This spatial clustering creates a non-random defect layout.
Consequently, standard random sampling tables under ISO 2859-1 Level II normal inspection end up underpowered, yielding falsely optimistic acceptance probabilities for lots carrying critical edge defects and masking spatial drift.
When chemical non-compliance clusters along spatial gradients, calculating the true lot defect proportion requires spatial probability adjustments. Attribute acceptance criteria using an Acceptable Quality Limit of 1.0 percent assume defects are dispersed uniformly. If edge zones representing twenty percent of total fabric area carry a one hundred percent non-compliance rate while central zones pass, the actual lot defect rate is twenty percent.
A standard attribute plan pulling five random rolls from a lot of fifty will completely miss this localized failure if swatches are taken exclusively from center sections.

How Do Non-Normal Chemical Distributions Impact Sampling Risks?
Parametric evaluation using ISO 3951-1 variables sampling offers higher sensitivity than attribute methods by measuring absolute numerical values against specification limits. However, variables models assume test results follow a standard normal Gaussian distribution. Chemical concentration data from edge-to-middle textile sampling exhibit heavy right-skewness and bimodal curves, as peak values clustered at selvedges form a distinct mode separate from the lower mean of central fabric zones.
Applying standard Gaussian variables formulas to this bimodal data miscalculates standard deviations, artificially skewing process capability metrics.
Operating Characteristic curves reveal how acceptance plans actually perform under skewed chemical distributions. Producer’s Risk is the probability that a compliant lot gets rejected because of unrepresentative edge sampling. Consumer’s Risk is the probability that a non-compliant lot with toxic edge zones passes testing because swatches came only from compliant center sections.
Standard ISO 2859-1 plans keep Consumer’s Risk around five to ten percent for random defects, but that risk surges past forty percent when non-compliance follows spatial edge-to-middle patterns.
Because standard attribute plans assume defects are independently distributed, statistical models must account for spatial autocorrelation across the web. Physical measurements taken near one another naturally correlate. Addressing this autocorrelation requires moving from simple random selection to stratified random sampling models.
By dividing each fabric roll into distinct spatial strata ~ Left Edge, Center, Right Edge ~ and treating each stratum as its own sub-population, QA protocols calculate true variance components and eliminate sampling bias.
Spatial clustering of restricted chemical residues invalidates simple random binomial models, driving Consumer Risk above forty percent in unstratified lot inspections.
Does the statistical framework account for non-Gaussian bimodal distributions when setting lot acceptance thresholds, or does the compliance program rely on unadjusted attribute math that systematically misprices border detention risk?

Scheme
Designing a statistically sound lot acceptance protocol for edge-to-middle textile sampling requires explicit stratification equations integrated into ISO 2859-1 or ISO 3951-1 frameworks. Stratified sampling partitions a fabric roll of total width W into K distinct longitudinal strata. For standard web processing, K=3 provides optimal resolution: Stratum 1 represents the Left Edge (0 le x
The estimated mean chemical concentration $hatμ across the lot is computed using the weighted sum of individual stratum sample means:
hatμ = sumk=1K wk barYk
where barYk is the sample mean of analyte concentration measured in stratum k. The variance of the stratified mean estimator V(hatμ) depends directly on the sample size nk allocated to each stratum and the internal stratum variance sk2:
V(hatμ) = sumk=1K fracwk2 sk2nk
Neyman optimal sample allocation minimizes the variance of the estimated lot mean for a fixed total sample size n. The allocated sample size nk for stratum k is calculated as:
nk = n left( fracwk sksumj=1K wj sj right)
Because selvedge zones exhibit significantly higher variance s12, s32 due to turbulent drying and edge migration, Neyman allocation assigns a higher proportion of physical test swatches to edge strata than simple area weighting alone dictates. Custom lab procedures often test single cuts, but systematic edge sampling reduces estimator variance compared to simple random sampling, sharpening Operating Characteristic curves.
| Sampling Scheme | Total Swatches (n) | Edge Swatches (n1, n3) | Center Swatches (n2) | Producer Risk (α) | Consumer Risk (β) | Lot Accept/Reject Result |
|---|---|---|---|---|---|---|
| Simple Random (Unadjusted) | 10 | 1 | 9 | 0.02 | 0.48 | Pass (False Accept) |
| Proportional Stratified | 10 | 2 | 8 | 0.04 | 0.22 | Pass (False Accept) |
| Neyman Optimal Stratified | 10 | 6 | 4 | 0.05 | 0.03 | Reject (True Reject) |
| Composite Edge-Center Scheme | 10 | 5 (Pooled) | 5 (Pooled) | 0.03 | 0.01 | Reject (True Reject) |
A real-world scenario highlights the mathematical advantage of stratified sampling. Consider a mill lot of 10,000 meters of dyed cotton fabric delivered across 100 rolls, where regulatory testing limits free formaldehyde to 75 mg/kg under EN ISO 14184-1 for direct skin contact. Process non-uniformity produces a true mean concentration of 95 mg/kg along fabric edges (s1 = 18 mg/kg) and 42 mg/kg across central zones (s2 = 6 mg/kg).
Under unstratified simple random sampling with n=10, there is a 48% probability (β = 0.48) of selecting zero or just one edge swatch. The resulting sample mean falls below 75 mg/kg, causing false acceptance of a non-compliant lot. Stratified cross-web swatches catch three lot rejections in cases where simple random sampling previously passed the batch.
Variables acceptance decision rules require comparing the upper quality statistic U against an acceptance constant k, derived from the non-central t-distribution for specified α and β risk thresholds:
U = fracL – hatμsqrtV(hatμ) ge k
where L is the statutory upper specification limit (e.g. 75 mg/kg). If $U
The list below details key operational failure modes when unstratified attribute protocols evaluate spatially variable textile lots.
- Unrepresented Edge Failure occurs when simple random sampling picks swatches exclusively from central zones, passing fabric that carries non-compliant chemical residues along outer margins.
- Variance Inflation Rejection occurs when unstratified pooling mixes high-concentration edge swatches with low-concentration center swatches, artificially expanding sample standard deviation and triggering false rejections under standard Gaussian variables formulas.
- Composite Dilution Artifact occurs when technicians blend edge and center swatches into a single laboratory test jar, mathematically diluting localized chemical spikes below analytical limits of detection.
- Core Shift Misclassification occurs when longitudinal thermal retention creates core non-compliance that remains undetected by sampling only outer roll laps.
False acceptance releases non-compliant material into the market. Failing to deploy stratified edge-to-middle sampling protocols exposes importers to severe regulatory enforcement, including mandatory market recalls, border detentions, and damaged retail relationships.

Ledger
Implementing stratified sampling carries financial costs that must be balanced against commercial risk exposure. Chemical analytical testing is expensive: standard ISO 17025 accredited panels for restricted substances ~ covering total fluorine for PFAS screening, heavy metal extraction, phthalates, and cleavage of carcinogenic aromatic amines ~ range from $350 to $1,200 per specimen. Running full five-point cross-web profiles on multiple rolls per lot rapidly inflates testing bills and eats into thin conversion margins.
These laboratory expenses must be weighed against total shipment value and the financial fallout of border detentions. A single container holding 50,000 meters of technical apparel fabric can carry an invoice value exceeding $300,000. If customs authorities or brand compliance audits detect non-compliant alkylphenol ethoxylates or elevated formaldehyde on a single edge cut, the entire container gets seized.
Storage fees, detention charges, mandatory re-export, or hazardous destruction costs routinely top $40,000 ~ without accounting for lost sales or late-delivery penalties.
| Inspection Scheme Type | Direct Lab Testing Cost per Lot | Producer Risk (α) Value Exposure | Consumer Risk (β) Exposure Value | Total Expected Compliance Cost |
|---|---|---|---|---|
| Single Edge Swatch (Unregulated) | $350 | $18,000 (False Scrap) | $145,000 (Detention/Recall) | $163,350 |
| ISO 2859-1 Random Attribute (n=5) | $1,750 | $8,500 (Retest Delay) | $68,000 (Border Seizure) | $78,250 |
| Stratified 3-Zone Composite Scheme | $2,450 | $2,100 (Localized Retest) | $4,200 (Residual Exposure) | $8,750 |
| Full 5-Point Cross-Web Profile (n=10) | $5,200 | $800 (Definitive Clearance) | $0 (Zero Clearance Risk) | $6,000 |
Producer risk also inflates holding charges. When an unadjusted sampling scheme generates false positives by testing contaminated edge trim, mills end up scrapping compliant central web material or incurring unnecessary re-refinishing costs. Re-processing fabric through continuous washers or stenters to strip excess finish degrades tensile strength, lowers tear resistance, and wastes energy, adding roughly $0.15 to $0.40 per meter in direct re-work expenses.
Testing agreements are best structured so lab expenses align directly with batch risk profiles.
Cost optimization requires a tiered verification strategy. First-line screening combines multi-point sampling with smart laboratory pooling: equal mass portions harvested from Left Edge and Right Edge locations are blended into an Edge Composite specimen, while central swatches form a Center Composite specimen. Running analytical tests on two composite samples per roll halves testing fees while preserving spatial separation.
If the Edge Composite triggers a warning near regulatory thresholds, the lab re-tests stored discrete swatches to isolate exact spatial variance.
Smart laboratory pooling of edge swatches cuts analytical testing fees by fifty percent while preserving spatial separation required to catch chemical migration.
Standard purchase agreements should include explicit cost-allocation language: “If stratified acceptance testing reveals chemical non-compliance exceeding statutory limits within ten percent of total fabric width, the supplier absorbs all primary testing fees, secondary arbitration testing expenses, and associated freight detention charges.”

Stipulation
Translating statistical sampling protocols into enforceable purchase agreements requires precise contract language that eliminates ambiguity around sampling locations, test methods, and arbitration criteria. Generic clauses stating that fabric “must comply with standard restricted substance lists” leave buyers exposed during disputes. Finishing mills routinely challenge rejections by arguing that swatches were harvested incorrectly, tested under unapproved standards, or taken from unusable scrap selvedges.
Contractual specifications must mandate exact physical cutting geometries and statistical evaluation models.
A robust compliance addendum defines cut-line rules, usable fabric width, and spatial sampling locations. The contract must state that chemical compliance applies across one hundred percent of specified usable width, defined as total fabric width minus ten millimeters per side for pin-hole clearance. Sampling rights should grant buyer technicians authority to extract stratified swatches across any roll lap, including core layers and edge margins.
Specifying ISO 17025 accredited laboratory testing under exact standards ~ such as EN ISO 14184-1 for formaldehyde or EN 14362-1 for azo colorants ~ prevents mills from submitting incompatible internal test reports.
Laboratory retests demand a clear chain of custody and a formal dispute resolution framework for split-sample arbitration. When buyer surveillance testing contradicts a mill’s certificate of analysis, a standardized retest protocol prevents commercial deadlocks. The agreement should mandate that an independent ISO 17025 accredited laboratory perform arbitration testing on retained, sealed specimens cut during the original harvesting event.
Contractual language must state that arbitration results are final and legally binding, with the losing party absorbing all testing, storage, and legal expenses.
The decision list below establishes essential contractual terms for integrating stratified edge-to-middle acceptance protocols into commercial textile purchase orders.
- Usable Width Cut Line Stipulation establishes that statutory chemical limits apply to all fabric area extending inward from ten millimeters inside selvedge pin-marks.
- Stratified Sampling Authority Clause guarantees buyer quality representatives the right to extract physical specimens from left edge, center, right edge, and core roll positions.
- Composite Pooling Threshold Rules defines precise laboratory trigger levels where composite screening results require mandatory testing of discrete individual swatches.
- Retest Chain of Custody Mandate requires mills and buyers to retain sealed, nitrogen-flushed specimen splits for thirty days to support arbitration testing.
- Default Indemnity Allocation Clause transfers all border detention expenses, warehouse storage fees, and re-export penalties to the supplier upon confirmed chemical non-compliance.
Ultimately, contract clauses determine chargeback liability. Integrating rigorous statistical acceptance protocols into purchasing documentation shifts financial risk back onto the converter. Mills operating under explicit cross-web compliance contracts enforce strict stenter temperature controls, calibrate padding mangle nip pressure, and monitor chemical exhaust rates continuously.
Precise contractual terms transform statistical acceptance from a passive quality control checkpoint into an active driver of mill-floor process capability.