Spectrophotometer Geometry Selection in Textile Dyehouse Quality Assurance
Specify d/8° specular included for dye formulation and d/8° specular excluded or 45°/0° for bulk shade sorting to isolate surface texture from color yield.


Chamber
A reflectance spectrophotometer projects light onto conditioned swatches to evaluate spectral distribution. In dyehouse shade sorting, optical configuration governs whether the sensor reads dyestuff absorption alone or records substrate surface texture alongside chemical formulation. The choice between directional geometry, designated 45°/0° or 0°/45°, and diffuse cavity geometry, designated d/8° or 8°/d, dictates whether bulk shipments pass or fail incoming inspection.
Mills and brand quality managers frequently dispute shade approvals because their respective laboratories operate incompatible optical configurations. When a brand measures an approved lab dip on a 45°/0° spectrophotometer and the dyehouse sorts bulk pieces using a d/8° instrument, numerical color differences diverge by more than 1.2 DEcmc units on textured materials.
Directional instruments illuminate the sample at an angle forty-five degrees from the perpendicular axis and measure reflected energy at zero degrees normal to the surface, or reverse those paths. This optical alignment eliminates specular gloss from the light collector. Smooth surfaces reflect gloss directly away from the collection lens, while rough textures scatter specular light into the detector.
Consequently, 45°/0° instruments duplicate human visual assessment under daylight inspection cabinets, where surface fuzz, rib knit structures, and luster directly influence perceived shade depth.
Directional optical geometry separates surface texture from colorant formulation while diffuse geometry unifies them.
Diffuse geometry utilizes an integrating cavity lined with highly reflective, non-selective barium sulfate or sintered polytetrafluoroethylene. Light pulses enter the cavity, reflecting repeatedly off diffuse interior walls until isotropic illumination bathes the target swatch from every direction. The sensor monitors reflected energy at eight degrees off the normal axis.
This configuration illuminates surface micro-crevasses, slub irregularities, and yarn hairiness uniformly. Diffuse optics quantify total reflected energy regardless of topography. For computer color matching, dye recipe formulation, and dyestuff strength verification, diffuse geometry remains the industry benchmark because it records chemical absorbance rather than yarn physical geometry.
| Optical Configuration | Illumination Path | Detection Path | Specular Management | Target Application | Primary Textile Risk |
|---|---|---|---|---|---|
| 45°/0° Annular | Circular ring at 45° | Normal axis at 0° | Naturally excluded | Finished garment sorting | Over-penalizes surface yarn fuzz |
| 45°/0° Circumferential | Segmented points at 45° | Normal axis at 0° | Naturally excluded | Trim and component matching | Directional rotational errors |
| Diffuse d/8° SPIN | Integrating cavity | Off-normal axis at 8° | Specular component included | Dye recipe formulation | Ignores surface finishing gloss |
| Diffuse d/8° SPEX | Integrating cavity | Off-normal axis at 8° | Specular trap excluded | Bulk roll shade sorting | Trap size variability across brands |
Directional geometry reveals how the eye judges finished garments, while diffuse cavity reflection reveals how much dye entered the liquor.


Sheen
Surface reflectivity alters perceived depth long before monochromatic light reaches internal dyestuff molecules. When yarn bundles undergo calender pressing, silicone softening, or mechanical sanding, their refractive boundary shifts. A polished polyester filament reflects roughly four percent of incident light as specular sheen across the interface between air and polymer.
On a textured dobby cloth, that specular reflection disperses across multiple microscopic angles. If an auditor measures that finished cloth after heavy decatizing, the flattened yarn crowns increase regular mirror reflection. The human eye interprets this surface glare as a lighter, desaturated shade.
AATCC Evaluation Procedure 6 penalizes specular inclusion whenever mill technicians assess commercial color match against visual panels.
Selecting the incorrect optical geometry distorts shade decisions on modified surfaces. Consider the wet processing sequence for micro-denier polyester interlock knit. The dyer applies disperse blue dyes inside a high-temperature overflow jet, achieving an exact color match on the unwashed greige state.
After drying, the finishing line applies an aqueous fluorocarbon repellent and passes the material through a heated calender at six bars of hydraulic pressure. The calender flattens surface loops, raising specular gloss. Measured on a diffuse d/8° instrument with specular component included, the recorded reflectance values remain static because total energy absorption has not changed.
When evaluated on a 45°/0° instrument, the recorded reflectance drops significantly because increased regular sheen deflects light away from the zero-degree lens, registering an apparent color shift of 1.45 DEcmc. The dyehouse ships the roll assuming color constancy, yet the garment assembly plant rejects the lot upon arrival.
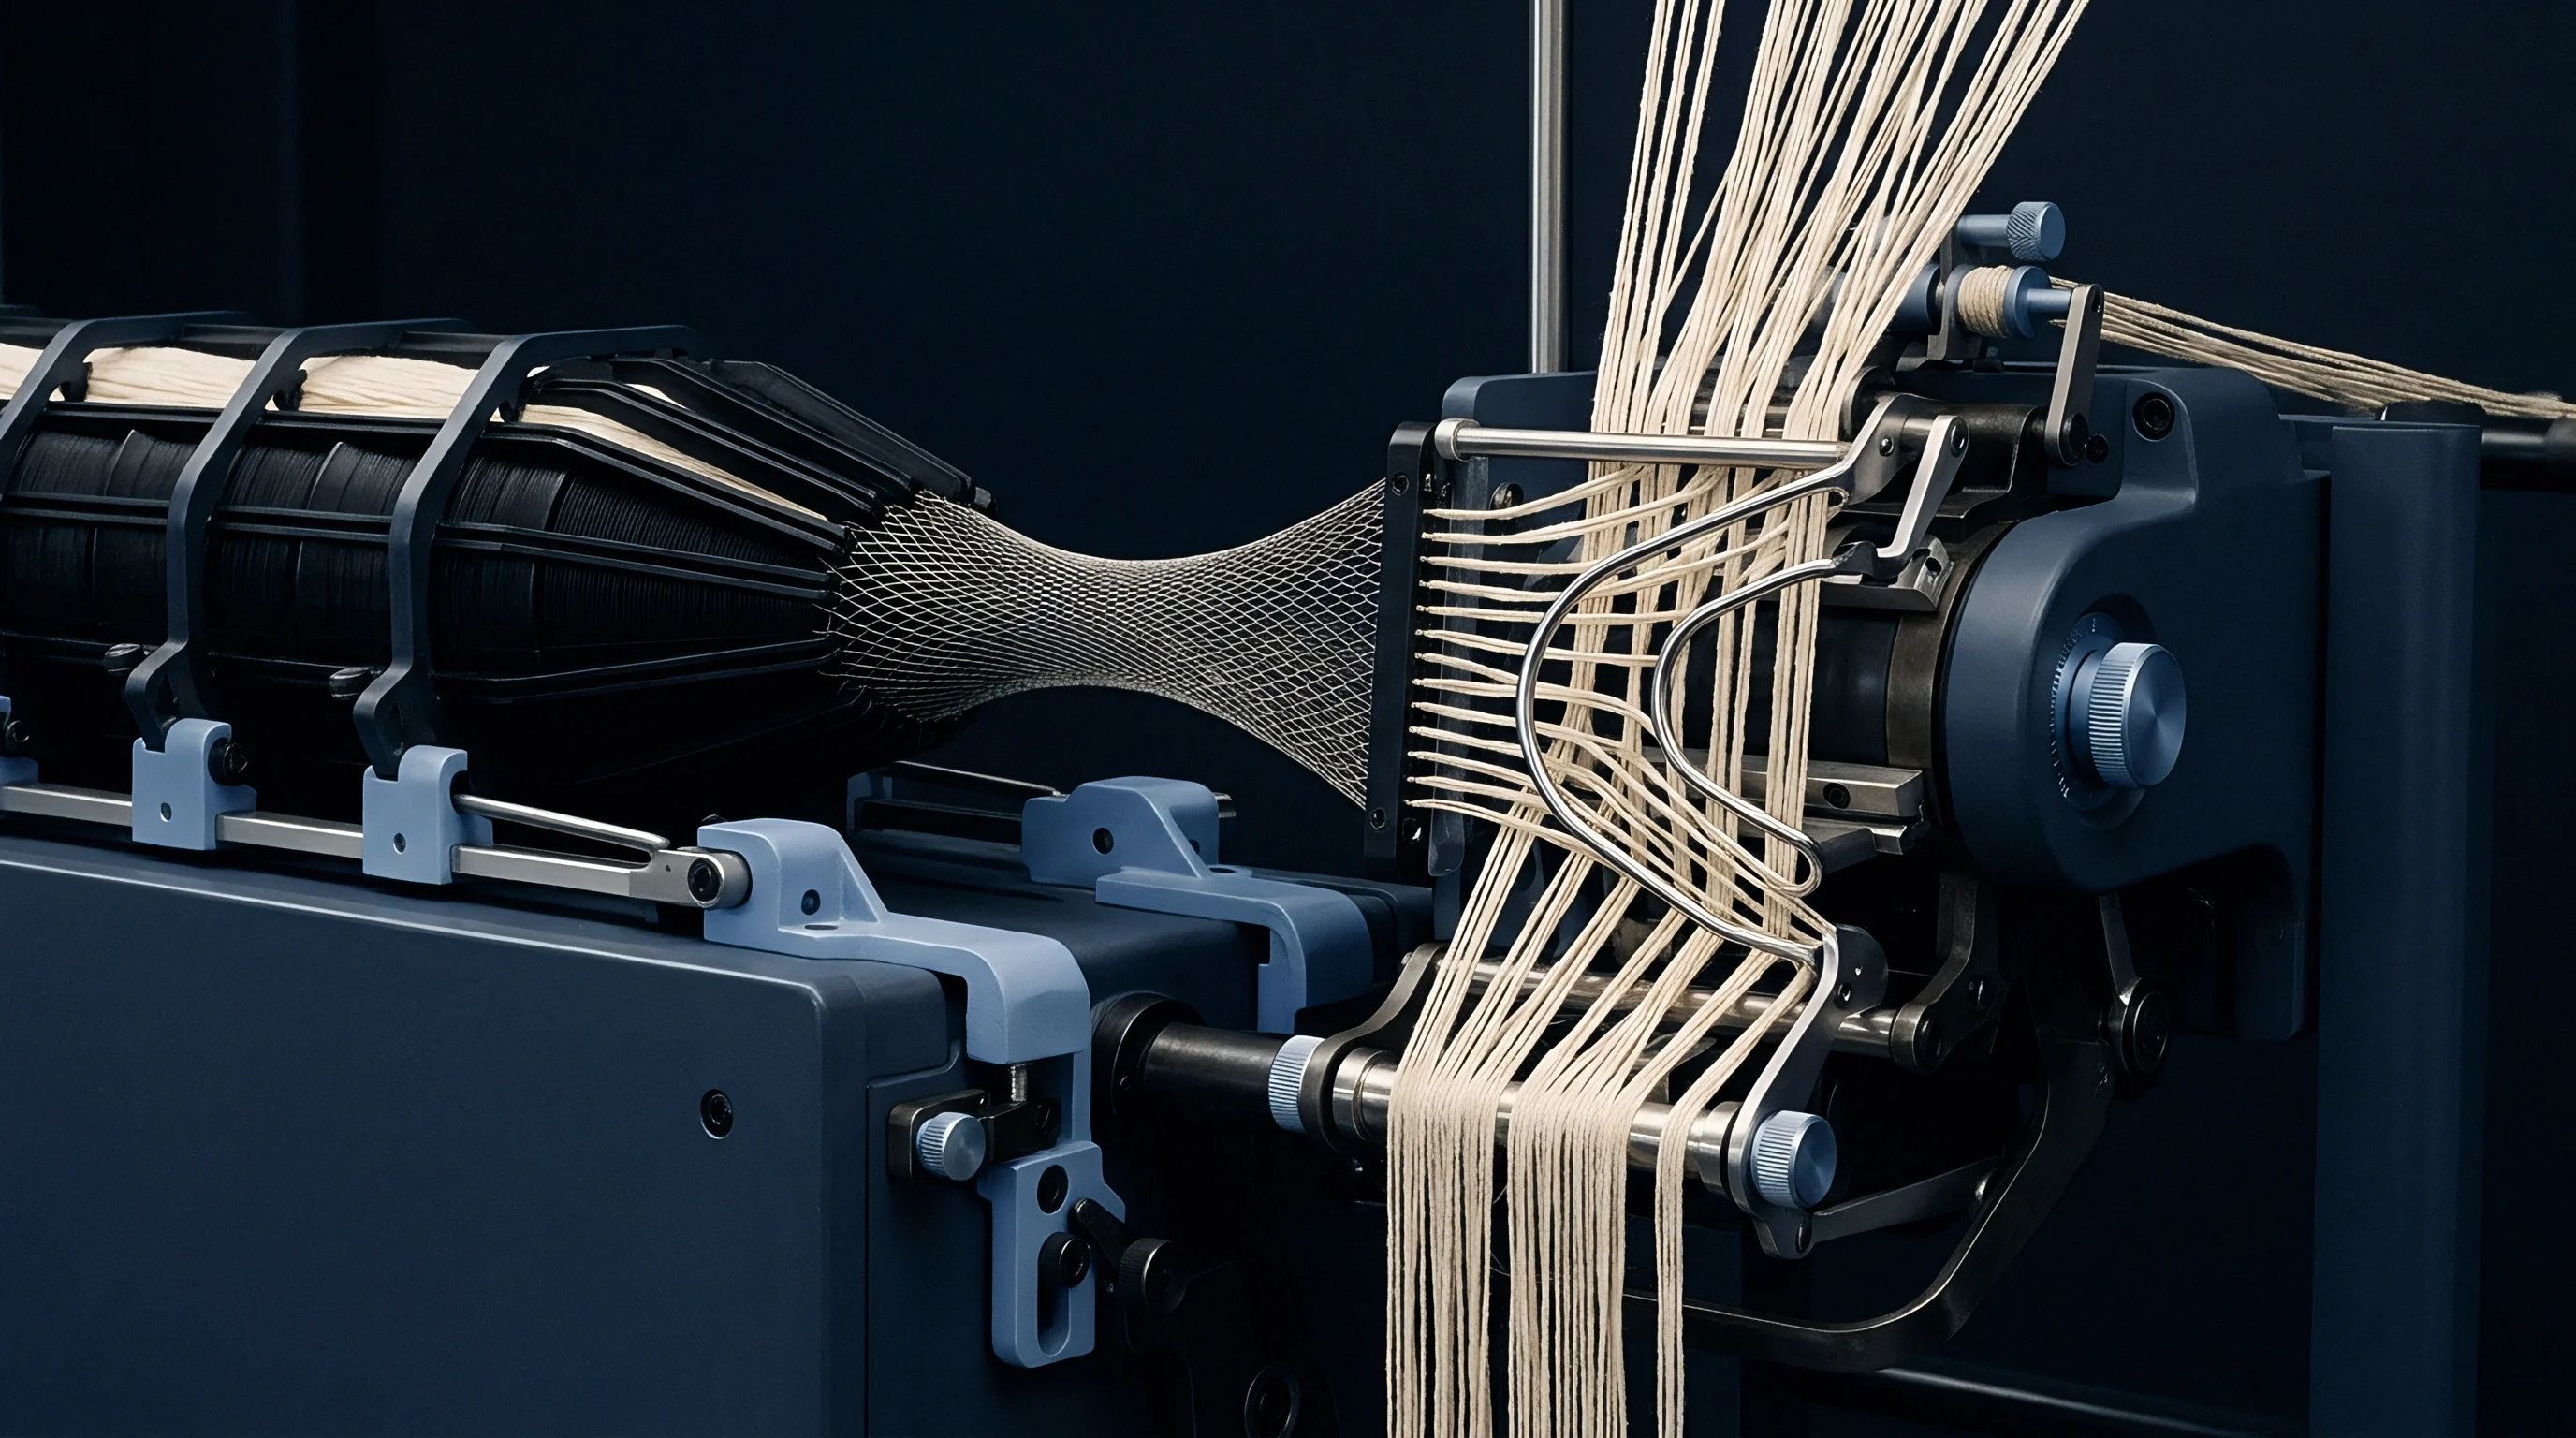
Which Optical Path Isolates True Colorant Concentration?
Dyed yarns within a high-twist crepe scatter photons across irregular microscopic angles. Spectrophotometer geometry determines whether quality control personnel accept or reject lots based on dyestuff batch concentration or finishing tension variations. The production route exposes piece goods to multiple mechanical operations that alter optical readings:
- Causticization weight loss reduces cotton fiber wall thickness, increasing light scatter and causing 45°/0° spectrophotometers to read pastel shades as washed out.
- Hydrophilic silicone padding lowers yarn friction coefficients and deepens apparent depth on directional sensors without adding colorant molecules.
- Emerizing rollers cut micro-loops on warp knit goods, creating velvet pile that traps directional illumination inside dense fiber forests.
- High-temperature stenter frame tension pulls knit courses tighter, flattening wales and skewing directional reflectance values toward artificial brightness.
Specular reflection accounts for four percent.
Mismatched specular modes between customer and dyehouse trigger catastrophic lot rejections, leaving unmovable finished rolls stacked on warehouse pallets.


Port
Aperture plates determine the physical area exposed to the optical sensor. Commercial spectrophotometers feature interchangeable aperture openings ranging from small areas of three millimeters to large areas of twenty-five or thirty millimeters. Textile quality assurance demands large aperture selections due to structural heterogeneity.
A single strand of spun ring yarn measures a fraction of a millimeter, while an interlaced dobby or knit course spans several millimeters per structural repeat. Aligning a small three-millimeter aperture against a coarse oxford cloth positions the optical sensor over a single yarn crown or an open interlacing gap. Numerical readings fluctuate violently across successive placements on identical panels.
| Aperture Setting | Illuminated Area (mm) | Measured Area (mm) | Standard Deviation (L ) | Standard Deviation (b ) | Mean DEcmc to Target |
|---|---|---|---|---|---|
| Small Area View (SAV) | 6.0 | 3.0 | 0.48 | 0.39 | 0.92 |
| Medium Area View (MAV) | 12.0 | 8.0 | 0.22 | 0.17 | 0.44 |
| Large Area View (LAV) | 30.0 | 25.4 | 0.05 | 0.04 | 0.12 |
| Extra Large View (XAV) | 36.0 | 30.0 | 0.02 | 0.02 | 0.06 |
Aperture size governs optical averaging depth.
Textured yarns scatter incident light unpredictably. When testing yarn packages, loose flock, or open circular knits, the sample compresses into the measurement port under spring-loaded tension. If the technologist applies excessive clamping pressure, fiber packing density increases beneath the glass port cover, artificially raising measured absorption.
If the port lacks glass protection, yarn loops protrude directly into the integrating cavity, contaminating the barium sulfate coating with loose fly. Contamination absorbs cavity light, degrading instrument calibration over months of continuous dyehouse operation.

Averaging Windows across Structural Repeats
Jacquard patterns and coarse pique knits exhibit yarn groupings exceeding eight millimeters in width. Capturing an accurate spectral profile requires averaging multiple physical reads across the sample surface. Quality protocols must specify sample rotation and placement routines to neutralize yarn twist directionality:
- Initial baseline presentation exposes the face side aligned with warp yarns oriented vertically across the optical bench.
- Ninety-degree clockwise indexation rotates the swatch to position filling yarns vertically, canceling mechanical directional sheen.
- Lateral sample relocation shifts the port twenty centimeters down the piece goods to sample a different dye liquor distribution zone.
- Final diagonal presentation registers cross-tread angles to capture diagonal twill lines without preferential shadow bias.
Four rotations cancel yarn directional bias.
Inserting ASTM E2222 clause 7.3 into purchase contracts binds the exporter to a twenty-five millimeter port plate and four ninety-degree rotations before signing the shipping manifest.

Trap
Integrating spectrophotometers offer two distinct optical modes for managing the specular reflection spike. Specular Included, known commercially as SPIN or SCI, captures all reflected light, both diffuse scattering and direct mirror bounce, inside the integrating cavity. Specular Excluded, known as SPEX or SCE, opens a mechanical trap port on the cavity wall positioned eight degrees opposite the collection lens.
This gloss trap absorbs mirror reflection from the cloth surface, preventing direct shine from reaching the photodiode array. Choosing between SPIN and SPEX represents the single most contested decision in wet processing quality assurance.
SPIN mode quantifies total chemical color yield. When formulating dye recipes inside formulation software, technicians rely exclusively on SPIN measurements. Pigment printing paste concentrations, disperse dyestuff exhaust rates, and acid dye saturations correspond directly to total absorbed energy.
If a formulation system attempted to calculate Kubelka-Munk absorption functions using SPEX data, variations in calendering, brushing, or washing would alter the calculated dyestuff mass. The software would erroneously call for additional dye to compensate for surface scattering losses.
Specular excluded data matches human visual ranking in retail lighting.
SPEX mode isolates visual perception for final shipment clearance. In retail stores, human observers evaluate color under ambient overhead lighting where surface sheen bounces away from the eye. If two shirts cut from identical dye lots receive different chemical finishes, one receiving a matte resin and the other a luster calender, human inspectors reject the garments as uncoordinated.
SPEX measurements detect this exact discordance, registering a color difference exceeding 1.1 DEcmc. Under SPIN measurement, the identical pair registers less than 0.2 DEcmc, showing an acceptable commercial match that collapses under store inspection.
Specular exclusion magnifies physical surface disparities.
Consider a practical dyehouse scenario involving a 280 gram per square meter circular knit polyester fleece. The dyehouse runs forty pieces of twenty-two gauge interlock destined for fleece finishing. The formulation target demands an intense navy shade.
During processing, lot A passes through a napper and shearing frame twice, producing a dense, vertical pile. Lot B passes through the shearer four times, creating an ultra-short, sheared face. Dyestuff concentration per kilogram of fiber measures identical across both batches at 2.40 percent disperse blue 79.
The quality control laboratory measures both lots on a benchtop d/8° spectrophotometer:
- SPIN color difference evaluation yields a total difference of 0.18 DEcmc, confirming that dyestuff mass transfer and chemical fixation match the approved formulation.
- SPEX color difference evaluation records a total difference of 1.34 DEcmc with delta L at plus 1.28, flagging lot A as significantly lighter due to micro-fiber diffuse light entrapment.
- Commercial pass threshold failure occurs immediately against the buyer purchase order limit of 0.80 DEcmc, freezing eighty thousand meters of cloth at the shipping bay.
Batch re-dips consume forty-eight production hours.
The finishing mill invariably claims that the lab dip matched perfectly under diffuse illumination and blames the customer’s directional handheld unit for reading surface fuzz.
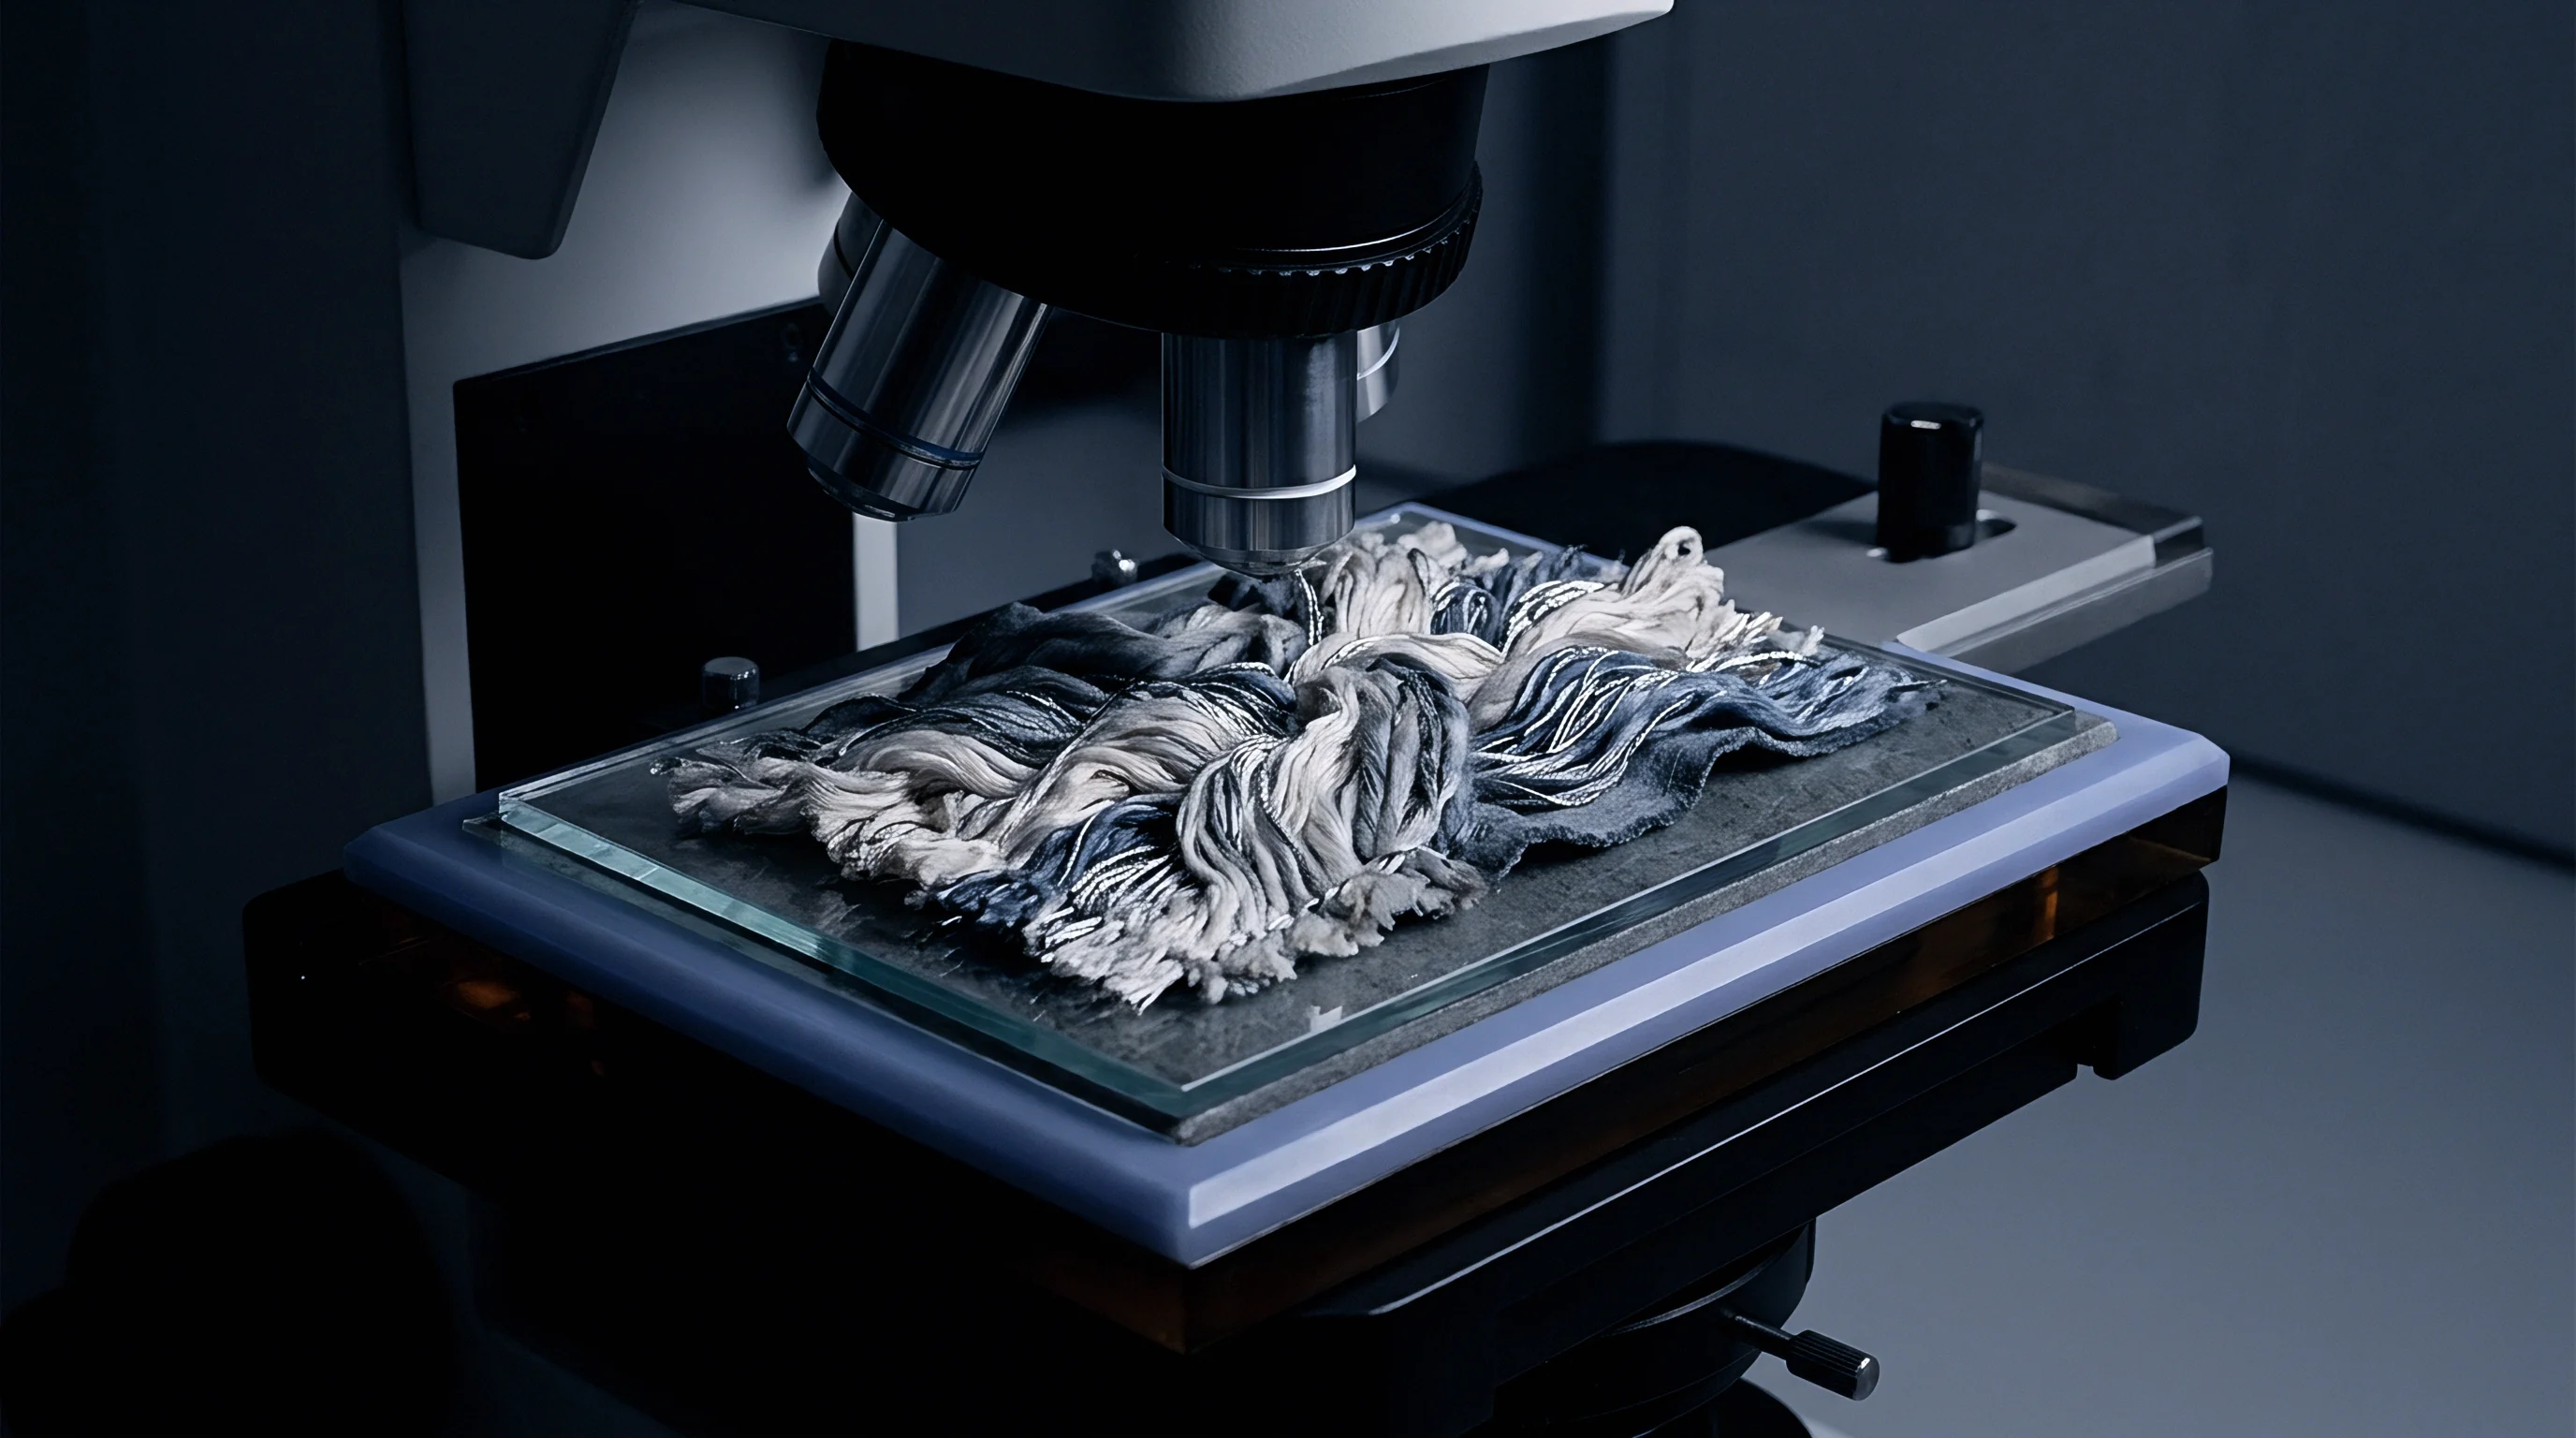
Drift
Benchtop instruments and portable production units rarely generate identical spectral curves from the same swatch. In modern textile supply networks, vertical dyehouses formulate recipes on heavy benchtop d/8° sphere spectrophotometers inside climate-controlled conditioning rooms. Meanwhile, traveling quality auditors and garment factory receiving docks deploy portable 45°/0° spectrophotometers on warehouse packing tables.
This optical divergence creates disputes that stall container dispatches. Inter-instrument agreement between identical models from the same manufacturer hovers around 0.15 DEcmc. Inter-instrument agreement between a benchtop d/8° cavity and a portable 45°/0° unit on textured textiles frequently exceeds 1.20 DEcmc, completely consuming standard commercial tolerance bands.
Xenon flash lamps drift with age.
Ceramic calibration standards provide traceable reflectance benchmarks, but they fail to represent textile light scattering behavior. White calibration tiles present polished, perfectly flat glass surfaces with fixed refractive indices. Routine morning calibration against a zero-gloss black trap and a polished white tile verifies that the photodiode array functions properly, but it cannot calibrate how the instrument collects photons scattered from three-dimensional corduroy ribs or brushed fleece.
Fiber orientation introduces structural polarization that flat calibration standards never replicate.
Inter-instrument agreement across differing optical designs drifts beyond 0.8 DEcmc on matte spun polyester under standard illuminant D65.
Automated manufacturing environments in synthetic continuous dyeing increasingly test in-line spectrophotometer scanning heads mounted above the stenter exit frame. In-line spectrophotometers must measure moving yardage at sixty meters per minute without contacting the hot, fluttering web. Non-contact geometry introduces variable distance offsets.
If the cloth flutters five millimeters closer to the optical port, illumination intensity surges, artificially shifting lightness values. Modern in-line heads utilize high-speed pulsed xenon sources and distance-compensating optical sensors, yet correlation against conditioned benchtop swatches remains imperfect.
| Substrate Construction | Fiber Type | Surface Finish | d/8° SPIN DEcmc | d/8° SPEX DEcmc | 45°/0° DEcmc |
|---|---|---|---|---|---|
| 50D Plain Woven Taffeta | Filament Nylon 6,6 | Heat-set smooth | 0.12 | 0.28 | 0.31 |
| 30/1 Single Jersey Knit | Combed Cotton | Enzyme washed | 0.18 | 0.45 | 0.74 |
| 2/2 Twill Gabardine | Worsted Wool | Decatized sheared | 0.22 | 0.52 | 0.86 |
| Heavy French Terry Knit | Cotton/Polyester | Brushed un-sheared | 0.31 | 0.88 | 1.42 |
| Testing performed under standard lab conditioning at 21°C and 65% RH; color difference calculated against master digital QTX files under illuminant D65 with 10° observer. | |||||
Textile technology currently relies on empirical transform profiles to translate spectral curves between 45°/0° and d/8° configurations. These mathematical models function reliably on rigid, isotropic plastic plaques. On woven and knitted materials, weave density, yarn crimp angles, and fiber cross-sectional shapes distort photon paths unevenly across wavelength bands.
Estimating that an empirical matrix can reliably adjust a 45°/0° measurement to match a d/8° SPEX reading within 0.30 DEcmc on irregular twill yardage represents an unproven commercial claim. Dyehouses navigating cross-tier audits cannot rely on mathematical translation software to bridge geometric divides.
Whether mathematical transform matrices can ever reconcile directional annular readings with diffuse cavity reflectance across heavily sueded polyester remains unresolved across commercial quality labs.
Clearance
Commercial shade execution succeeds only when buyer purchase orders explicitly codify optical instrument parameters. Specifying a pass/fail tolerance of 0.80 DEcmc without designating instrument geometry, aperture plate diameter, and specular trap status invites supply chain gridlock. If the buyer checks goods using 45°/0° annular optics and the dyeing mill runs batch releases using d/8° SPIN optics, half of all technically sound dyeings face unjustified factory rejections.
A sound sourcing specification names the exact optical geometry, viewing area, and illumination source required for bulk clearance.
Digital standard files, exported as QTX or CxF3 packages, record raw spectral reflectance factors across the thirty-one visible spectrum bands from 400 to 700 nanometers at ten-nanometer intervals. These files must include complete metadata documenting the source geometry. When a dyehouse imports a brand digital standard gathered on a 45°/0° instrument into recipe software calibrated for d/8° integrating spheres, automated dye dosing recipes produce off-shade lab dips on the first formulation round.
Technologists waste days adjusting chemical concentrations when the true error stems from mismatched optical geometry metadata.
Digital standards eliminate physical card fading.
Technical purchase contracts protect both supplier and brand by stipulating precise optical verification rules. The fabric specification must demand d/8° specular excluded geometry with a twenty-five millimeter aperture for all piece-dyed bulk shade clearances, reserving 45°/0° instruments exclusively for visual color harmony checks against molded plastic zippers, buttons, and coated leather trims. When suppliers operate within defined geometric parameters, shade disputes drop across international supply routes, container inspection holds disappear, and landed delivery timelines hold firm.
Commercial release proceeds once both parties confirm identical optical geometry, matching aperture diameters, and concordant specular trap settings on their calibration certificates.