Dimensional Spread
Statistical dispersion curves defining the range and frequency of individual fibre widths within a textile lot establish its processing potential and commercial grade. Measured in micrometres across hundreds of individual specimens, diameter distribution reveals the variance around the central mean diameter, which average values conceal. The measurement identifies the presence of out-of-spec coarse fibres or short-fibre down within raw material tops, card slivers, and finished yarns.
This statistical spread governs the spinning limit of yarn, influencing tensile strength, softness, and fabric drape. The measure loses validity when applied to highly flattened or irregularly lobed cross-sections without adjusting optical calibration profiles for non-circular geometry.
Statistical Variance
Standard deviations and coefficients of variation quantify the shape of the measured population profile. A normal, narrow bell curve indicates uniform growth conditions within the flock, yielding consistent drafting during spinning and minimal yarn irregularity. Bimodal distributions expose artificial blending, where mills combine fine fibres with cheaper, coarser stocks to reduce raw material costs while attempting to preserve a nominal mean target.
Coarse tails, representing fibres exceeding 30 micrometres, cause prickle sensation in garments worn next to the skin, even when the nominal average falls well below 20 micrometres. Laboratories calculate the coarse edge fraction directly from the distribution curve, reporting it as a commercial acceptance parameter in quality certificates.
Instrumental Measurement
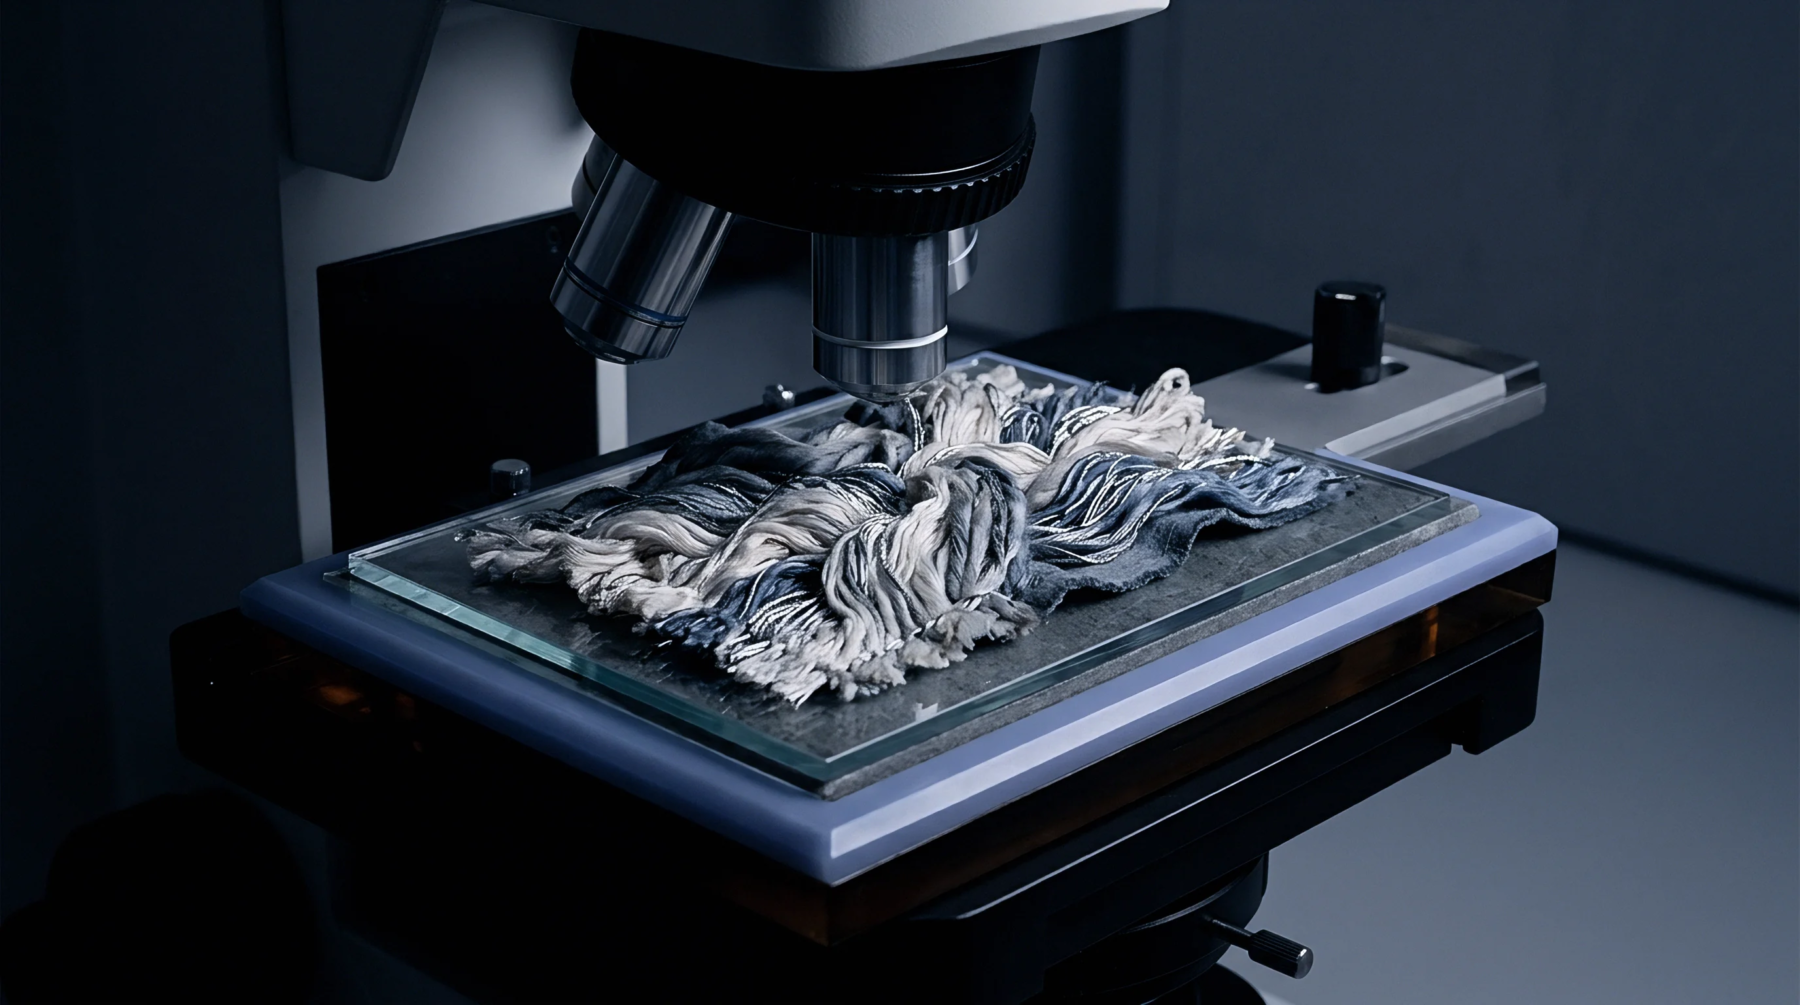
Modern fibre testing facilities employ projection microscopes, optical fibre diameter analyzers, or laser-based instruments to map the population spread. Optical projection remains the legal reference method under international standards, requiring the operator to measure snippet widths across a glass slide. Automated optical analyzers accelerate this task, evaluating tens of thousands of individual snippets suspended in liquid flow cells within minutes.
These automated devices generate high-density histograms, calculating the mean, standard deviation, coefficient of variation, and curvature distributions simultaneously. Operators must maintain strict control over sample humidity and calibration slides, as changes in ambient moisture expand fibre cross-sections, distorting the reported distribution curve.
Commercial Impact
Fabric touch and mill efficiency correlate directly with the width spread of incoming lots. Lots exhibiting high coefficients of variation break more frequently during ring spinning, forcing production lines to run at lower spindle speeds to avoid excessive end-breaks. In woven worsted fabrics, a wide distribution promotes uneven dye absorption, because thinner fibres absorb dyestuff at different rates than thick fibres, producing barré defects across the fabric plane.
Knitters set contract limits on the percentage of fibres exceeding specified threshold widths to prevent customer prickle complaints. Testing laboratory certificates documenting diameter distribution determine whether a shipment satisfies delivery contracts or incurs commercial deductions based on standard industry tolerance bands.