Quantifying Micro-Spatial Finish Distribution Anisotropy in Advanced Functional Wet Processing Hydrophobic Membranes
Micro-spatial finish distribution anisotropy creates subterranean chemical voids that cause premature hydrostatic failure despite acceptable macroscopic spray ratings.


Pore
Expanded polytetrafluoroethylene membranes rely on node-and-fibril structures produced by paste extrusion and biaxial stretching. This process creates a dense polymeric network joined by fine fibrils, forming tortuous internal paths with nominal pore diameters from 0.1 to 3.0 micrometers. Applying functional hydrophobic finishes during wet processing forces liquid liquor into these intricate void channels under mechanical nip pressure.
Finish formulations historically used perfluoroalkyl substances, though current production favors fluorine-free organosilicon or hyperbranched alkane emulsions. These active compounds reduce surface energy to shed liquid water while preserving vapour permeability. However, chemical deposition across internal voids is rarely uniform; micro-spatial distribution anisotropy occurs when chemical coverage varies across microscopic coordinates, creating local drops in surface energy, contact angle hysteresis, and hydrostatic resistance.
Foulard padding forces aqueous emulsions into dry substrates using padder rolls set at defined nip pressures, relying on capillary action to pull liquor into subterranean voids. As water or solvent evaporates during drying, thermal gradients and capillary pressure differentials pull surfactant and hydrophobic molecules toward outer surfaces. This migration creates concentration gradients between the microporous core and its boundaries as solvent evaporates and core chemical density drops.
Heat setting then cures the hydrophobic polymer onto the fluoropolymer or polyurethane framework. If temperature varies across the stenter frame by as little as two degrees Celsius, divergent cross-linking kinetics permanently lock in micro-spatial variations in finish density.
Detecting this micro-spatial variation requires measuring chemical coverage down to single-micron scales. Standard macroscopic repellency tests, like ISO 4920 spray ratings or ISO 811 hydrostatic head testing, average performance across several square centimeters and obscure microscopic voids where active molecules are sparse. A membrane with a high nominal hydrostatic head of 20,000 millimeters of water pressure can still fail in the field if micro-spatial finish anisotropy leaves five-micrometer void clusters unprotected, allowing liquid droplets to breach untreated channels under dynamic pressure and bypass macroscopically sound surface coatings.

Capillary Evaporation Kinetics and Chemical Migration
In foulard finishing, mechanical nip pressure drives liquid liquor into internal polymeric networks. The wet pick-up rate establishes the initial volume of hydrophobic actives, cross-linkers, and emulsifying surfactants inside the web. When wet membranes enter drying zones, heat flux drives solvent evaporation at exposed faces.
Rapid surface evaporation creates capillary pressure differentials between the wet core and dry boundaries, pulling water and dissolved finish components toward high-evaporation zones on outer nodal surfaces.
Evaporation rates dictate whether hydrophobic molecules stay distributed through internal node structures or concentrate at outer faces. High-temperature drying accelerates surface evaporation, pulling active finish out of internal pathways before cross-linking can fix it in place. The core is left depleted, exposing untreated polymeric fibrils to water condensation.
Conversely, slow multi-stage drying maintains equilibrium capillary pressure, letting hydrophobic polymers cure evenly along internal fibril walls. Variations in air velocity, nozzle distance, and moisture transfer across the stenter width cause localized drying differences, driving finish migration variances that show up as spatial anisotropy across the fabric bolt.

Fluorine-Free Finishes at Sub-Micron Interfaces
Organosilicon micro-emulsions and hyperbranched alkane dispersions exhibit different thermodynamic wetting behaviors than legacy perfluoroalkyl repellents. Fluorinated chemistries carry exceptionally low surface energy, spreading liquor evenly over fluoropolymer or polyurethane substrates despite high interfacial contact angles. Fluorine-free alternatives rely on long-chain hydrocarbon crystallites or polydimethylsiloxane backbones with higher emulsion surface tension, requiring surfactants to lower liquor surface tension below 24 millinetwons per meter to achieve complete wetting inside microscopic fibril channels.
Surfactant loading in fluorine-free recipes often doubles or triples that of fluorinated systems. During drying and curing, these surfactant molecules migrate to hydrophobic interfaces; if thermal curing fails to force complete tail reorientation, their hydrophilic heads remain pointed outward. Clustering of residual hydrophilic surfactants creates high-energy micro-sites within the hydrophobic alkane matrix.
These domains absorb moisture under pressure, lowering localized entry resistance and compromising overall membrane performance.
The presence of 0.05 percent unreacted hydrophilic surfactant at a subterranean nodal junction reduces local water entry pressure by up to 40 percent under dynamic hydrostatic testing.
Deposition efficiency depends on bath particle size distribution. Emulsions with median particle diameters over 200 nanometers undergo mechanical filtration at outer pore entrances during padding, trapping larger droplets at surface openings and blocking deeper entry. Sub-micron particles under 50 nanometers move freely through subterranean networks, achieving consistent coverage across internal fibril surfaces.
Shifts in bath shear rate, temperature, or pH cause particle agglomeration, coarsening the size distribution and driving micro-spatial anisotropy across production lots.
The mechanical drivers of micro-spatial deposition manifest through four primary failure mechanisms during wet finishing:
- Filtration Agglomeration occurs when emulsion particles exceed nominal pore entrances, locking active hydrophobic chemicals on outer faces while leaving internal void networks untreated.
- Thermal Migration Stripping develops when uneven air flow across drying zones pulls uncured hydrophobic polymers toward upper fabric boundaries, leaving lower nodal structures chemically depleted.
- Surfactant Inversion Phase Decay happens when residual emulsifiers fail to reorient during curing, generating hydrophilic micro-domains within an otherwise hydrophobic chemical matrix.
- Differential Swelling Instability manifests when aqueous solvent carriers swell hydrophilic membrane components unevenly, altering local flow channels and concentrating finish deposition along preferred fluid conduits.
Attributing localized water breakthrough to base membrane density variations overlooks the reality that controlled nip pressure and proper surfactant selection offset physical density fluctuations in qualified substrate lots.


Spectroscopy
Surface-sensitive analytical instruments measure chemical composition across micro-spatial domain boundaries down to sub-nanometer depths. Assessing micro-spatial finish distribution anisotropy requires spatial resolution capable of resolving individual polymeric nodes and fibrils. Conventional infrared techniques average signals over millimeter-scale spots, masking tiny chemical voids.
Advanced micro-spatial analysis combines fine spatial resolution with bond selectivity to quantify hydrophobic treatment variation across two-dimensional grids and vertical depth profiles.
X-ray Photoelectron Spectroscopy mapping provides quantitative elemental and chemical state data over surface depths of two to ten nanometers. By focusing monochromatic X-ray sources to micro-beam spots down to ten micrometers, XPS mapping tracks atomic fluorine, carbon, oxygen, and silicon concentrations across grid matrices. Ratios of fluorinated carbon to aliphatic carbon bonds reveal precise variations in fluoropolymer finish density, while silicon-to-carbon ratios provide equivalent spatial maps for organosilicon finishes.
XPS mapping detects subtle coverage gaps well before macroscopic physical tests register performance degradation.
Time-of-Flight Secondary Ion Mass Spectrometry achieves lateral spatial resolution below 200 nanometers while identifying molecular mass fragments from top monolayer surfaces. ToF-SIMS uses focused primary ion beams, such as bismuth or argon clusters, to sputter chemical species off membrane surfaces. Rastering this beam over micro-grids generates detailed chemical images of characteristic fragments, including perfluoroalkyl ions or siloxane species.
Dual-beam depth profiling pairs cluster ion sputtering with secondary ion mass analysis, mapping three-dimensional hydrophobic finish distribution through the entire membrane thickness.
Attenuated Total Reflectance Fourier Transform Infrared focal plane array micro-imaging enables non-destructive chemical mapping with diffraction-limited resolution, typically three to five micrometers when coupled with high-index germanium reflection elements. Array detectors capture thousands of infrared spectra simultaneously across a grid. Integrating characteristic absorption bands ~ such as C-F stretching between 1150 and 1250 wavenumbers or Si-O-Si asymmetric stretching at 1020 wavenumbers ~ produces quantitative chemical density maps.
Tracking elemental fluorine dispersion across the nodal network identifies wetting gradients.

Chemical State Mapping via X-Ray Photoelectron Analysis
X-ray photoelectron beam spots focused to fifteen micrometers resolve elemental fluorine-to-carbon ratios across targeted nodal domains. The high binding energy shift of C 1s photoelectron peaks for CF2 and CF3 species permits accurate spectral deconvolution from underlying substrate carbon signals, such as polyurethane or polyester backings. Peak area integration yields absolute atomic concentrations at every coordinate point across the micro-spatial matrix.
Data processing converts these atomic concentrations into spatial density maps. A uniform hydrophobic finish yields consistent atomic percentages across all coordinates, producing a narrow Gaussian distribution. Micro-spatial finish anisotropy appears as broad, multimodal distribution profiles or spatial clusters where atomic fluorine or silicon levels drop near zero.
These low-density coordinates mark physical locations where chemical coverage is insufficient to resist liquid penetration under dynamic pressure.
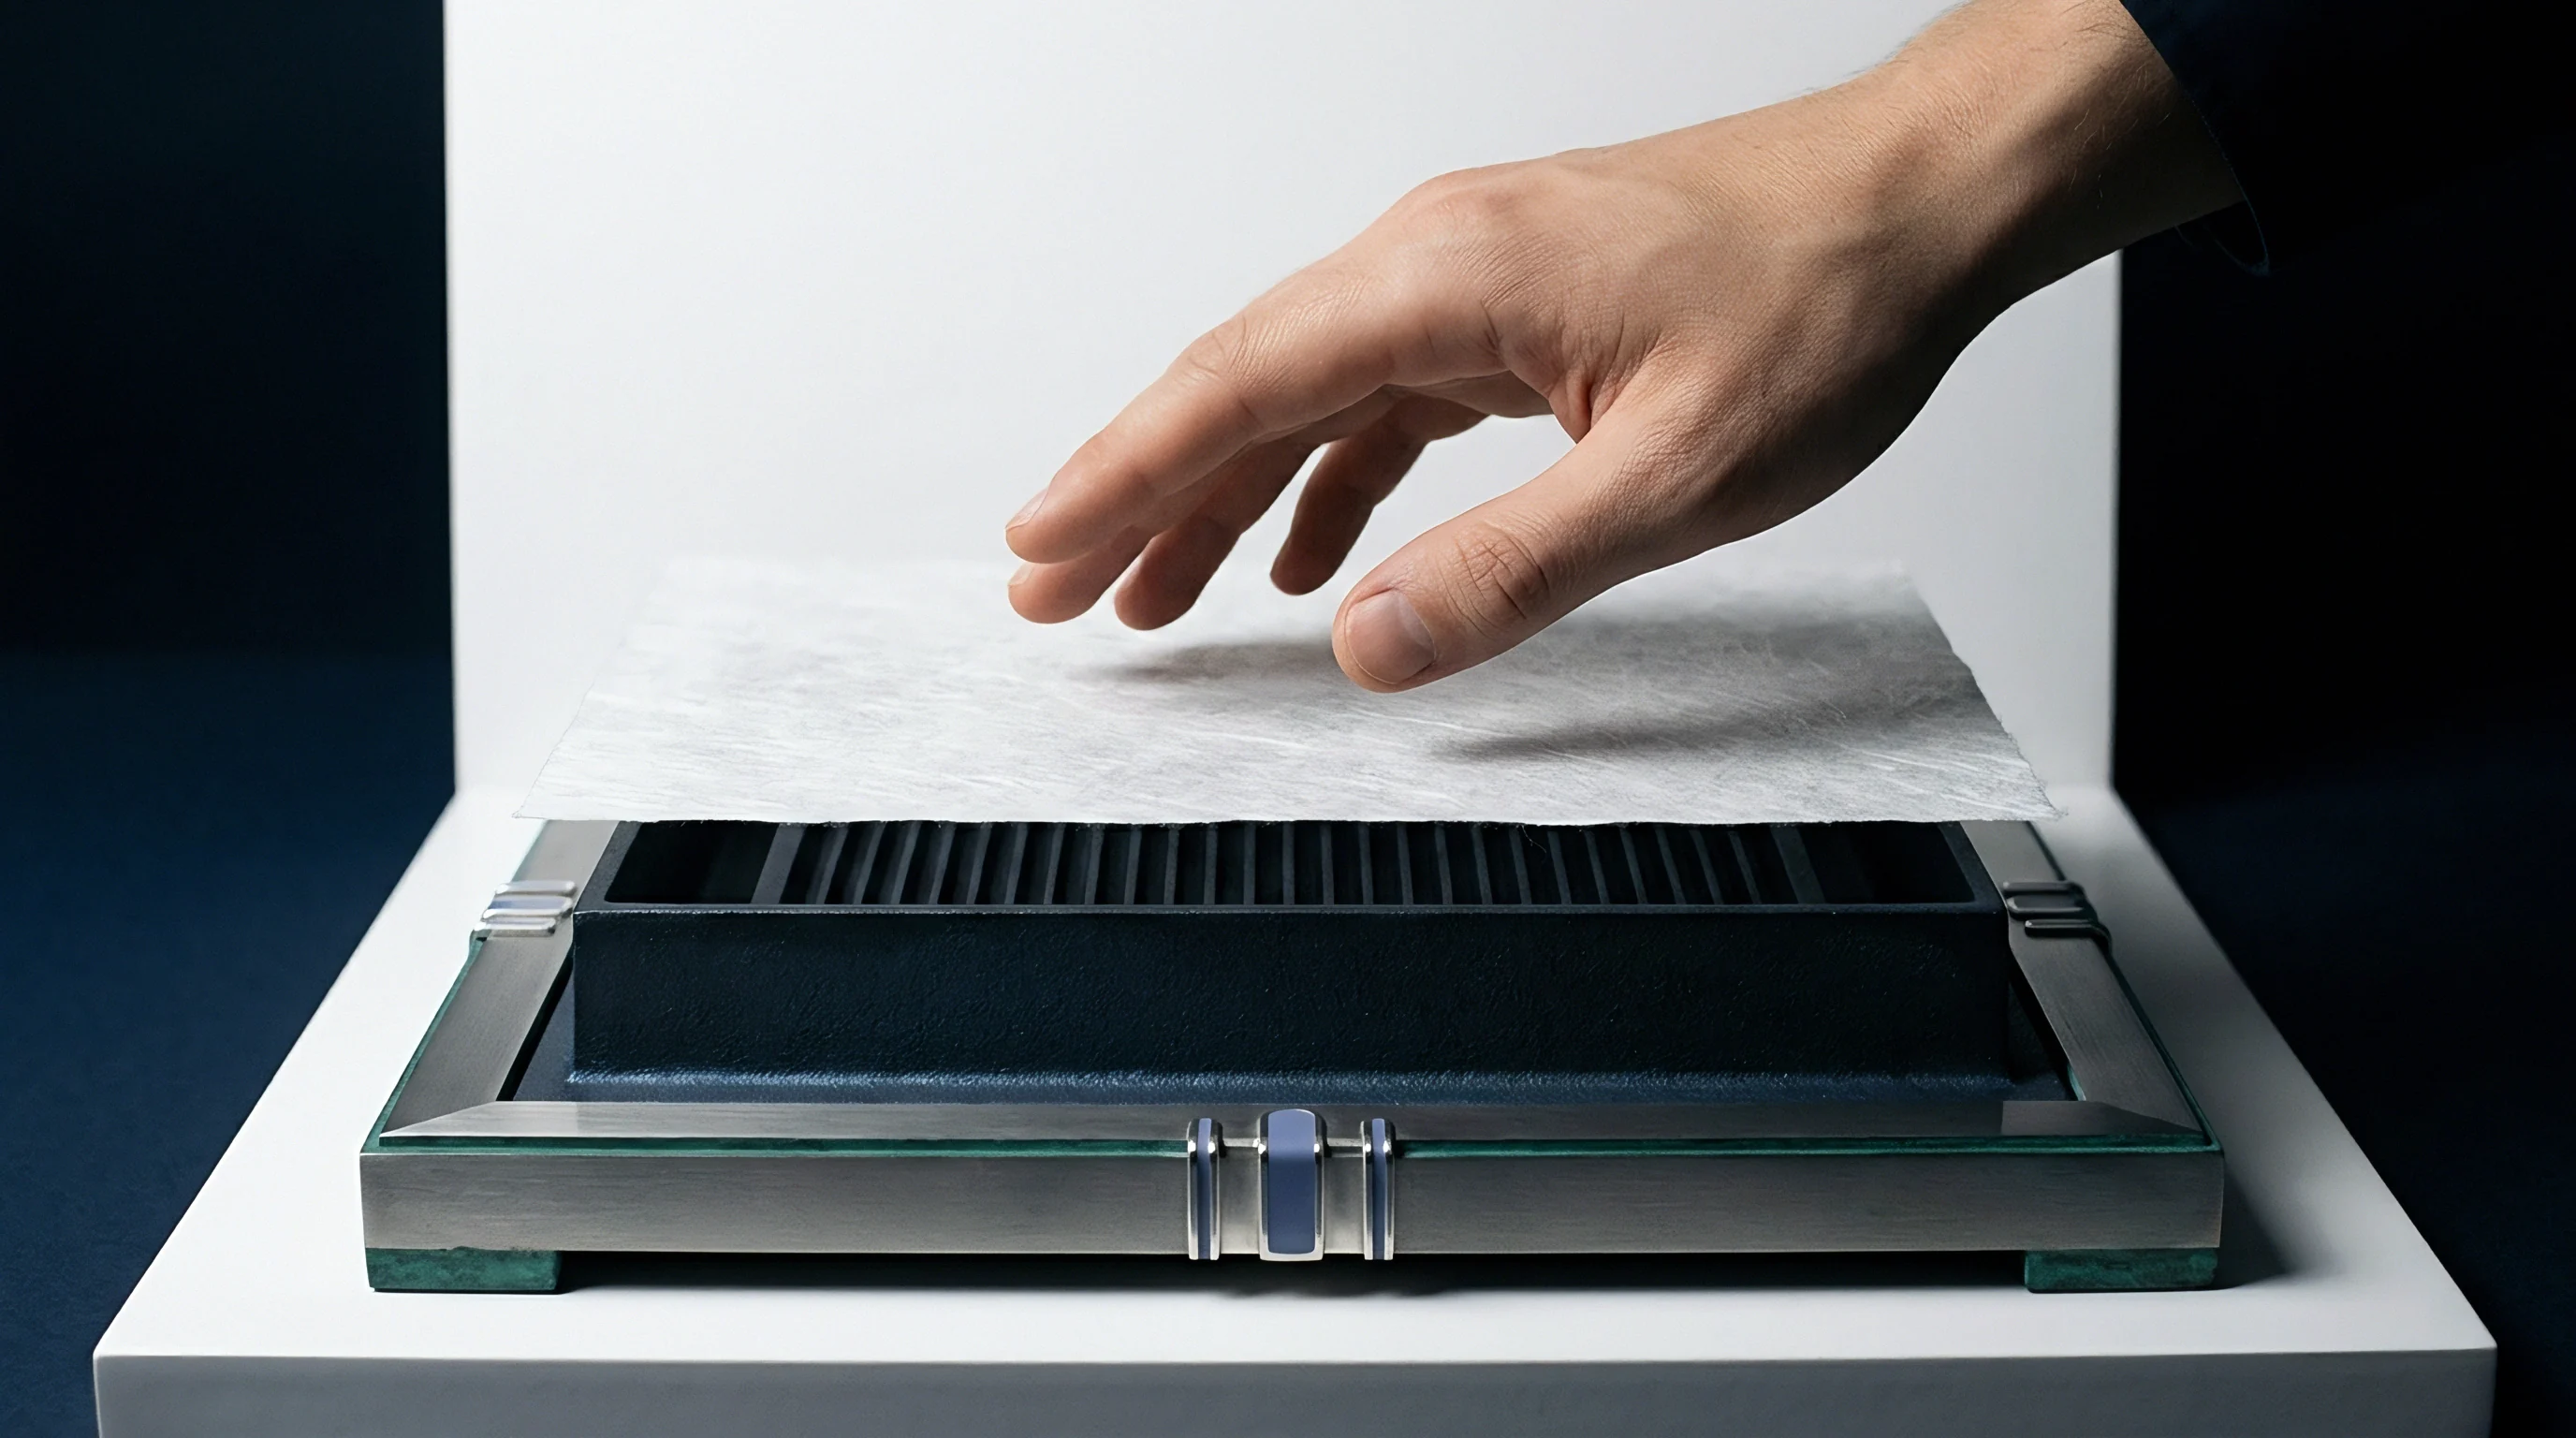
Mass Spectrometry Depth Profiling across Subterranean Nodes
Secondary ion cluster beam etching sputters atomic layers without disrupting organic polymer side chains during depth profiling. Low-energy argon gas cluster ion beams strip surface material at rates calibrated down to single nanometers per second. Simultaneous monitoring of secondary ions tracks characteristic fragment intensities as a function of depth, generating three-dimensional chemical maps through subterranean membrane networks.
Depth profiles show whether hydrophobic cross-linking penetrates internal nodal junctions or remains confined to surface boundaries. Fluorine-free alkane treatments often show steep intensity drops within the first 50 nanometers of depth when thermal curing causes surface phase separation. Maintaining balanced chemical penetration requires optimizing padder nip pressure and liquor viscosity, which can be verified directly through ToF-SIMS 3D chemical reconstructive mapping.
| Instrumental Technique | Lateral Spatial Resolution | Sampling Depth Range | Chemical Specificity Level | Sample Preparation Limit |
|---|---|---|---|---|
| X-Ray Photoelectron Spectroscopy Mapping | 10 to 15 micrometers | 2 to 10 nanometers | Elemental and chemical oxidation states | Ultra-high vacuum compatible, zero outgassing |
| ToF-SIMS Chemical Imaging | 100 to 200 nanometers | 1 to 2 monolayers (top surface) | Molecular ion fragment identification | Ultra-high vacuum, conductive mounting needed |
| FPA ATR-FTIR Micro-Spectroscopy | 3 to 5 micrometers | 0.5 to 2.0 micrometers | Functional group molecular bonding | Intimate optical contact with Ge crystal required |
| Micro-Raman Chemical Mapping | 0.5 to 1.0 micrometers | 1.0 to 10.0 micrometers | Polymer conformation and molecular bonds | Fluorescence interference from residual dyes |
Goniometric contact angle mapping complements spectroscopic imaging by recording the physical wetting response of nanoliter liquid droplets across micro-spatial grids. Automated micro-goniometers deposit deionized water drops under ten picoliters onto specific coordinates, using high-speed optical cameras to measure dynamic advancing and receding contact angles. Contact angle hysteresis, calculated as the difference between advancing and receding values, provides a direct measure of surface chemical heterogeneity and finish anisotropy.
A scope certificate issued under ISO 17025 for bulk chemical composition testing provides zero legal protection when product failure stems from sub-micron spatial finish anisotropy non-conformities.
Dynamic wetting measurements across micro-spatial grids highlight local contact angle variations that standard drop tests miss entirely. A macroscopic two-microliter drop covers thousands of structural nodes, bridging chemical voids through liquid surface tension. Picoliter droplets fit within individual node structures to measure true local surface energy.
Areas with contact angle hysteresis above 15 degrees correlate with localized finish depletion, identifying coordinates vulnerable to liquid breakthrough under mechanical stress.
Micro-Raman mapping provides additional spatial detail by capturing vibrational modes of hydrophobic polymers without requiring a vacuum environment. Using 532-nanometer green laser excitation focused through high-numerical-aperture objectives, micro-Raman mapping tracks C-H, C-F, and Si-C bands across untreated or finished membrane structures. Background fluorescence from dyes or optical brighteners can distort weak Raman signals, requiring baseline correction algorithms to isolate functional finish peaks.
Combining micro-Raman spatial maps with XPS elemental data creates a comprehensive profile of chemical distribution across complex textile geometries.
Can automated micro-spatial analytical mapping replace destructive physical hydrostatic testing during routine mill-floor quality assurance checks?


Anisotropy
Non-uniform chemical distribution across a functional fabric roll creates spatial variations in liquid repellency and vapour permeability. Quantifying micro-spatial finish anisotropy requires statistical models that convert continuous spatial arrays of chemical density or surface energy into scalar metrics. The primary challenge lies in separating high-frequency random noise from systematic spatial clustering caused by wet processing defects.
Statistical spatial autocorrelation and dispersion metrics quantify finish non-uniformity across individual web sections and full production master rolls.
The spatial Coefficient of Variation measures relative chemical dispersion across a defined coordinate grid. Calculated as the standard deviation of localized chemical concentrations divided by the spatial mean concentration, this dimensionless ratio reflects overall finish non-uniformity. Low values indicate uniform chemical distribution, while high values point to severe chemical clustering or localized finish depletion.
Spatial Coefficient of Variation thresholds directly predict whether wet-processed fabrics will maintain reliable functional performance under field exposure conditions.
Spatial autocorrelation metrics, primarily Moran’s Index, show whether coordinates with low or high chemical density gather spatially across fabric surfaces. Moran’s Index ranges from minus one to plus one. A value near plus one indicates strong spatial clustering, where areas of low finish concentration gather in defined zones to form functional chemical voids.
A value near zero indicates random dispersion, while negative values suggest checkerboard patterns. Identifying positive spatial clustering with Moran’s Index helps separate equipment defects, such as blocked padder nozzles or uneven stenter airflow, from inherent material variability.
Directional anisotropy analysis evaluates finish distribution differences between the machine direction and cross-machine direction. Longitudinal tension during padding stretches internal membrane voids and alters capillary uptake paths along the machine direction. Cross-machine variations reflect padder roll deflection, air knife temperature gradients, or stenter drying imbalances.
Calculating separate directional spatial autocorrelation values and variance ratios quantifies process-induced directional bias, guiding engineers toward specific equipment adjustments.

Can Micro-Spatial Mapping Predict Hydrostatic Pressure Failure?
Local hydro-head ratings drop below baseline specifications whenever chemical coverage dips below critical thresholds across continuous spatial domains. Small, isolated chemical defects can hold hydrostatic pressure if surrounding highly hydrophobic regions support the liquid meniscus. When micro-spatial finish anisotropy creates contiguous clusters of depleted nodes exceeding nominal pore diameters by a factor of ten, liquid water penetrates under applied pressure.
Spatial statistics identify these critical cluster dimensions before destructive water testing is performed.
Evaluating spatial defect cluster sizes requires calculating local indicator metrics of spatial association. These local statistics calculate individual significance values for every spatial coordinate in a sample grid, identifying specific high-low or low-low finish density clusters. Identifying a low-low chemical cluster that spans across multiple interconnected pore channels indicates high risk of hydrostatic pressure failure.
Mapping these critical clusters across wide fabric web widths permits selective trimming of non-conforming edge zones before final lamination and shipping.

Statistical Dispersion Metrics for Chemical Deposition
Spatial autocorrelation models isolate localized clustering from random macro-variations across wide web production runs. Establishing a robust sampling protocol requires cutting swatches across a systematic grid encompassing center, left, and right web locations. Calculating spatial metrics across these coordinates yields a complete profile of chemical application stability.
Quantifying spatial anisotropy across production lots requires following a standardized sampling and computational workflow:
- Extract representative 50-millimeter by 50-millimeter swatches from left, center, and right positions across the fabric roll width.
- Mount swatches in high-precision analytical stages for automated surface chemical mapping using XPS, FPA-FTIR, or micro-goniometry.
- Collect spectral or contact angle data across a minimum 30-by-30 spatial grid with coordinate spacing under 50 micrometers.
- Convert raw instrumental intensity values into localized chemical concentration matrices or surface energy density grids.
- Calculate the spatial mean and standard deviation across the full coordinate matrix to derive the spatial Coefficient of Variation.
- Compute the spatial weight matrix defining spatial spatial relationships between adjacent grid coordinate locations.
- Calculate Moran’s Index to determine spatial clustering intensity across the mapped micro-spatial coordinate plane.
- Compare calculated spatial metrics against defined quality control threshold limits to accept or reject the processed batch.
Audits across five consecutive rolls recorded a 34 percent coefficient of variation, which directly caused dynamic rain-test failures despite acceptable macroscopic spray ratings. This operational discrepancy highlights why relying exclusively on macroscopic quality control tests creates severe commercial liability for technical textile converters.
| Statistical Metric Name | Acceptable Uniformity Zone | Moderate Risk Zone | Critical Failure Zone | Primary Failure Mode Impact |
|---|---|---|---|---|
| Spatial Coefficient of Variation | Under 0.12 | 0.12 to 0.25 | Greater than 0.25 | Localized hydrostatic water breakthrough |
| Moran’s Spatial Index | -0.05 to +0.15 | +0.15 to +0.40 | Greater than +0.40 | Systematic chemical void cluster formation |
| Directional Variance Ratio | 0.90 to 1.10 | 0.75 to 0.89 | Under 0.75 or over 1.30 | Differential longitudinal liquid wetting |
| Surface Energy Delta Range | Under 3.0 mN/m | 3.0 to 6.0 mN/m | Greater than 6.0 mN/m | Severe contact angle hysteresis degradation |
| Methodology note: Values calculated across a 100-by-100 coordinate grid with 10-micrometer sampling pitch using FPA-FTIR integration of active finish absorption bands. | ||||
Depth-gradient anisotropy measures chemical variations occurring vertically through the membrane thickness, from upper exposed face to lower backing interface. Severe depth-gradient anisotropy occurs when wet processing parameters force hydrophobic active agents to concentrate on outer boundaries while leaving core structural nodes untreated. Subterranean depth profiles are generated using cluster ion beam ToF-SIMS depth profiling or sequential optical sectioning micro-Raman spectroscopy.
Calculating the ratio of surface chemical concentration to subterranean core chemical concentration defines the vertical anisotropy index.
A vertical anisotropy index exceeding 3.0 indicates severe surface finish segregation, leaving internal pore networks chemically untreated and vulnerable to pressure breakthrough.
High vertical anisotropy indices correlate directly with rapid functional performance loss during field laundering cycles. Surface-segregated hydrophobic finishes experience direct mechanical abrasion against washer drums, rapidly stripping outer chemical protection away. Core structural nodes contain zero hydrophobic chemical reserves to maintain repellency once outer layers degrade.
Membranes featuring uniform vertical distribution (vertical anisotropy index near 1.0) maintain hydrophobic performance even after severe physical surface abrasion, because underlying core nodes carry identical hydrophobic treatment density.
Process control parameters must maintain both lateral and vertical finish uniformity within tight tolerances. Padder roll pressure distributions, liquor temperature, drying chamber air velocities, and curing residence times influence micro-spatial finish distribution anisotropy. Operating wet processing lines outside validated process windows generates non-uniform chemical deposition patterns, triggering costly product returns and customs rejections when downstream brand verification testing uncovers functional performance failures.
Ignoring micro-spatial finish distribution anisotropy metrics during wet processing line qualification guarantees unidentifiable product failures, where shipments pass basic laboratory screening but fail catastrophically during customer field deployment.


Defect
Chemical voids and local hydrophobic degradation create functional breaches under fluid pressure. Advanced membranes must withstand harsh outdoor and industrial environments, including driving rain, oil exposure, and repeated washing. When wet finishing yields high micro-spatial anisotropy, localized weak spots become entry channels for environmental fluids.
These chemical defects compromise hydrostatic resistance, oil repellency, breathability, and long-term durability.
Hydrostatic head collapse occurs when external water pressure forces liquid through coordinates where hydrophobic finish density falls below critical levels. Under ISO 811 testing, water pressure increases at a fixed rate against clamped fabric swatches. On uniform, properly finished membranes, water droplets emerge simultaneously across the test area at high pressure.
On anisotropic membranes, water breaks through prematurely at isolated low-pressure coordinates while adjacent areas hold firm. Overall test results show low hydrostatic head values, dictated entirely by the weakest micro-spatial link.
Low surface tension oil breakthroughs occur when membranes meet synthetic fuels, skin oils, or industrial lubricants. AATCC Method 118 evaluates oil repellency using hydrocarbons with decreasing surface tension values. Fluorine-free finishes struggle to resist oils below 26 millinewtons per meter, and micro-spatial anisotropy worsens this weakness: oil spreads quickly across low-density finish coordinates, wetting underlying fibril networks and clogging breathability channels.
Breathability drops when finish application pools hydrophobic chemicals inside pore channels, causing partial or complete mechanical blockage. Finish liquor that fails to clear subterranean voids during padding or drying cures into solid polymeric plugs, stopping Knudsen diffusion. Total functional surface area for vapour transfer decreases, lowering water vapour transmission rates in ASTM E96 or ISO 11092 tests.
High micro-spatial anisotropy often produces adjacent regions of chemical voids and clogged pores, yielding fabric that leaks water while trapping perspiration.

Hydrostatic Pressure Collapse at Chemical Void Sites
Water entry pressure testing reveals liquid penetration occurring at discrete spatial coordinates rather than across uniform test faces. Microscopic inspection of failure coordinates demonstrates a clear relationship between local chemical finish depletion and premature liquid entry. When local surface energy rises above 30 millinewtons per meter due to missing hydrophobic treatment, capillary entry pressure drops to near zero for sub-micron pore openings.
The Laplace equation dictates liquid entry pressure into porous structures, where pressure equals twice liquid surface tension multiplied by the cosine of the contact angle, divided by effective pore radius. When micro-spatial finish anisotropy lowers the local contact angle below 90 degrees at specific fibril nodes, the cosine term becomes positive, changing capillary repulsion into active capillary suction. Water is drawn into internal void networks at these defective coordinates even under zero applied hydrostatic head, causing immediate fabric leakage.
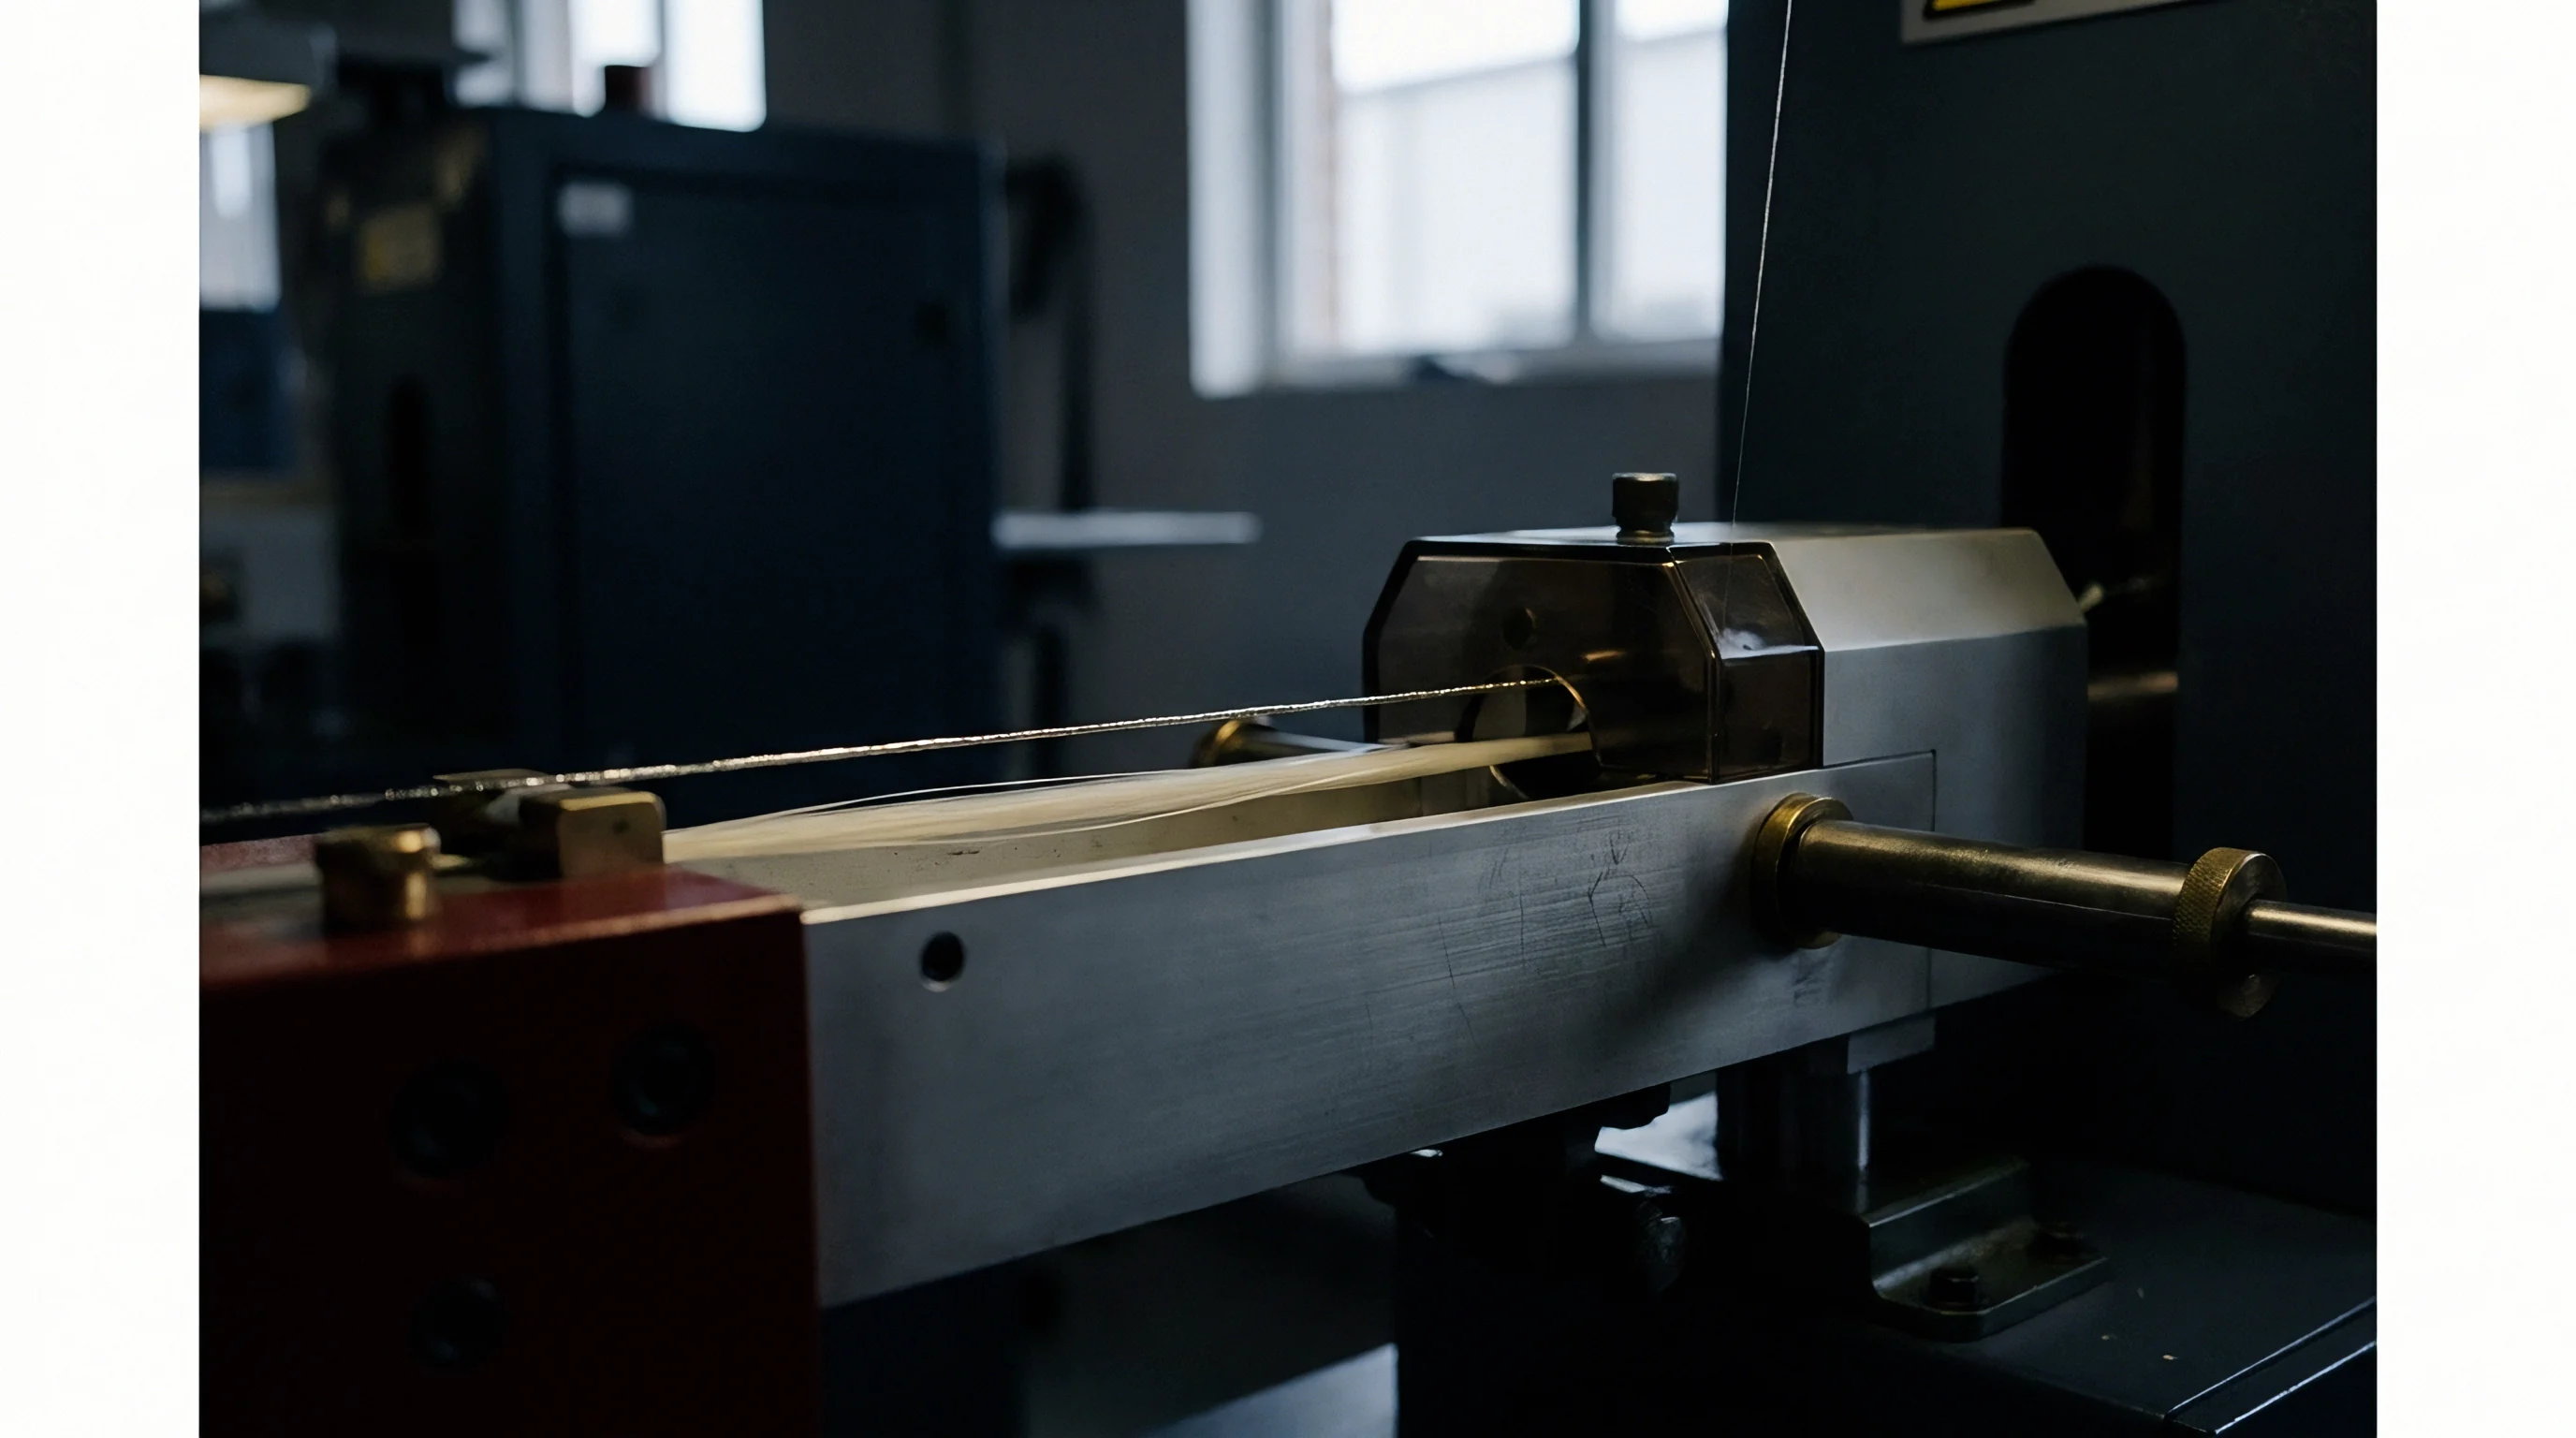
Laundering Degradation across Low-Density Boundaries
Mechanical friction and detergent surfactant exposure preferentially remove weakly bound hydrophobic treatments from high-energy surface zones. Standard accelerated laundering protocols (ISO 6330) subject functional fabrics to mechanical agitation, elevated water temperatures, and alkaline surfactant solutions. Detergent molecules adsorb onto low-density hydrophobic finish regions, lowering interfacial tension and promoting mechanical peeling of uncured finish fragments.
Post-laundering performance testing reveals severe degradation on fabrics that exhibited high initial micro-spatial finish anisotropy. Finished regions that were poorly cross-linked strip away rapidly during early wash cycles, enlarging existing chemical voids into macroscopic leak paths. Properly cross-linked, uniform finishes withstand repeated laundering, maintaining baseline water repellency through 20 to 50 wash cycles.
Evaluating post-laundering micro-spatial finish distribution isolates durable chemical bonding from temporary physical adhesion.
Similar structural collapse occurs when wet processing finishes migrate unevenly across dynamic membrane interfaces under mechanical strain.
Brand compliance desks use structured rejection protocols to isolate anisotropic batch lots during incoming material inspections:
- Hydrostatic Spot Delta Rejection occurs when five distinct hydrostatic head tests across a single roll yield values varying by more than 25 percent from the batch mean.
- Contact Angle Hysteresis Failure triggers when automated micro-goniometry measures advancing-receding contact angle differences exceeding 20 degrees across micro-spatial grid scans.
- Laundering Decay Acceleration applies when hydrostatic pressure resistance drops by more than 40 percent after five standard ISO 6330 wash cycles.
- Oil Penetration Asymmetry occurs when AATCC 118 oil repellency ratings differ by two or more grade levels between center and selvage roll locations.
Standard commercial supply contracts contain specific technical compliance clauses that govern wet processing quality standards. A typical brand procurement clause specifies:
The mill warrants that functional hydrophobic wet processing finishes shall exhibit lateral and vertical spatial uniformity, with localized hydrostatic entry pressure varying by no more than 15 percent across any two-meter cross-web section under ISO 811 testing.
Failure to meet this micro-spatial uniformity standard grants buyers immediate legal rights to reject entire master batch shipments, demand full financial reimbursement, and reallocate production supply orders to accredited alternative converters.


Proof
Verifying hydrophobic performance through documentation requires matching analytical test reports directly to physical production lots. Importers, compliance directors, and customs officials face financial risk when unbacked claims are challenged at borders or during audits. A certificate of analysis with acceptable macroscopic numbers is useless if the shipped roll suffers from severe micro-spatial anisotropy.
Batch conformity requires unbroken traceability links connecting analytical micro-spatial testing, scope-accredited laboratory reports, transaction certificates, and physical roll tags.
Scope certificates define a finishing mill’s general technical capabilities and chemical management authorizations. Issued by independent bodies under standards like OEKO-TEX STANDARD 100, bluesign, or GOTS, they confirm that a facility manages restricted substances properly. However, a scope certificate does not prove that a specific fabric batch meets micro-spatial performance specifications; assuming it guarantees functional batch quality is a common compliance oversight in sourcing.
Transaction certificates provide batch-level traceability by linking chemical treatment lots to physical yardage on commercial invoices. Each certificate lists fabric article numbers, total weight, roll identification numbers, and production dates. When functional failures occur, transaction certificates allow compliance teams to trace defective runs back to specific bath formulations and shift logs.
Without valid transaction certificates, compliance liabilities cannot be legally transferred back to the manufacturing mill.
Accredited laboratory test reports supply the physical and analytical evidence for functional claims. Testing facilities must hold formal ISO/IEC 17025 accreditation, with specific test methods listed explicitly within their audited scope schedules. A test report issued by an unaccredited laboratory or a facility whose accredited scope excludes micro-spatial chemical analytical methods holds zero legal standing during customs disputes or trademark compliance litigation.
Checking laboratory accreditation schedules represents the primary defense against falsified compliance documentation.
Laboratory Scope Gaps and Lot Conformity Verification
Accredited testing facilities issue analytical reports under strict methodological frameworks that specify lower detection thresholds, sample preparation steps, and instrumental calibration standards. A significant compliance gap arises when buyers rely on laboratory test reports that evaluated a general product type rather than the exact production lot inside the shipping container. Type approvals confirm that a mill can manufacture a compliant swatch under ideal conditions; lot conformity testing verifies that the mill actually achieved chemical uniformity across thousands of commercial yards.
Validating lot conformity requires pulling physical swatch samples directly from sealed shipping containers using statistical sampling plans based on ISO 2859-1 standards. Sampling protocols must extract swatches from outer roll ends and inner core sections across multiple master rolls. Performing analytical micro-spatial mapping (XPS or FPA-FTIR) on these verification swatches confirms whether micro-spatial finish distribution anisotropy remains within acceptable tolerance limits throughout the entire commercial shipment.

Contractual Assurance and Chemical Batch Evidence
Commercial purchase orders shift non-compliance financial exposure directly onto finishing mills through strict technical warranties. Purchase agreements must explicitly define allowable micro-spatial finish variation limits, analytical testing standards, retesting procedures, and financial indemnity penalties for non-conforming shipments. Incorporating precise technical language converts subjective quality disputes into clear contractual breach determinations.
Transaction certificates are examined alongside raw spectrographic data before batch lots clear for downstream garment assembly. When analytical data reveals high spatial variance, technical purchase order clauses dictate immediate lot detention and mandatory joint re-testing at independent ISO 17025 accredited laboratories. The mill bears all re-testing fees, freight detention charges, and financial losses resulting from delayed garment production schedules.
A simple rule of thumb guides functional textile compliance verification: trust single-point macroscopic test certificates only when accompanied by multi-coordinate micro-spatial mapping data for the specific production lot.