Empirical Derivation of Asymmetrical Parametric Weighting Vectors across Structural Surface Sheen Variations
Asymmetrical parametric weighting vectors correct for specular glare in high-sheen weaves, preventing false batch rejections and costly dyehouse re-dye cycles.


Geometry
Spectrophotometric measurement of high-luster substrates breaks down when standard symmetrical color-difference calculations meet directional surface reflectance. When measuring flat woven goods with specular gloss values exceeding 45 gloss units at a 60-degree angle under ASTM D523, the instrument detector reads a compound signal. One portion of the flux penetrates the fiber matrix, undergoing selective absorption by dyestuff molecules before scattering back toward the receiver.
The remaining flux reflects directly off the boundary layer between air and the compressed polymer surface without encountering pigment or dye. In spherical d/8 instruments operating under ASTM E1164, setting the specular port to excluded mode discards this reflected component, yet the rejection remains incomplete on structured faces with high local slope variations. Incident rays strike angled yarn crowns, reflecting specularly at angles that escape the trap and enter the integrating sphere wall.
The detector registers these errant rays as artificial lightness increases.
Standard CIEDE2000 calculations assume an isotropic distribution of error tolerances around a target point in color space. These equations assign unity values to parametric factors, setting lightness, chroma, and hue weighting scalars to equal impact. Production dyehouses running polyester filament satin or chintz-finished cotton face systematic rejection rates when grading rolls against standard digital submissions under these settings.
The human observer tilts the shiny face away from the line of specular reflection, evaluating the absorbed color yield. The spectrophotometer integrates the specular spill directly into its color coordinates. An instrument reading a positive lightness shift of 0.8 units often coincides with an auditor seeing an acceptable or even excessively deep shade, because the human eye isolates the body color while the aperture records the sheen flare.
A surface finish exceeding sixty gloss units shifts instrument lightness values upward by as much as 1.4 units while human visual appraisal registers no perceptible fade.
Calendering alters the face. The mechanical nip flattens yarn crowns, driving the local angle of incidence closer to the macroscopic plane of the goods. When measuring uncalendered twill, diffuse scattering dominates the optical return.
Once that same lot passes through heated steel bowls at 180 bar and 160 degrees Celsius, specular reflection spikes. The instrument calculates a pronounced shift in total color difference, denoted as Delta E, driven almost entirely by the lightness component. If the color lab relies on symmetric tolerances, the software generates a rejection warning.
The dyer adds shading dyestuff to darken the lot. This intervention ruins the batch, loading the substrate with unnecessary dye molecules that drop the true chroma without correcting the optical sheen artifact.
The gloss reading jumps. To resolve this measurement gap, laboratories derive separate empirical weighting vectors for positive and negative deviations across the three color dimensions. When assessing a high-sheen face, the allowable tolerance for positive lightness deviation must expand, absorbing the specular leakage that bypasses mechanical gloss traps.
Conversely, negative lightness deviation requires strict containment, because an actual physical deficit in dye yield looks muddy and flat beneath a lustrous finish. In chroma, the behavior reverses. High gloss compresses perceived saturation, demanding tighter tolerance on dullness deviations and greater permissiveness toward elevated saturation.

Specular Traps on Calendered Surfaces
Mechanical gloss traps rely on optical absorption tiles positioned along the 8-degree exit trajectory inside the integrating sphere. When light hits an isotropic matte textile, the excluded port effectively removes specular gloss. On calendered filament satin, yarn twist and weave architecture create micro-facets that scatter specular light at angles ranging between 12 degrees and 26 degrees from the normal axis.
The gloss trap fails to capture this off-axis reflection. The light strikes the barium sulfate sphere coating, distributing uniformly across the interior and illuminating the detection photodiode.
The sensor records false lightness. Comparing spectral reflectance curves between specular-included and specular-excluded modes exposes this geometry defect. A matte plain weave cotton shows a parallel downward shift across all wavelengths when switching to specular-excluded mode, maintaining curve shape.
A calendered polyester satin displays severe distortion in the short-wavelength blue region, where surface Fresnel reflection overwhelms low-level diffuse scatter from dark disperse dyes. Calibrating an asymmetrical parametric weighting vector demands collecting bidirectional reflectance distribution functions across multiple azimuthal angles relative to the warp direction.
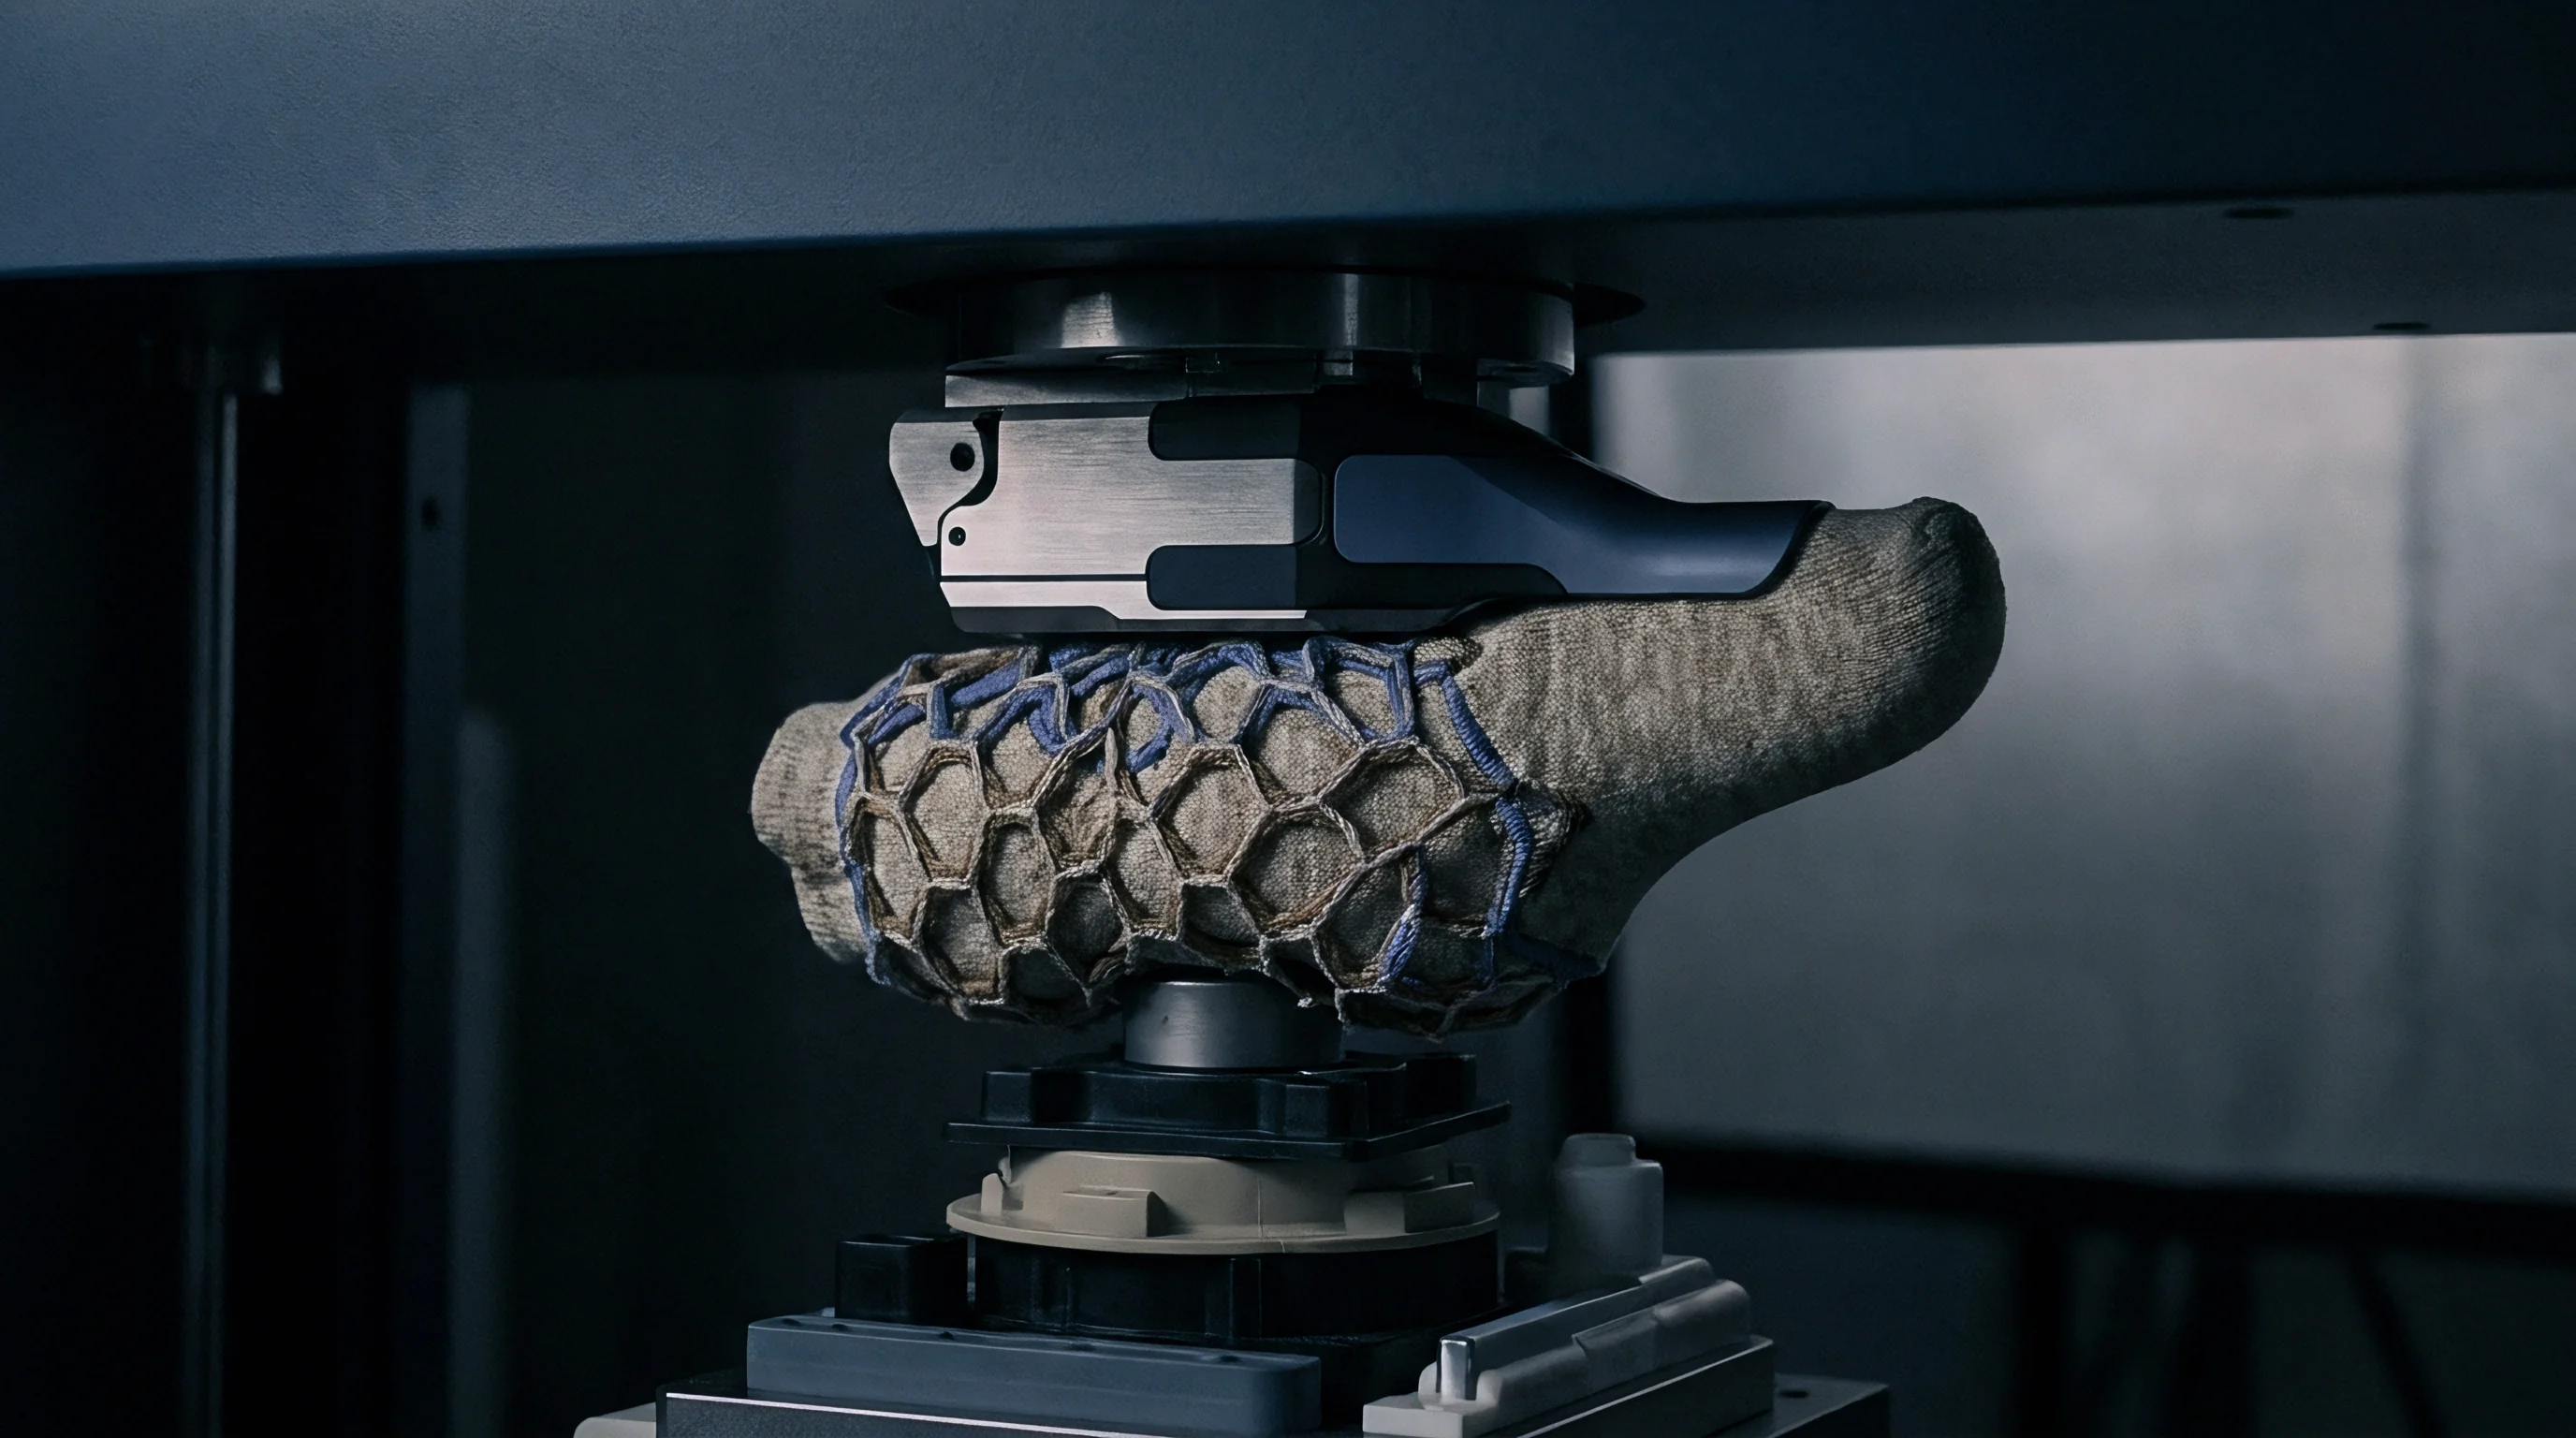
Angular Sensitivity in Dual Aperture Units
Portable 45/0 geometry instruments eliminate integrating sphere reflections by illuminating the sample at 45 degrees and collecting light perpendicular to the surface. This configuration prevents macroscopic specular reflections from reaching the sensor. Directional yarn orientation introduces a secondary variable.
Rotating a twill weave 90 degrees under a circumferential 45/0 aperture produces Delta E shifts exceeding 1.2 units purely from shadowing across the diagonal wales. The instrument interprets physical relief as chromatic difference.
Rotational positioning settles the spread. Establishing reliable color evaluation on structured surfaces requires taking four discrete readings at 0, 90, 180, and 270 degrees of specimen rotation, averaging the spectral curves before calculating colorimetric coordinates. Without this mechanical averaging, derivation of parametric vectors incorporates spatial noise rather than actual optical response.
Laboratories specifying automated grading stations must mandate rotational stages or multi-angle annular pickup arrays to stabilize raw tristimulus values before mathematical weighting begins.
Smooth surfaces reflect clean light while rough textures scatter illumination.


Float
Weave architecture dictates how incident illumination encounters the fiber substrate. In a 1/1 plain weave, warp and weft yarns cross at every pick, creating dense crowns that act as individual hemispherical scatterers. Light striking this structure scatters across a broad hemispherical solid angle.
In an 8-end warp satin, the long yarn passages skip over seven picks before interlacing. These extended floats lie parallel to one another across the textile surface, forming a quasi-continuous planar reflector. When woven from continuous filament yarns with trilobal cross-sections, these floats generate intense directional highlights along the filament axis.
Long floats magnify directional luster. Measuring such goods with a standard color-difference formula introduces systematic variance that correlates directly with pick insertion density and float span. The optical properties change drastically if the yarn shifts from dull spun ring cotton to bright trilobal polyester.
Titanium dioxide delusterant added to synthetic polymers introduces internal scattering sites within each individual filament, mitigating the float effect. When clear, non-delustered filaments are specified for technical apparel shells, the float surface acts like an array of miniature cylindrical lenses, focusing and redirecting light along discrete planar vectors.
A satin weave with a seven-yarn float length requires a positive lightness tolerance double that of a plain weave constructed from identical fiber.
The lab dip fails. The dyer matches the shade under diffuse lighting on small swatch cards where edge fraying breaks surface tension. Once the production lot passes through the loom shed and stenter frame, the uninterrupted face exhibits extreme directional sheen.
Placing this roll under inspection lights reveals severe batch-to-batch variation that eludes standard spectrophotometer passes unless the measurement procedure explicitly isolates the float vector.

Yarn Profile and Planar Reflection
Filament cross-sections govern internal refraction and surface Fresnel reflection. Circular filaments focus incident rays toward the rear boundary of the fiber, producing a narrow, intense retro-reflective band. Trilobal filaments reflect light primarily from their three planar exterior faces, creating three distinct specular lobes spaced 120 degrees apart around the fiber axis.
Modified octalobal fibers produce diffuse highlights resembling natural silk.
Filament orientation shifts the reflection. When continuous filament yarn undergoes texturing, false-twist crimping disrupts parallel alignment, turning a potentially lustrous yarn into a bulked, matte construction. The table below outlines how yarn cross-section and weave structure interact to produce measurable gloss units, dictating the necessary correction factors applied to parametric color tolerance equations.
| Construction Class | Yarn Type | Interlacing Pattern | ASTM D523 Gloss at 60° | Visual-Instrumental L Delta Offset |
|---|---|---|---|---|
| Industrial Poplin | 30/1 Ne Ring-Spun Cotton | 1/1 Plain Weave | 2.1 to 3.4 GU | +0.05 units |
| Workwear Twill | 20/10 OE Cotton/Poly | 2/1 Twill Weave | 4.2 to 6.8 GU | +0.12 units |
| Apparel Sateen | 40/1 Ne Combed Mercerized Cotton | 4/1 Warp Satin | 14.5 to 19.2 GU | +0.45 units |
| Lining Taffeta | 50D/36F Semi-Dull Polyester | 1/1 Plain Weave | 18.0 to 24.5 GU | +0.38 units |
| Technical Shell | 75D/72F Trilobal Bright Nylon | 1/1 Plain Ripstop | 38.2 to 46.0 GU | +0.82 units |
| Bridal Duchess | 100D/96F Bright Polyester | 8-End Satin Float | 62.0 to 74.5 GU | +1.35 units |
Textile finishers know that mechanical tension during drying alters float orientation. If the stenter frame applies excessive warp tension, the floats pull taut, aligning their reflective facets and elevating surface gloss by up to fifteen percent. When tension relaxes, yarn crimp increases, causing the floats to cockle and scatter light diffusely.
Color quality control procedures must account for this mechanical state before running spectral analyses, otherwise finishing line tension variations masquerade as chemical dyeing unlevelness.

Sateen Interlacing Density
Mercerization of cotton sateen introduces an additional structural transformation. Swelling cotton fibers under caustic soda tension unwinds natural fiber convolutions, converting flat ribbon-like lumens into rounded cylinders. This physical rounding increases specular reflectance across the exposed yarn floats.
The finishing plant produces a textile with heightened visual contrast between warp floats and weft interlacings.
Specular reflections blind the sensor. When testing mercerized sateen, standard CIELAB equations show high sensitivity to minor dye concentration variations because the human eye tolerates noticeable lightness shifts on the shiny face while rejecting minor hue shifts. The mill dyer encounters batches that pass digital quality thresholds yet fail final visual inspection under standard illumination.
The weaver explains that loom stop-marks create local float distortions that change gloss rather than color yield.


Formulation
Mathematical derivation of asymmetrical parametric weighting vectors requires abandoning the assumption of spherical or ellipsoidal symmetry in perceptual color space. CIEDE2000 defines total difference through three primary components: lightness difference modified by factor S_L, chroma difference modified by factor S_C, and hue difference modified by factor S_H, with parametric scaling variables k_L, k_C, and k_H. Standard colorimetric operations set k_L, k_C, and k_H to 1.0 for close-tolerance industrial applications, or k_L to 2.0 for textile substrates displaying prominent texture.
These settings assume that positive and negative deviations from the standard carry identical visual weights.
Empirical evidence collected across thousands of visual assessments on lustrous goods disproves this symmetry. Observers tolerate significantly greater positive lightness differences (where the batch appears brighter than the target) on high-gloss substrates than negative lightness differences (where the batch appears darker). The sheen itself creates a perceptual baseline of elevated brightness, causing positive instrumental lightness shifts to blend into the structural highlights.
A negative lightness shift disrupts this highlight structure, causing the human eye to perceive the material as dirty, flat, or undertreated.
A contract clause rejecting goods at a symmetrical total color difference of 0.8 units penalizes acceptable glossy production while passing unacceptable dull yardage.
To mathematically capture this asymmetry, the scalar factor k_L must separate into two distinct vector components based on the algebraic sign of the measured difference. Let Delta L_prime represent the calculated lightness difference in the revised color space. When Delta L_prime is greater than zero, the positive parametric weight vector applies.
When Delta L_prime is less than zero, the negative parametric weight vector governs the calculation.

Asymmetrical Chroma Expansion Coefficients
Color saturation behaves with similar directional bias under high-sheen conditions. On a matte surface, an increase in chroma (Delta C_prime greater than zero) is immediately detected because color concentration pops against the diffuse, scattered background. On a high-sheen satin face, surface reflections desaturate the perceived color, washing out chromatic intensity under direct illumination.
Observers demonstrate greater tolerance for elevated chroma batches, which compensate for surface washout, while reacting harshly to negative chroma shifts that amplify dullness.
Luster suppresses perceived chroma variance. Deriving the asymmetrical vectors involves running controlled psychophysical visual pass-fail experiments across gray scales and chromatic ladders. The following numbered sequence details the operational protocol required to extract these asymmetrical weighting coefficients from physical batch data.
- Substrate Grouping establishes baseline gloss categories by measuring sixty-degree specular reflectance across three hundred production lots to define discrete surface sheen tiers.
- Chromatic Ladder Dyeing generates paired shade samples spanning systematic lightness, chroma, and hue steps from minus two units to plus two units around target production shades.
- Visual Panel Appraisal secures independent pass-fail decisions from a panel of eight qualified colorists viewing the pairs in a standardized cabinet under controlled illumination.
- Logistic Regression Modeling calculates the fifty percent acceptance probability threshold for positive and negative deviations across each colorimetric axis independently.
- Scalar Optimization adjusts directional k-factors to minimize discordance between digital pass-fail flags and human observer acceptance rates across the target gloss tier.
The resulting mathematical formulation replaces static scalars with dynamic functions tied to surface gloss readings. The table below details the derived asymmetrical parametric weighting values established across distinct gloss ranges, demonstrating the departure from standard textile industry defaults.
| Surface Gloss Band (60°) | Positive Lightness Vector (k_L+) | Negative Lightness Vector (k_L-) | Positive Chroma Vector (k_C+) | Negative Chroma Vector (k_C-) | Hue Vector (k_H) |
|---|---|---|---|---|---|
| 0 to 10 GU (Matte Spun) | 1.05 | 1.02 | 1.00 | 1.00 | 1.00 |
| 11 to 25 GU (Semi-Lustrous Twill) | 1.25 | 1.05 | 1.10 | 0.95 | 1.00 |
| 26 to 50 GU (High-Twist Satin) | 1.60 | 1.10 | 1.25 | 0.90 | 1.05 |
| 51 to 75 GU (Calendered Filament) | 2.10 | 1.15 | 1.45 | 0.85 | 1.10 |
| Above 75 GU (Resin Chintz / Film) | 2.45 | 1.20 | 1.60 | 0.80 | 1.15 |
The data confirms that as specular gloss rises, the positive lightness factor k_L+ expands past 2.0, while the negative lightness factor k_L- remains tightly anchored near 1.15. Setting a single k_L factor of 2.0 across all calculations, as suggested in general textile standards like ISO 105-J03, introduces substantial error. It over-tolerates dark, dingy lots while over-rejecting clean, bright lots that merely exhibit elevated surface sheen.
Directional Lightness Attenuation Bands
Hue angle interactions also shift when measuring saturated deep shades like navy, burgundy, and forest green on high-sheen substrates. Surface sheen flattens the perceived hue distinction between adjacent color spaces. An observer looking at a glossy navy blue tolerates minor shifts toward red-violet if the surface gloss remains exceptionally high, yet rejects identical shifts if the surface appears hazy or scratched.
High gloss penalizes dark shades. Surface haze scatters white light across the upper visual field, dropping the effective depth of shade and inducing an apparent hue drift toward dull gray. The asymmetrical vector framework compensates by weighting hue deviations proportionally to measured surface micro-roughness.
If the non-contact profilometer detects surface irregularities exceeding three microns on a calendered goods run, the hue scalar k_H contracts, enforcing stricter limits on chromatic deviation.
Whether physical optical physics can ever be fully reconciled with non-linear human neural perception across the transition boundary where matte texture yields to pure specular gloss remains an open debate in industrial colorimetry.


Bench
Practical execution of color measurement on high-luster piece goods exposes major gaps between controlled laboratory benches and continuous production lines. In the dyehouse dispensary, technicians prepare recipes using small swatches conditioned at standard temperature and relative humidity under ISO 139. When bulk rolls arrive at the continuous inspection frame, processing tensions stretch the web, compressing the weave crimp and altering the instantaneous angle of specular return.
If the automated bench spectrophotometer evaluates the goods without replicating the tension and illumination geometry of the inspection table, the resulting data fails to correlate with visual grading.
The cutter stops the line. Bulk roll cutting rooms reject yardage that passed digital bench release criteria because multi-panel garments place cut pieces at right angles to one another. An asymmetrical tolerance vector derived along the warp axis fails along the weft axis if the weave architecture features distinct warp and filling faces.
Sateen weaves, cross-twills, and ripstop patterns exhibit radical angular anisotropy. Production testing protocols must establish fixed mechanical positioning fixtures that align sample roll orientation relative to the optical plane of the sensor aperture.
Operator Perception against Diffuse D65
Visual inspection cabinets conform to ASTM D1729 specifications, providing standardized CIE Illuminant D65 daylight simulation alongside Illuminant A tungsten illumination to assess metamerism. The geometry of the viewing cabinet introduces another source of variance. The overhead diffused light source illuminates the specimen from above, while the human inspector views the tilted tray at approximately 45 degrees.
On a high-gloss textile, moving the head three inches forward or backward shifts the eye into or out of the specular glare zone.
The tolerance window collapses. An experienced auditor naturally angles the viewing tray to dump the glare out of the field of vision, seeking the true absorption spectrum of the dyestuff matrix. A fixed-aperture bench spectrophotometer cannot reposition itself dynamically.
It records whichever rays enter its port. When mills implement asymmetrical parametric weighting, they align the mathematical model with the physical habit of the human inspector. The table below documents the concordance between instrumental pass-fail decisions and visual panel verdicts under varying mathematical configurations on calendered nylon taffeta.
| Evaluation Model Applied | Parametric Settings | Instrument False Rejections | Instrument False Acceptances | Visual-Instrumental Concordance |
|---|---|---|---|---|
| Standard CIELAB | Symmetric k = 1.0 | 31.5% | 4.2% | 64.3% |
| Standard CIEDE2000 | Symmetric k = 1.0 | 24.8% | 3.5% | 71.7% |
| Textile Industry Standard | Symmetric k_L = 2.0, k_C = 1.0 | 8.2% | 14.8% | 77.0% |
| Asymmetrical Vector Model | Gloss-Indexed Asymmetric Vectors | 2.1% | 1.8% | 96.1% |
The data confirms that symmetric textile defaults (k_L = 2.0) lower false rejections only by introducing dangerous false acceptances. Under that configuration, 14.8 percent of production rolls pass instrumental grading but fail garment assembly because dark, thin dyeings slip through the widened lightness gate. The asymmetrical vector model eliminates these false acceptances by clamping negative lightness deviations while granting necessary latitude to positive sheen artifacts.

Rotational Invariance Failures
Textile testing laboratories that operate without rigid sample mounting protocols generate irreproducible data on shiny materials. When an operator places a swatch on the measuring port, slight differences in hand pressure alter pile compression, yarn flattening, and contact angle. On a glossy polyester warp knit, pressing the sample firmly against the aperture glass increases measured specular return by five to eight percent compared to a light clamp touch.
Batch rejections multiply rapidly. The following failure modes routinely corrupt optical measurements on sheen-variable substrates during bulk qualification runs.
- Aperture Pillowing occurs when flexible goods bulge into the sphere port, changing the focal plane distance and distorting reflectance readings across all wavelengths.
- Azimuthal Misalignment happens when testing personnel position consecutive roll cuttings at mismatched weave angles relative to the instrument optical axis.
- Static Surface Charge attracts airborne particulate matter to synthetic filament faces, creating localized scattering points that degrade surface gloss readings.
- Thermal Relaxation takes place when measuring freshly dried hot yardage straight from the stenter before ambient moisture regain stabilizes the fiber refractive index.
When wet processing mills ignore these mechanical bench constraints, shade consistency claims fail in third-party testing labs, triggering payment stoppages, chargebacks, and dead inventory balances that converters cannot recover.


Ledger
Colorimetric accuracy dictates commercial survival in commission dyeing and finishing. When purchase orders define color matching under standard CIEDE2000 symmetric parameters with a hard pass-fail threshold of Delta E less than 0.8, the finishing mill faces high operational rejection rates on bright filament goods. Reworking off-shade synthetic fabrics through dye stripping and re-dyeing degrades tensile properties, damages yarn luster, and consumes thermal energy.
A lot that fails instrumental inspection due to surface sheen artifacts often represents chemically perfect shade yield.
The margin disappears. Re-dyeing a 10,000-meter batch of polyester satin adds approximately 0.28 dollars per meter in dyehouse processing costs, freight shuttles between warehouses, and lost production capacity. If the dyer strips the goods, the harsh hydro-sulfite chemistry strips the optical brighteners and destroys filament hand.
The cloth ends up graded as second quality, taking a thirty to forty-five percent valuation cut on the spot market. Incorporating asymmetrical parametric vectors into the purchase specification directly shields the dyer and buyer from these phantom defects.
A production run stripped and re-dyed to correct an instrument lightness artifact loses twenty percent of its tear strength while doubling total wet processing expenses.
Supply agreements must explicitly tie pass-fail tolerance envelopes to structural surface sheen. A technical buyer who understands the interaction between float architecture, finishing calenders, and spectrophotometer geometry structures RFQs with segmented tolerance tables. If the contract defines a blanket Delta E limit without indexing k-factors to measured gloss units, the mill builds a defensive risk premium into its base pricing, adding five to eight percent per finished meter to cover expected dispute rates.
Dispute Settlement on Shaded Yardage
When shipments reach destination distribution centers, incoming quality control teams pull cut swatches from ten percent of rolled goods under ISO 2859-1 acceptance sampling plans. If receiving inspectors test these swatches using desktop spectrophotometers configured with symmetric unity vectors, they flag acceptable lots for containment. The forwarder holds the shipment, demurrage charges accumulate at the port, and downstream cut-and-sew factories face production downtime.
Tristimulus values drift under tension. Resolving such commercial disputes requires pulling historical retain swatches from both greige preparation and finished roll stages. If laboratory cross-checks demonstrate that the shade variance is isolated to positive lightness deviation on lots with gloss readings above forty units, the dispute arbitrates in favor of batch acceptance.
The table below illustrates the cost-benefit analysis of deploying an asymmetrical tolerance specification versus standard symmetric grading across an annual volume of 500,000 meters of high-luster performance outerwear textiles.
| Operational Cost Category | Symmetric Tolerance Standard (Delta E < 0.8) | Asymmetrical Sheen-Indexed Vector Model | Annual Net Variance |
|---|---|---|---|
| Initial Lot Rejection Rate | 14.2% (71,000 meters) | 2.4% (12,000 meters) | -59,000 meters saved |
| Direct Dyehouse Rework Costs | $19,880 ($0.28 / meter) | $3,360 ($0.28 / meter) | $16,520 savings |
| Secondary Market Markdowns | $42,600 (3% salvage rate) | $7,200 (0.5% salvage rate) | $35,400 savings |
| Third-Party Arbitration Fees | $12,500 (5 disputes) | $0 (0 disputes) | $12,500 savings |
| Garment Factory Downtime Claims | $28,400 (penalties paid) | $2,100 (isolated minor claim) | $26,300 savings |
| Net Annual Financial Cost | $103,380 | $14,760 | $88,620 profit retention |
The arithmetic proves that precision colorimetry protects operating margin. The financial risk of disputed yardage drops by over eighty-five percent when the specification accounts for structural reflection. Buyers who insist on rigid, outmoded symmetric tolerances end up paying for the resulting mill re-dyes through inflated purchase orders.

Contract Adjustments for Calender Tolerances
Purchasing contracts covering glazed, chintz, or cire textiles must detail both the colorimetric formula and the mechanical test geometry used for lot release. Specifying only CIEDE2000 leaves the mill exposed to whichever default profile the destination laboratory has installed in its software. A clear contract specifies aperture dimension, specular port setting, rotational averaging steps, and the exact asymmetrical vector matrix corresponding to the product gloss specification.
Dull yarns disperse the beam. Master procurement contracts protect both parties by incorporating specific operational wording governing optical lot acceptance: “All dyed and finished piece goods exhibiting a 60-degree specular gloss equal to or exceeding 30 gloss units under ASTM D523 shall be evaluated for commercial color match using the CIEDE2000 color difference formula configured with asymmetrical parametric weighting factors k_L+ = 1.80, k_L- = 1.10, k_C+ = 1.30, k_C- = 0.90, and k_H = 1.05, replacing all general symmetric tolerance defaults and establishing definitive legal acceptance criteria for lot release.”