Quantifying Inter Laboratory Reflectance Measurement Divergence under Variable UV Filtering and Thermal Drift
Spectrophotometer UV cutoff variations and port thermochromism cause up to 1.2 DE2000 inter-lab divergence, demanding strict ISO 105-J02 calibration standards.


Optics
Spectrophotometric color matching across overseas supply chains encounters immediate instability when light sources diverge across the near-ultraviolet boundary. Two laboratories measuring the exact same dyed swatch frequently report conflicting color coordinates. The root mechanism centers on how different benchtop spectrophotometers filter energy below 400 nanometers.
Standard illuminant D65 includes significant energy in the ultraviolet range from 300 to 400 nanometers. When evaluating textiles treated with optical brightening agents or fluorescent whitening agents, that incident ultraviolet radiation stimulates blue fluorescence emission. Variations in physical glass filters, lamp discharge envelopes, and cutoff points shift the excitation energy delivered to the specimen.
Cutoff filters degrade with age. Solarization of optical glass components occurs under continuous pulsed xenon exposure. This physical deterioration shifts the nominal 400-nanometer or 420-nanometer transmission cutoff toward longer wavelengths over thousands of measurement cycles.
A filter intended to exclude all radiation below 400 nanometers begins attenuating energy at 410 nanometers. The resulting reflectance curves diverge dramatically in the blue spectral region between 420 and 460 nanometers. Technicians interpreting the output see an apparent shade difference where none exists in the textile material itself.
A spectrophotometer calibrated on cold glass yields false passes the moment a warm production roll meets the port.
Physical Divergence across Spectral Cutoff Boundaries
Automated benchtop sensors separate incident illumination into discrete nanometer intervals to calculate tristimulus coordinates. In standard commercial practice, three distinct optical configurations dictate ultraviolet inclusion: ultraviolet-included, ultraviolet-excluded, and calibrated ultraviolet. Ultraviolet-included modes expose the sample to the raw, unfiltered emission of the light source, capturing maximum fluorescence excitation.
Ultraviolet-excluded modes introduce a mechanical barrier filter, typically at 400 or 420 nanometers, blocking shorter wavelengths to isolate base substrate reflectance.
Divergence emerges when comparing results across these configurations. A 420-nanometer cutoff filter removes not only ultraviolet energy but also the high-energy violet tail of the visible spectrum. This violet absorption suppresses the excitation of stilbene-derived brighteners common in cellulosic finishing.
The spectrophotometer registers a lower reflectance value in the violet-blue transition band. When Laboratory A employs a 400-nanometer cutoff while Laboratory B runs a 420-nanometer filter, the reported CIE whiteness values diverge by up to twelve units on identical bleached goods. Visual inspection confirms the divergence.
The instruments disagree because the optical geometries sample fundamentally different energy profiles.
Fluorophore Excitation in Commercial Xenon Illuminators
Continuous flash systems emit brief, intense bursts of radiant energy spanning 360 to 740 nanometers. The discharge arc generates significant radiant flux in the near-ultraviolet band. Unlike continuous tungsten-halogen lamps, which require heavy daylight-conversion filtering, xenon sources provide a closer raw approximation to natural daylight phase D65.
Even between xenon-equipped instruments from different manufacturers, peak emission spikes between 360 and 380 nanometers show marked physical variation. These spectral spikes directly influence the quantum yield of fluorescent whitening chemistries embedded within textile yarns.
Stilbene molecules saturate under continuous flux. When an instrument delivers high flash energy over a microsecond pulse duration, localized fluorophore saturation can occur at the textile surface. This saturation temporarily suppresses quantum conversion efficiency.
A competing spectrophotometer utilizing a dual-flash or lower-intensity lamp envelope excites the same fluorophores within their linear response regime. The second instrument records elevated fluorescence emission, misinterpreting the physical response as a higher concentration of chemical brightener in the batch. Incorporating ISO 105-J02 Section 6.2 into the master purchase contract binds both testing laboratories to standardized fluorophore reference calibration, removing uncalibrated instrument filters as valid grounds for shade rejection.

Heat
Temperature discrepancies between testing facilities alter the electronic state of organic dyes before the first photon strikes the sensor. Color measurement relies on steady-state molecular absorbance. Environmental heat, ambient humidity, and conductive energy from spectrophotometer apertures alter how chromophore electron clouds absorb light.
Conditioning rooms operating outside the strict ISO 139 standard atmosphere of 20 degrees Celsius and 65 percent relative humidity introduce substantial measurement error. When cloth moves directly from an air-conditioned laboratory to an unconditioned mill inspection room at 34 degrees Celsius, reflectance curves drop across specific absorption bands.
Hot goods reflect longer wavelengths. Thermochromism describes the reversible change in color exhibited by a dyed textile as its temperature rises. This behavior stems from thermal expansion of the dye-fiber polymer matrix, coupled with increased vibrational energy in conjugated double bonds.
As ambient thermal energy increases, dye absorption bands widen and their peak absorption shifts toward longer wavelengths, a phenomenon known as a bathochromic shift. A brilliant scarlet dyestuff shifts toward dull orange-red when warmed. If the spectrophotometer captures data while the cloth remains warm from handling or mechanical drying, the measured CIELAB coordinates drift significantly from the true conditioned shade.
Specimen port temperature elevation of six degrees Celsius produces a CIELAB DE2000 shift exceeding 0.45 units on direct turquoise cellulosic weaves.
How Do Flash Lamps Shift Specimen Surface Temperature?
Repeated optical pulses deposit kinetic energy directly into dyed cellular matrices during high-throughput testing cycles. Each high-intensity xenon burst expels thermal energy alongside visible and ultraviolet radiation. While a single flash creates minimal heating, commercial testing routines dictate averaging three to five successive flashes per location to smooth out surface texture artifacts.
The aperture plate traps warmth. Conductive transfer from internal flash lamp housings raises the metallic specimen port ring temperature by four to nine degrees Celsius above ambient room air.
Polyester disperses heat slower than cotton. Synthetic filaments held tightly against a heated metallic aperture experience rapid localized warming during multi-flash averaging cycles. As the surface heats up, the chromophores embedded within disperse dye aggregates undergo thermal excitation.
By the fourth flash, the spectrophotometer records a composite reflectance value that reflects a shifting thermal profile rather than a static material property. Technicians rotating the sample across four quadrants inadvertently measure a progressively warmer specimen, compounding error into the final averaged colorimetric dossier.

Thermochromic Spectral Slopes in Sensitive Chromophores
Certain dyestuff groups experience reversible shifts in light absorption when environmental conditions warm up during evaluation. Azo and anthraquinone dyes show varying sensitivity depending on their specific molecular structure. Direct turquoise and reactive blue dyes based on copper phthalocyanine cores exhibit noticeable thermal drift in cellulosic goods.
High ambient heat causes dehydration of the fiber, altering the refractive index of the surrounding cellulose matrix and accelerating the apparent shade shift.
Moisture loss alters fiber scattering. When textile materials lose conditioned equilibrium moisture content under the hot lamp beam, internal light scattering increases. The substrate appears lighter and less saturated.
A batch of navy cotton poplin measured at 18 degrees Celsius and 65 percent humidity registers as acceptable. The same batch measured in an overseas supplier laboratory at 32 degrees Celsius and 45 percent humidity exhibits a color difference exceeding 0.8 DE2000 units, pushing the lot outside commercial tolerance boundaries.
| Substrate and Dyestuff Class | Initial Temperature (°C) | Final Port Temperature (°C) | CIELAB DE2000 Drift | Primary Wavelength Shift (nm) |
|---|---|---|---|---|
| 100% Cotton Poplin Reactive Turquoise Blue 21 | 20.1 | 27.8 | 0.62 | +4.2 |
| 100% Cotton Twill Vat Olive Green 1 | 20.3 | 28.1 | 0.28 | +1.8 |
| 100% Polyester Jersey Disperse Red 60 | 20.0 | 29.4 | 0.74 | +5.1 |
| 100% Polyamide Tricot Acid Red 299 | 20.2 | 28.5 | 0.51 | +3.6 |
| 100% Polyester Microfiber Disperse Yellow 54 | 20.1 | 29.2 | 0.83 | +6.4 |
Failure in physical handling procedures during roll audit routines creates unrepeatable measurement drift across parallel facilities.
- Aperture conduction heating occurs when aluminum sample clamps retain radiant thermal energy from internal electronics, elevating local cloth temperature during static clamping cycles.
- Premature roll unpackaging exposes conditioned textile cores to humid ambient dock environments before thermal and moisture equilibrium finishes establishing throughout the roll layers.
- Excessive flash repetition stacks radiative heat pulses faster than the internal yarn capillaries can dissipate energy into the surrounding air stream.
- Unequal operator pressure changes fiber compaction over the aperture plate, modifying surface scattering coefficients alongside localized contact conduction rates.
Failure to control specimen port thermal transfer forces unnecessary dyehouse re-dips, stripping hundreds of thousands of dollars in profit through unearned production delays and damaged dye formulations.

Fluorophore
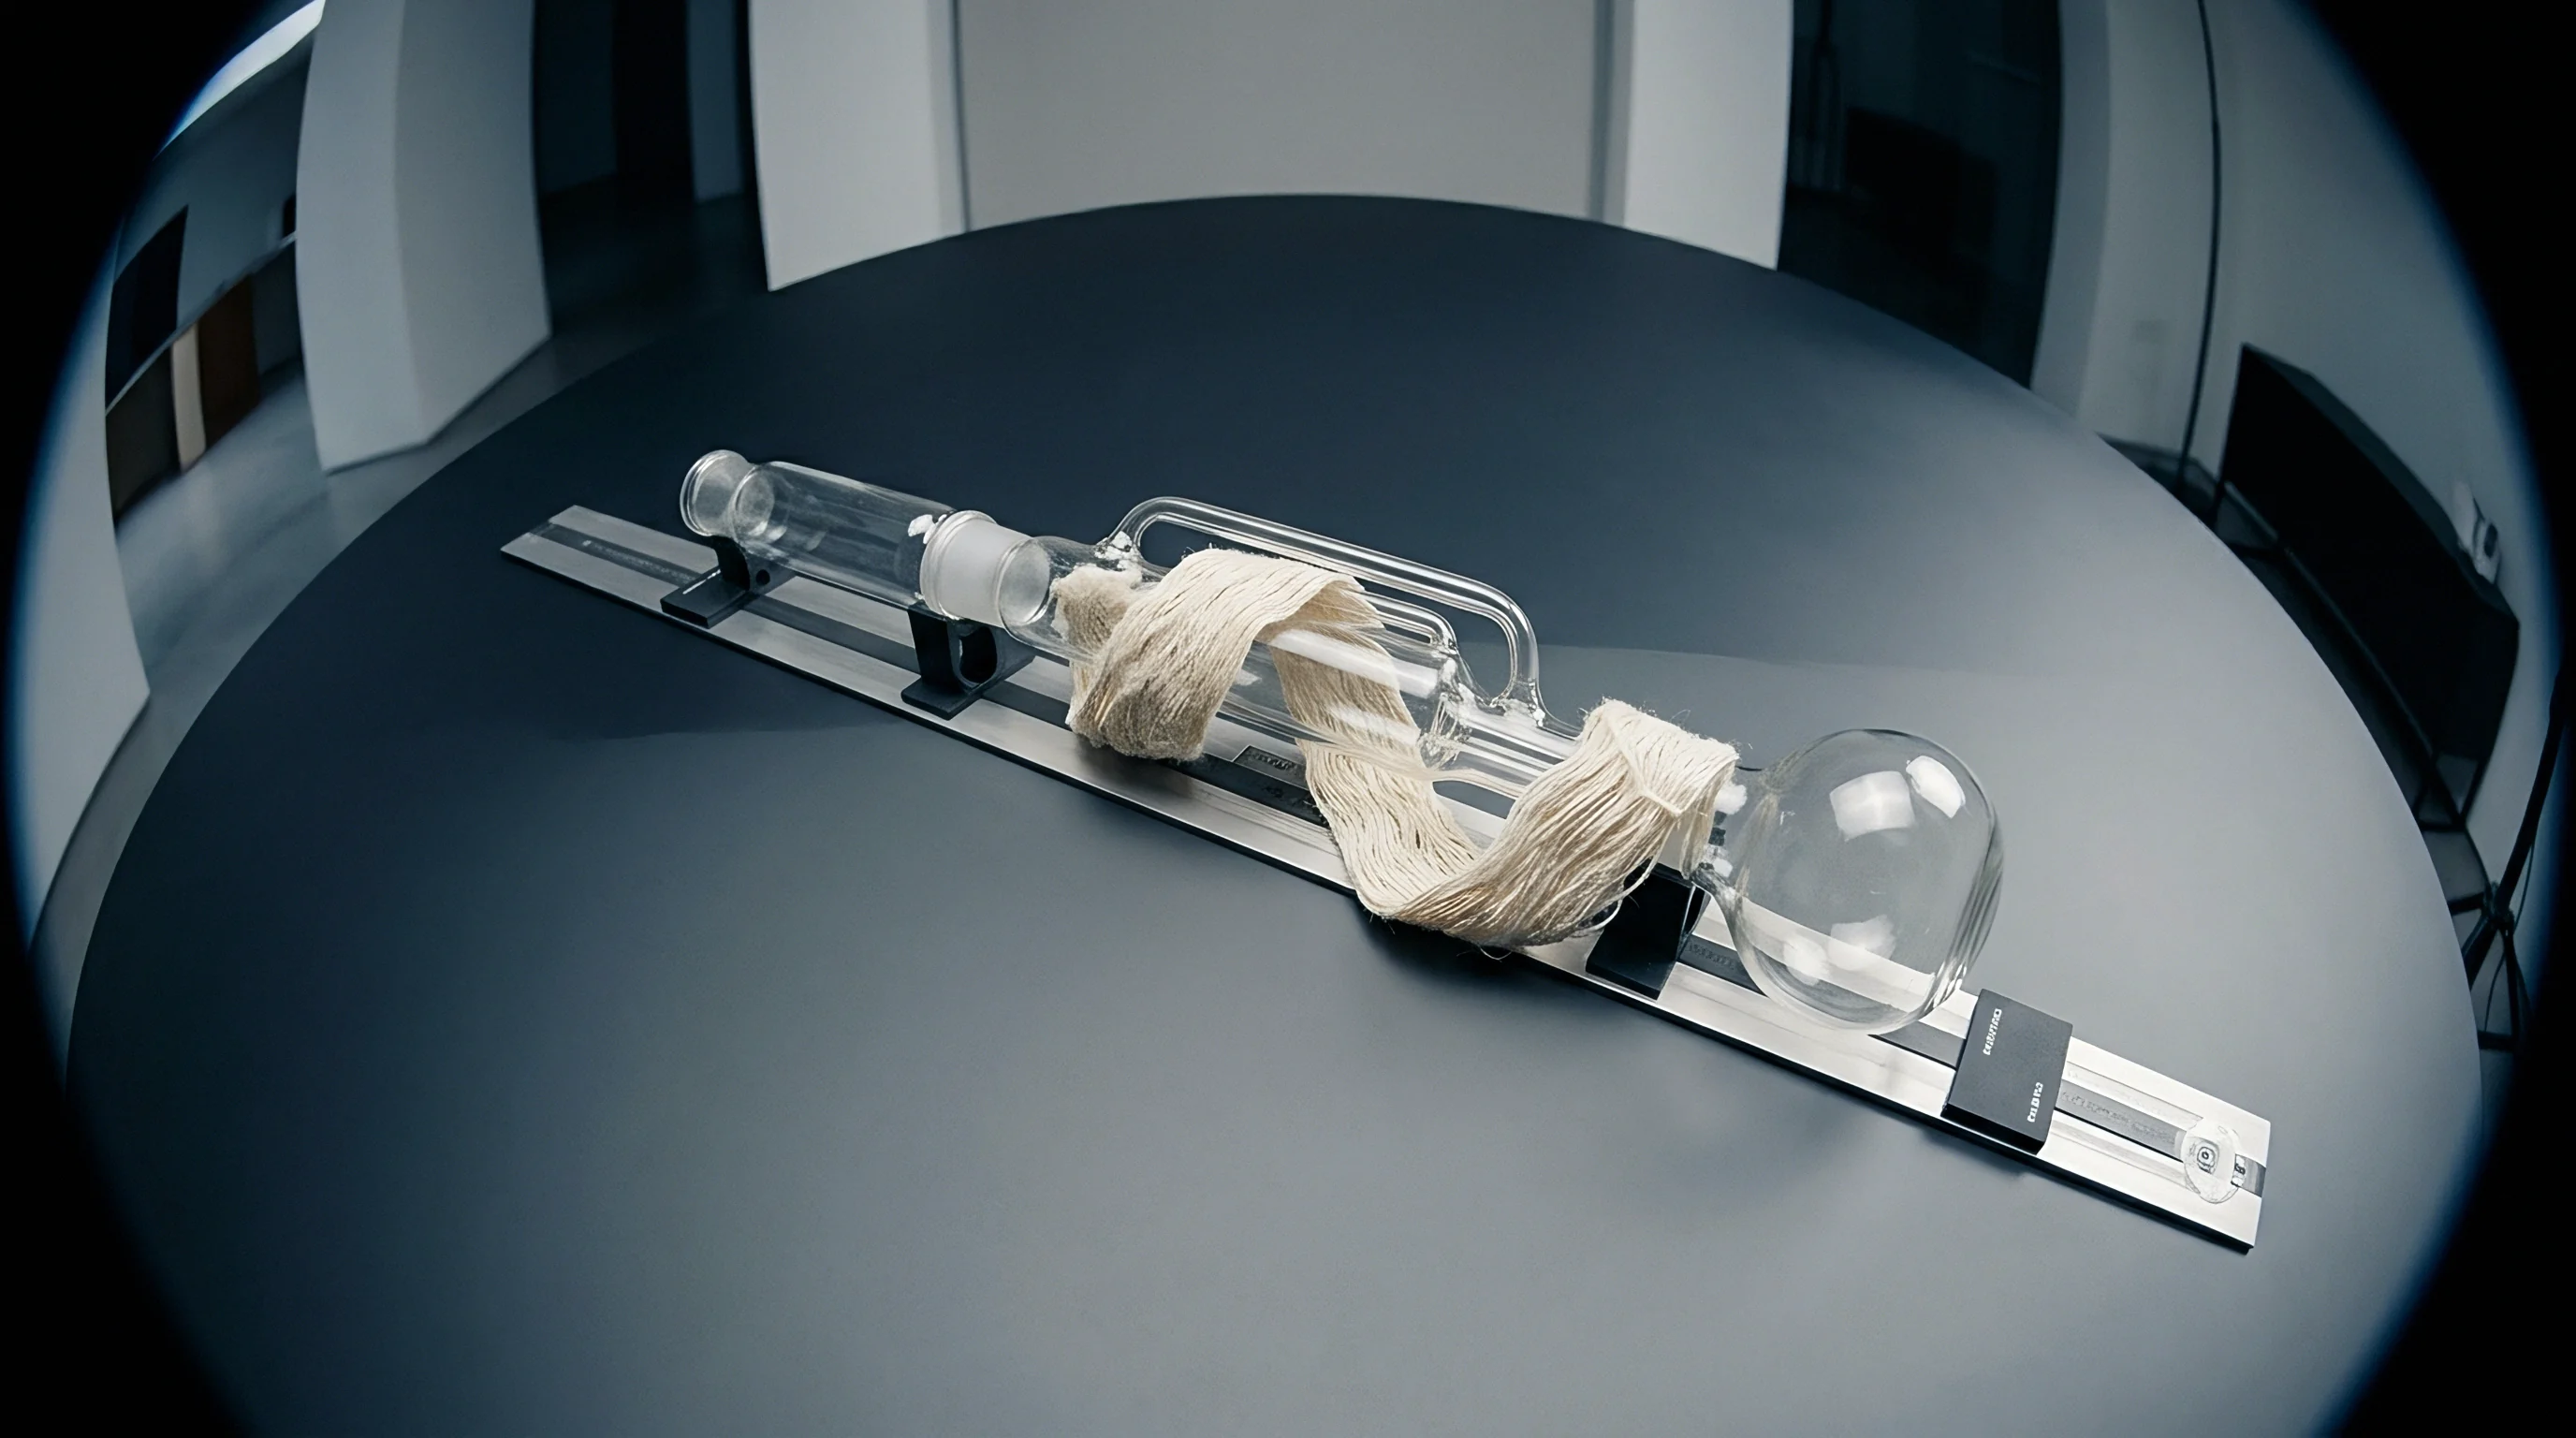
Stilbene brighteners absorb invisible electromagnetic radiation between 340 and 380 nanometers, re-emitting that captured energy as visible violet-blue waves. This optical mechanism masks natural yellowish fiber tints, elevating perceived brightness. Accurately quantifying this emission across separate testing locations requires precise calibration of the ultraviolet component of the spectrophotometer lamp.
Unlike non-fluorescent colors where reflectance cannot exceed 100 percent, brightened textiles frequently produce total radiance factors exceeding 140 percent in the 430 to 450 nanometer region. Total radiance represents the sum of true reflected light and fluorescent emission.
Tint values flip from green to red. Slight changes in the spectral power distribution of the source alter this radiance curve. If an instrument receives an excess of near-ultraviolet photons, the fluorescent spike dominates the calculation, inflating the CIE whiteness index.
Conversely, depleted ultraviolet illumination leaves the textile looking dull and yellow to the calculation algorithm. The testing chamber holds heat. This internal temperature elevation suppresses fluorescence efficiency through non-radiative thermal decay, compounding the error introduced by unstable optical filters.
ISO 105-J02 execution without fluorophore reference plaque adjustment triggers automated lot rejection on white goods displaying acceptable visual tint.
Why Do D65 Simulators Deviate below Cutoff?
Tungsten filament sources fitted with filtering glass struggle to match true daylight distributions beneath 400 nanometers. Continuous quartz tungsten-halogen lamps generate abundant red and infrared radiation but emit low radiant flux in the near-ultraviolet spectrum. Instrument makers compensate by applying heavy glass filters that attenuate long wavelengths while transmitting ultraviolet energy.
These daylight-conversion filters introduce complex optical anomalies. Over time, the high thermal output of the continuous halogen bulb bakes the filter glass, reducing its transmission efficiency in the 360 to 400 nanometer band.
Uncalibrated xenon lamps drift fast. While pulsed xenon lamps produce adequate raw ultraviolet energy, their spectral power distribution varies from bulb to bulb and shifts as the electrodes erode. Standard daylight D65 mandates a specific, rigorous ratio between ultraviolet and visible radiation.
Commercial spectrophotometers employ adjustable mechanical or software-driven ultraviolet filters to balance this ratio. A calibrated white textile reference plaque or Hohenstein transfer standard establishes this alignment. In the absence of daily calibration against a transfer standard, the actual ultraviolet content of two benchtop units in different commercial testing stations drifts by up to thirty percent.
Stilbene Emission Kinetics under Decayed Burner Output
Aging gas-discharge bulbs suffer selective loss in short-wavelength intensity long before visible luminance drops noticeably. Electrode sputtering deposits metal vapor onto the interior walls of the quartz lamp envelope. This thin metallic film selectively absorbs ultraviolet radiation while transmitting visible light without noticeable change.
The instrument automated diagnostic routines, which typically monitor total visible output against an internal white ceramic standard, fail to detect this selective degradation.
Cold glass alters calibration baselines. When an operator runs morning standardization using a standard white ceramic tile, the instrument records a baseline that assumes stable ultraviolet output. The non-fluorescent ceramic tile cannot evaluate ultraviolet energy because it lacks fluorophores.
Without a specialized fluorescent calibration standard, the instrument operates blind to the ongoing decay of its ultraviolet emission. An aged lamp continues to pass daily standardization checks while producing severely degraded whiteness measurements on commercially finished production cloth.
| Substrate Construction | UV Condition State | Cutoff Wavelength (nm) | CIE Whiteness (W10) | Tint Deviation (Tw10) | CIELAB DE2000 vs Calibrated D65 |
|---|---|---|---|---|---|
| 100% Cotton Bleached Interlock 180 gsm | UV Calibrated (D65) | None (Filtered D65) | 142.4 | -0.82 | 0.00 |
| 100% Cotton Bleached Interlock 180 gsm | UV Excluded (400 nm) | 400 nm | 78.1 | +1.45 | 4.85 |
| 100% Cotton Bleached Interlock 180 gsm | UV Excluded (420 nm) | 420 nm | 72.6 | +2.10 | 5.90 |
| 100% Cotton Bleached Interlock 180 gsm | UV Uncalibrated (Decayed) | Uncontrolled | 128.7 | -0.15 | 1.82 |
| 100% Polyester Taffeta 75D OBA | UV Calibrated (D65) | None (Filtered D65) | 156.8 | -1.20 | 0.00 |
| 100% Polyester Taffeta 75D OBA | UV Excluded (420 nm) | 420 nm | 84.2 | +2.80 | 6.40 |
| Measurements taken on diffuse/eight-degree benchtop sphere spectrophotometers under Illuminant D65 and 10-degree standard observer. | |||||
Implementing an exact sequence of calibration steps restrains inter-laboratory whiteness discrepancies within acceptable commercial limits.
- Plaque temperature stabilization brings the reference transfer standard to 20 degrees Celsius within a conditioned atmosphere before initiating optical alignment routines.
- Standard black trap verification absorbs scattered internal light to anchor zero-reflectance baselines across the sensor diode array.
- Ceramic white standardization establishes absolute photometric scale linearity across the visible waveband from 400 to 700 nanometers.
- Fluorescent reference calibration adjusts mechanical aperture vanes or algorithmic multipliers until the measured whiteness matches the plaque certified value.
- Secondary textile swatch cross-check verifies that the adjusted ultraviolet balance produces stable coordinates on an unbrightened master swatch.
The overseas finishing mill routinely asserts that the goods met agreed whiteness targets upon stenter exit and that buyer-side rejections stem entirely from uncalibrated xenon filters in destination receiving docks.


Tolerance
Total allowable color variance between two commercial testing bodies demands explicit mathematical apportionment rather than an arbitrary aggregate threshold. In standard sourcing contracts, buyers set a blanket color tolerance of 0.8 to 1.0 CIELAB DE2000 units for production lots against approved lab dips. This single commercial limit must accommodate fiber variations, dye lot differences, finish applications, and physical instrument measurement noise.
When testing divergence between two facilities consumes 0.6 DE2000 units on optical and thermal variations alone, the mill manufacturing tolerance window collapses to almost zero. The dyer faces automatic rejections on lots that sit comfortably within visual commercial acceptability.
Tight sett delays thermal equilibrium. Heavy dense cloth constructions retain internal thermal gradients far longer than open knitted structures. A 400 grams per square meter cotton canvas measured in a fast-paced audit room retains handling warmth in its yarn core, shifting its surface reflectance while under evaluation.
Conversely, lightweight 60 grams per square meter polyester chiffon cools rapidly but vibrates under the measurement port airflow, altering optical geometry. Error budget analysis separates physical textile variations from instrumental artifacts, identifying which variables push color numbers over contractual thresholds.

Partitioning Combined Error Budgets in Spectral Colorimetry
Analytical modeling assigns discrete numerical limits to individual hardware variables, ensuring no single drift mechanism consumes the entire pass-fail window. An enterprise establishes an overall inter-laboratory tolerance budget of 0.8 DE2000 units. If thermal drift between testing rooms contributes up to 0.35 DE2000 units and unaligned ultraviolet filtering contributes another 0.40 units, mathematical vector addition of these errors frequently drives total divergence beyond 0.85 units, even if the fabric possesses zero intrinsic color variation.
Mill technicians dispute buyer findings. These disputes paralyze shipping docks and delay payment collections. When spectrophotometer divergence goes unquantified, dyehouses spend thousands of dollars re-dyeing lots that were mixed and padded accurately.
Formulators adjust dyestuff concentrations to chase false instrument readings, producing subsequent batches that actually fail under true daylight. Controlled apportioning of tolerances isolates instrument uncertainty, forcing laboratories to verify environmental controls before issuing a non-conformance notice to production.

Instrument Geometry and Inter Model Repeatability Bands
Integrating spheres with diffuse viewing configurations capture light fields quite differently than directional forty-five-degree setups. Diffuse eight-degree geometry instruments collect total reflected light using a barium sulfate or Spectralon coated chamber, allowing specular inclusion or exclusion. Directional 45/0 instruments illuminate at forty-five degrees and detect at zero degrees, actively filtering specular sheen.
When assessing structured weaves like twills or dobby textures, orientation across the aperture plate generates directional shading differences.
Batch release stops immediately. Aligning two different models from different instrument manufacturers demands empirical profiling. Even within identical optical geometry classes, differing sphere diameters, port dimensions, and internal baffle placements generate systematic reflectance offsets.
A sphere with an eight-inch internal diameter exhibits greater light diffusion uniformity than a compact three-inch portable sphere. Comparing benchtop sphere data to portable line-inspection readings without applying mathematical transfer matrices guarantees systematic error across every dye lot.
Auditing procedures must identify hardware discrepancies before commercial penalties are assessed against textile processing mills.
- Lamp age verification logs total flash counts on discharge tubes to replace aging bulbs before short-wavelength decay compromises calibration.
- Port diameter consistency confirms that both facilities inspect samples using matching aperture sizes, avoiding localized yarn sampling bias.
- Conditioning cycle validation checks room temperature and humidity logs to verify that textiles completed a four-hour dwell within ISO 139 limits.
- Calibration standard traceability establishes that all working white and fluorescent calibration plaques possess active, unexpired national metrology certificates.
A shade reading taken on an unconditioned roll inside an uncalibrated instrument guarantees disputes across overseas borders.

Arbitration
Commercial purchase orders collapse into expensive legal deadlocks when shade inspection criteria lack physical definition. When a buyer in North America rejects an eighty-thousand-dollar container of brightened twill based on automated spectrophotometer readings, the Asian dyeing mill routinely challenges the finding. The mill provides internal test certificates asserting full compliance with the agreed color specification.
In traditional commercial arrangements, this conflict triggers frantic physical swatch exchanges via express courier, eating up valuable sales calendar weeks while demurrage fees accumulate at the port of entry.
The buyer cancels the delivery. Freight costs compound the financial damage. When shade disputes drag past retail cancel dates, the brand issues chargebacks or demands full air freight transport at the supplier expense.
A significant proportion of these commercial conflicts originate not in chemical formulation failures on the dyehouse floor, but in divergent spectrophotometer filtering and unmonitored temperature shifts between testing desks. Resolving these disputes requires a standardized arbitration workflow anchored in absolute metrological repeatability.
Divergence between buyer and supplier colorimetric instruments transforms technical measurement noise into commercial freight chargebacks.
Contractual Boundary Definitions for Commercial Shade Disputes
Procurement documents state exact ambient parameters, conditioning durations, and UV adjustment schedules to eliminate ambiguous color rejections. Contracts must define not merely a numerical pass-fail tolerance such as DE2000 under 0.8, but the precise instrument configuration required to produce that number. Specifying illuminant D65, a ten-degree standard observer, diffuse eight-degree geometry with specular inclusion, and ultraviolet calibrated according to ISO 105-J02 leaves no procedural room for interpretation.
Air freight consumes production profit. Sourcing agreements protect both parties by including mandatory third-party laboratory arbitration clauses. If the buyer internal quality audit conflicts with the mill pre-shipment report, both parties agree to submit sealed reference swatches to an independent accredited laboratory operating strictly under ISO 17025 certification.
The contract defines which party absorbs secondary testing fees based on the arbitration outcome. This commercial discipline discourages frivolous shade rejections while compelling mills to maintain verified optical calibration.
Bilateral Spectrophotometer Alignment Protocols across Borders
Trading partners achieve concord by circulating standardized calibration tiles and identical physical swatches between production sites. Rather than relying solely on local factory standardization, cross-border sourcing programs institute monthly round-robin audits. The central brand office distributes identical master ceramic standards and certified brightened textile swatches to every contracted dyeing facility.
Each facility logs reflectance data on its benchtop units and submits the digital spectral files to a centralized database for mathematical profiling.
Statistical analysis of this round-robin data calculates an inter-instrument agreement coefficient for every spectrophotometer in the supply chain. If a specific dyehouse machine consistently reads 0.3 units high on the b-star axis, a localized digital correction profile balances the output. Aligning hardware baselines before bulk processing begins eliminates the phantom drift that routinely threatens cross-border shipping schedules.
| Lot Volume (kg) | Substrate Type | Disputed Color Metric | Processing Delay (Days) | Secondary Testing Cost (USD) | Air Freight Surcharge (USD) |
|---|---|---|---|---|---|
| 4,500 | Cotton Twill 240 gsm Optical White | CIE Whiteness (W10) | 18 | 650 | 28,400 |
| 12,000 | Polyester Microfiber Disperse Scarlet | CIELAB DE2000 (0.94 vs 0.68) | 24 | 1,200 | 76,500 |
| 3,200 | Nylon 6,6 Ripstop Acid Turquoise | CIELAB DE2000 (1.12 vs 0.74) | 14 | 450 | 19,800 |
| 8,500 | Cotton Poplin Reactive Navy | CIELAB DE2000 (0.88 vs 0.55) | 21 | 950 | 54,200 |
The unresolved problem remains whether cross-border supply chains can realistically enforce synchronized daily white-plaque UV calibration across dozens of independent commercial dyehouse laboratories without introducing new forms of procedural fraud.