Dynamic Spatial Masking Sensitivity Floor in High Speed Cotton Tuft Optical Sorting Systems
Dynamic spatial masking in optical tuft sorting elevates the noise floor, obscuring low-contrast polypropylene and trash defects under variable flow speeds.


Tuft

Aerodynamic Behavior and Spatial Dispersal in Air Channels
Inside a 1200 millimeter wide optical sorting duct, compressed air propels raw cotton down the line at over 22 meters per second. The physical shape of individual cotton tufts shifts continuously in flight. Open, low-density tufts deform under aerodynamic shear, creating fleeting optical cavities and changing surface profiles.
Dense, poorly opened clusters act like solid projectiles, keeping rigid boundaries and casting deep, irregular shadows under incident light. Optical sorters must evaluate these moving fiber masses within frame windows under 50 microseconds, where accuracy hinges on separating genuine foreign matter from the shadows cast by heavy fiber clusters.
Upstream opening equipment sets the starting conditions for spatial sorting. When a blowroom line runs at 1000 kilograms per hour, bulk density varies across the channel width. High-speed line-scan cameras inspect the stream through quartz glass windows that suffer steady micro-abrasion from fine silica dust in raw cotton bales.
The resulting image is complex: bright fiber walls, dark voids inside tuft folds, floating dust clouds, and contaminants resting on or just beneath the surface. This structural variation raises background optical noise ~ dynamic spatial masking ~ which routinely conceals low-contrast foreign matter buried inside the fiber stream.

Mechanical Dispersal Mechanics in High-Velocity Duct Transit
Aerodynamic drag inside transport ducts scatters tufts across the optical viewing line. Large tufts over 40 millimeters wide form targets dominated by internal shadow. As cotton moves through the illumination zone, light penetrates only the outer 1.5 to 2.0 millimeters of the tuft wall.
The unlit core reads as a low-reflectance zone that processing units easily confuse with dark trash like bark or heavy leaf scrap. Imbalanced transport air worsens the issue, generating local turbulence that tumbles tufts and alters their visible profiles between camera scans.
Preparing tufts requires tight control over opener roll speeds and carding segment gaps. If feed rollers over-clamp raw fiber, unopened clumps pass intact into the inspection zone. These dense masses create sharp background optical gradients.
Across a 2048-element line array, raw voltage drops abruptly at the leading and trailing edges of heavy tufts. Sorting software must then determine whether a voltage drop stems from a genuine brown jute fragment on the surface or merely shadow inside a deep fold.
Establishing uniform fiber dispersal prior to optical scanning relies on a precise operational sequence:
- Bale plucker depth calibration sets initial bite size to keep tuft weights below 0.10 grams, preventing large structural clumps from reaching the transport channels.
- Coarse opener speed adjustment regulates impact frequency to open fiber bundles without generating neps or snapping staple fibers.
- Duct air velocity balancing holds transport speed steady at 20 meters per second, curbing tuft tumbling while preserving line pressure.
- Optical window air-curtain tuning stops fine trash from settling on quartz sight glasses without inducing turbulent eddies in the main fiber stream.
Light transmission through cotton tufts is non-linear, as dense clusters attenuate incident light exponentially relative to mass thickness. At densities above 0.05 grams per cubic centimeter, backscatter dominates the signal and transmitted light drops to zero. This opacity leaves sorting systems dependent entirely on surface reflection, keeping internal trash hidden until mechanical processing opens the tuft further downstream.
In practice, fiber velocity seldom matches theoretical flow models. Friction along duct walls slows outer tufts to 14 meters per second while air at the center reaches 24 meters per second. This speed differential stretches tufts along the line of travel, changing their visible footprint mid-scan.
Cameras running at fixed line rates capture elongated, distorted bundle profiles. Reconstructing their true geometry demands real-time velocity tracking, something static threshold platforms cannot manage.
What remains unmeasured is how micro-turbulent eddies around duct corners re-agglomerate opened tufts right before they hit the optical sensor frame.


Optics
Multispectral Array Configurations for Contamination Detection
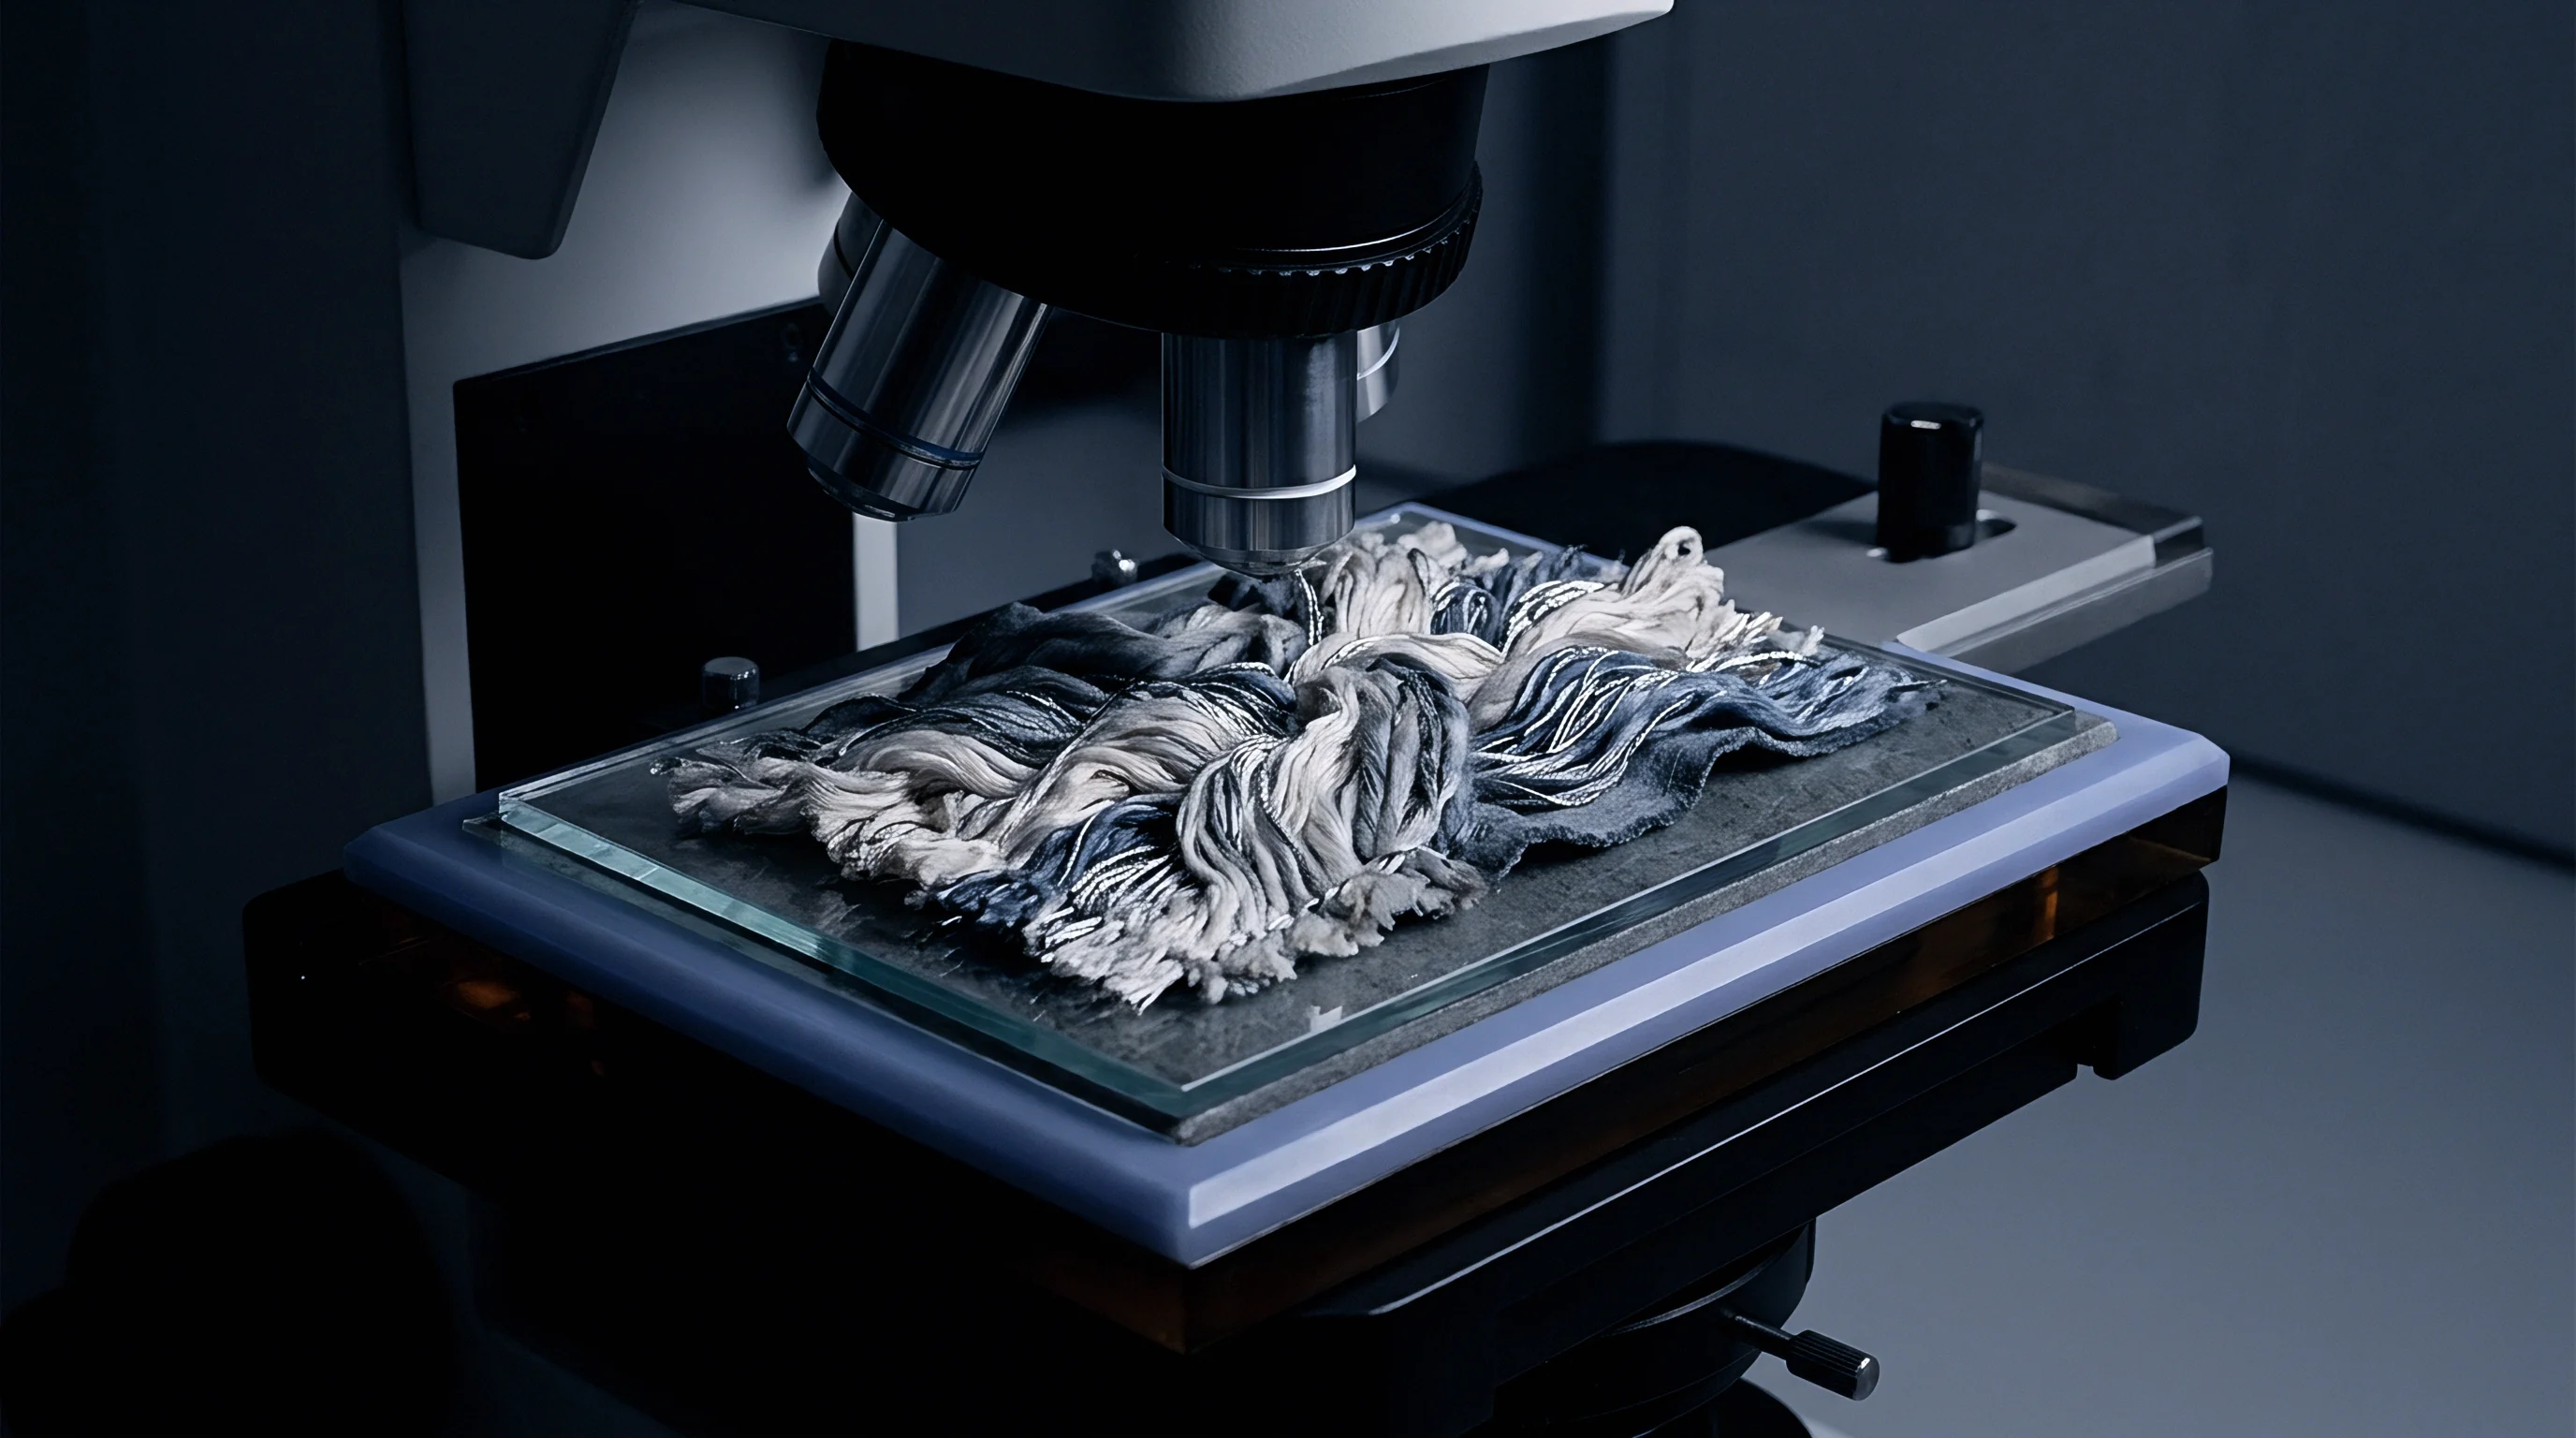
High-speed cotton sorters rely on multi-channel optical arrays to isolate foreign material from raw lint. Visible light channels operating between 400 and 700 nanometers pick up dark matter like soil, leaf scraps, jute, and human hair. Ultraviolet channels centered at 365 nanometers excite optical brighteners in synthetic packaging, causing clear polypropylene twine fragments to glow against non-fluorescent cotton.
Near-infrared and short-wave infrared (SWIR) sensors operating from 900 to 1700 nanometers isolate clear, non-fluorescent polymers through absorption bands specific to carbon-hydrogen bonds.
Sensor configurations typically pair linear CCD or CMOS line-scan cameras with high-speed LED strobe arrays. Line rates must exceed 40 kilohertz to resolve 0.5-millimeter features at transport speeds of 20 meters per second. At these velocities, photon integration time drops below 20 microseconds per line, requiring focal-plane illumination above 50,000 lux.
Managing heat from these arrays is critical to prevent thermal drift in sensor sensitivity over long shifts.
Illumination arrays operating at 50,000 lux produce thermal shifts that alter silicon detector quantum efficiency by 0.2 percent per degree Celsius.

Optical Absorption Profiles of Organic and Synthetic Foreign Matter
Natural cotton fibers reflect light broadly across visible wavelengths, yielding CIELAB L brightness values between 80 and 92. Foreign matter behaves differently. Dark botanical trash yields low L values (30 to 50), making visible-wavelength contrast detection straightforward when material sits exposed on tuft surfaces.
Clear polypropylene from modern bale wrapping presents a tougher problem: its visible reflectance curve matches white cotton almost exactly, leaving standard color cameras blind to it.
| Spectral Band | Wavelength Range (nm) | Target Defect Material | Optical Contrast Mechanism | Minimum Spatial Resolution (mm) |
|---|---|---|---|---|
| Ultraviolet (UV) | 365 – 395 | Fluorescent Polypropylene, Synthetic Strapping | Fluorescence emission shift to visible blue | 0.3 x 0.3 |
| Visible (VIS) Color | 400 – 700 | Bark, Jute, Stems, Dark Trash, Colored Fibers | CIELAB color space distance (ΔE) offset | 0.5 x 0.5 |
| Near-Infrared (NIR) | 850 – 950 | Oily Fiber, High-Moisture Clumps, Leather | Differential water absorption at 940 nm band | 1.0 x 1.0 |
| Short-Wave Infrared (SWIR) | 1000 – 1700 | Clear Non-Fluorescent Polypropylene, Polyethylene | CH2 stretching vibrational mode absorption | 0.8 x 0.8 |
Polarized light techniques help isolate synthetic film fragments. Raw cotton fibers feature a crystalline cellulose structure that depolarizes reflected light randomly, whereas smooth polymer films like polyethylene sheeting preserve linear polarization during specular reflection. Illuminating tufts with linearly polarized light through a cross-polarized lens filter suppresses diffuse reflection from cotton while highlighting specular flashes from film surfaces, boosting the signal-to-noise ratio for clear film by over 18 decibels.
SWIR sensors target distinct absorption bands at 1210 and 1390 nanometers. Cellulose lacks strong absorption in these narrow windows, keeping diffuse reflectance above 75 percent, while polypropylene exhibits sharp absorption dips from second overtone C-H stretching. Under SWIR illumination, transparent polypropylene appears dark against bright cotton.
Incorporating SWIR indium-gallium-arsenide (InGaAs) sensors increases hardware costs significantly, but it offers the only reliable method for detecting un-dyed, non-fluorescent synthetic wrapping before carding shreds it into microscopic strands.
High-resolution optics demand precise focal alignment across the entire transport duct width. Chromatic aberration across broad spectral bands (400 to 1700 nanometers) focuses different wavelengths on different planes, blurring fine detail. Apochromatic lenses built with fluorite glass elements are necessary to maintain spatial sharpness.
Without chromatic correction, a 0.5 millimeter polypropylene fiber viewed under combined VIS and SWIR lighting smears into a 2.0 millimeter blur, driving peak signal amplitude below the detection threshold.
Lens fouling remains a persistent issue in blowrooms. Honeydew residue, micro-waxes, and airborne dust settle continuously on viewports. Automated air jets purge sight glasses periodically, yet fine films still build up across an eight-hour shift.
This film scatters forward light, degrading contrast and raising baseline sensor noise. Calibration routines must track these gradual reflectance changes to avoid confusing window contamination with shifts in cotton color grade.
A broad-spectrum sensor setup cannot compensate for poor mechanical opening upstream.


Noise
Statistical Distribution of Photometric Noise in Dynamic Fiber Streams
Background optical noise in high-speed sorters stems from three main sources: sensor photon shot noise, stray wall reflections, and the irregular surface geometry of moving tufts. Unlike static industrial inspection where illumination remains uniform, passing tufts introduce high-frequency photometric swings. As cotton flows through the inspection zone, the ratio of exposed fiber mass to open duct space shifts constantly, creating a noise floor that fluctuates across spatial frequencies.
Photometric variations recorded across an operating blowroom line processing raw American Upland cotton show noise distributions ranging from low-frequency intensity humps at large tuft centers to high-frequency speckle from individual fiber ends catching specular light. The sensor signal follows a Gaussian profile across empty space, but shifts to a skewed, heavy-tailed distribution when tufts enter the field. The tail of this curve overlaps directly with signals produced by small, low-contrast contaminants like pale leaf or light jute fragments.

What Determines Spatial Masking in High Density Fiber Transit?
Spatial masking occurs when high background variation renders an adjacent, smaller signal unresolvable. In cotton sorting, a bright fiber crest adjacent to a deep shadow pocket produces a high-contrast edge with very high spatial frequency. If a 1.0 millimeter bark fragment rests inside or alongside that shadow, the steep gradient masks the contrast shift from the particle.
The system cannot determine whether the sudden drop in brightness stems from foreign trash or self-shading within the tuft structure.
Sorting failures under dynamic spatial masking usually stem from a few specific mechanisms:
- Shadow boundary false triggers occur when sharp light drop-offs at tuft edges cross contrast thresholds, causing unnecessary ejection of clean fiber.
- Contaminant signal suppression happens when dark foreign matter sits inside an unlit fold, dropping contrast relative to the surrounding shadow to near zero.
- High-frequency spatial aliasing occurs when fine trash moves at speeds that cause its image to slip between sensor sampling intervals.
- Specular glare blinding occurs when smooth leaf or synthetic fragments bounce direct LED light into the lens, saturating local pixels and hiding adjacent dark defects.
- Sensor gain saturation happens when automatic gain control adjusts for bright tuft reflections, desensitizing pixels to low-contrast defects in nearby dark regions.
Masking severity correlates directly with the spatial frequency of the tuft surface. Flat, well-carded fiber webs generate low spatial frequency noise, allowing detection thresholds to sit near baseline averages. Open blowroom tufts create high spatial frequency noise with sharp structural transitions.
Modeling this noise floor using spatial power spectral density (PSD) shows heavy power concentration between 0.1 and 2.0 cycles per millimeter ~ the exact spatial frequency band occupied by short foreign fibers, trash flakes, and torn packaging film.
Overcoming spatial masking demands processing hardware capable of separating high-frequency noise from genuine foreign matter signals. Linear spatial filters like Gaussian smoothing or Laplacian edge detection frequently fail because trash particles match the physical dimensions of tuft surface features. A 1-millimeter trash particle produces an optical response nearly identical to the shadow cast by a 1-millimeter fold in a compressed tuft.
Algorithms must instead evaluate local context, comparing pixel intensity gradients against statistical averages across the surrounding region.
Dust inside the optical chamber alters baseline noise over time. Accumulations on illumination LEDs reduce total light output, dropping the signal-to-noise ratio by up to 12 percent over 12 hours. Concurrently, dust on camera lenses acts as a low-pass spatial filter, blurring details and softening shadow edges.
Combined, these factors raise the noise floor, forcing plant operators to lower sorting sensitivity or accept high false ejection rates.
A batch of high-trash raw cotton can raise sensor noise enough to hide fine bark fragments, causing yarn rejections downstream and severe commercial penalties.


Threshold

Mathematical Formulation of the Dynamic Sensitivity Floor
Calculating the dynamic sensitivity floor requires evaluating local reflectance and spatial variance in real time. Static thresholding applies a fixed voltage or digital threshold across all sensor elements, triggering ejection whenever a pixel falls below a set gray value. This approach fails in high-speed sorting because natural density shifts constantly drop local light levels below fixed limits, pushing false-positive ejection rates above 5 percent of total mass flow.
Dynamic thresholding calculates an adaptive limit based on moving spatial windows.
Let I(x,y) represent the raw light intensity recorded at pixel position x across spatial array line y. The dynamic background threshold T(x,y) is derived by convolving the raw signal frame with a two-dimensional spatial kernel K, followed by applying a dynamic offset factor k scaled to local spatial variance σ2(x,y):
T(x,y) = summ=-kk sumn=-ll K(m,n) · I(x-m, y-n) – left
Here, α represents the spatial variance weighting coefficient, β is the baseline minimum contrast offset, and σ(x,y) is calculated over a local neighborhood (typically 7×7 or 15×15 pixels). The local standard deviation σ(x,y) tracks surface roughness. Across a smooth fiber region, σ(x,y) approaches zero, allowing threshold T(x,y) to sit close to local mean intensity and maximize sensitivity to faint contaminants.
Across a rough, shadowed tuft boundary, σ(x,y) spikes, pulling threshold T(x,y) down to avoid false ejection triggers along shadow edges.

Algorithmic Adaptation to Variable Tuft Density
Adapting thresholds dynamically forces a tradeoff between foreign matter detection probability (Pd) and false alarm rate (Pfa). Lowering coefficient α sharpens sensitivity to pale contaminants, but increases false ejections on unevenly opened cotton. Raising α stabilizes ejection valves, but leaves blind spots around dense tuft perimeters where low-contrast trash slips through.
This tradeoff sets the practical sensitivity floor of the sorter.
| Duct Speed (m/s) | Tuft Density Variance (σ2) | Threshold Type | False-Positive Rejection Rate (%) | Polypropylene Detection Rate (%) | Bark/Leaf Detection Rate (%) |
|---|---|---|---|---|---|
| 15.0 | Low (0.02) | Static Fixed | 1.2 | 94.5 | 96.0 |
| 15.0 | Low (0.02) | Adaptive Spatial | 0.1 | 98.2 | 99.1 |
| 22.0 | Medium (0.08) | Static Fixed | 4.8 | 88.0 | 91.2 |
| 22.0 | Medium (0.08) | Adaptive Spatial | 0.3 | 94.1 | 96.5 |
| 28.0 | High (0.18) | Static Fixed | 9.5 | 76.4 | 82.0 |
| 28.0 | High (0.18) | Adaptive Spatial | 0.7 | 87.3 | 89.8 |
The limits of adaptive thresholding become obvious at higher transit speeds. At 28 meters per second, elevated density variance depresses detection rates even under adaptive models. Polypropylene detection drops from 98.2 percent to 87.3 percent as line speed increases from 15 to 28 meters per second.
Higher speeds reduce pixel dwell time, lowering signal-to-noise ratios while aerodynamic turbulence drives up tuft density variance σ2.
Standard mill intake contracts mandate raw cotton contamination levels below 2.0 grams per metric ton following optical blowroom cleaning.
Quantifying local spatial contrast relies on the CIELAB color space distance formula (Δ E ). For two adjacent color region signatures (L1 , a1 , b1 ) and (L2 , a2 , b2 ), spatial color distance is defined as:
Δ E = sqrt(L2 – L1 )2 + (a2 – a1 )2 + (b2 – b1 )2
Calculating exact square roots across 2048 sensor elements at 40 kilohertz strains hardware digital signal processors (DSPs). Systems rely on linear approximations or pre-calculated look-up tables (LUTs) stored in static RAM. The processor calculates Δ E between each pixel and its local background moving average.
If Δ E exceeds the sensitivity floor Tfloor, system memory registers an ejection trigger, tagged with spatial coordinates and delay counters aligned with downstream air valves.
When tuft surface variation pushes local standard deviation σ(x,y) above a critical limit, dynamic spatial masking forces T(x,y) below the signal level of low-contrast defects. Under these conditions, a light brown jute fiber displaying a Δ E of 4.5 against clean cotton becomes indistinguishable from background photometric noise (Tfloor > 4.5). The particle passes through without triggering ejection.
Operators attempting to fix undetected trash often override dynamic thresholds by flattening static offsets ~ a step that causes rapid valve chatter and blows clean cotton into the waste duct.
Physical limitations of optics exempt processing algorithms from resolving contaminants inside high-variance shadow pockets.


Ejection

Pneumatic Valve Dynamics and Spatial Rejection Envelopes
Targeting foreign matter requires translating spatial coordinates into precise mechanical action. High-speed ejection bars sit 200 to 400 millimeters downstream from the cameras. The bar holds 128 to 256 fast-acting solenoid air valves across a 1200 millimeter duct width, spaced at pitch intervals of 4.5 to 9.0 millimeters.
When target coordinates reach the ejection plane, designated valves fire for 1.5 to 4.0 milliseconds, using 6 to 8 bar air blasts to deflect trash into a waste collection hopper.
Valve actuation requires microsecond synchronization with fiber flow. Encoders on duct transport fans track air velocity, feeding timing pulses to the main PLC. If fiber speed fluctuates by 5 percent during the 15-millisecond transit between camera imaging and valve firing, the air blast misses its target by up to 15 millimeters.
This offset lets foreign matter pass into clean fiber flows while the air blast strikes usable cotton behind it.
Pneumatic valve response delays must remain within 0.2 milliseconds across operational temperature cycles to preserve spatial ejection targeting.
The profile of the air blast determines rejection precision. When a valve fires, compressed air expands through a converging nozzle into a conical supersonic jet. The impact area broadens as the air travels toward the fiber stream.
At 30 millimeters from the nozzle tip, a 4-millimeter orifice creates an impact footprint 12 millimeters wide. If the target trash is only 1.0 millimeter across, the blast catches surrounding clean fibers, carrying good lint into the waste stream along with the contaminant.
Optimizing pneumatic rejection balances contamination removal efficiency against good fiber loss. Fiber loss quantification relies on the Good-to-Trash Rejection Ratio (Rgt), defined as:
Rgt = fracMcleanMtrash
Here, Mclean represents the mass of clean fiber thrown into waste boxes, while Mtrash is the mass of actual foreign matter removed. Poorly calibrated sorters exhibit Rgt values above 15:1 ~ discarding 15 grams of spinnable cotton for every 1 gram of trash removed. Fine-tuning pulse duration, air pressure, and nozzle grouping can reduce Rgt below 4:1 while keeping removal efficiency above 90 percent.
Tuning pneumatic ejection arrays follows this diagnostic checklist:
- Valve response time mapping confirms that electronic signals open mechanical valves within 1.2 milliseconds across all channels.
- Pressure drop equalization verifies that manifold pressure stays stable at 7.0 bar during peak multi-valve firing.
- Spatial alignment calibration aligns air jet impact points with camera pixel coordinates using laser calibration plates.
- Duct air velocity tracking matches encoder pulses to center-line air flow to adjust for fan speed drift.
- Waste duct vacuum balancing adjusts suction pressure in waste hoppers to prevent blow-back turbulence in the main transport channel.
High firing rates create thermal stress in solenoid valve coils. On heavily contaminated cotton, individual valves fire up to 40 times per second. Rapid cycling heats internal coils, increasing electrical resistance and slowing valve response.
A shift of just 0.5 milliseconds alters blast timing enough to let target trash slip past. Modern manifolds use active cooling channels or thermal compensation software that advances firing signals as coil temperatures rise.
Valve wear changes airflow behavior over time. Seal degradation causes pressure leaks at nozzle tips, while scale or oil mist in compressed air lines scores valve seats, causing erratic delays and distorted jet shapes. Regular maintenance requires checking individual valve pressure profiles with piezoelectric transducer arrays across the ejection channel.
Standard raw cotton sales contracts specify that total blowroom waste fiber loss from optical ejection cannot exceed 1.5 percent of gross bale weight.


Reckoning

Downstream Economic Consequences of Masked Contamination Carryover
Optical sorting failures in the blowroom pass costs directly down to spinning, knitting, weaving, and dyeing. Contaminants that escape early inspection break down into finer fragments during carding and drafting. A single 10-millimeter piece of clear polypropylene film entering high-speed carding shreds into over 20,000 microscopic filaments.
These tiny synthetic fragments spread through the sliver, becoming spun directly into the core of single ring yarns.
In spinning mills, missed foreign matter causes immediate end-breaks at spinning frames and winders. Ring frames running at spindle speeds of 18,000 RPM break whenever foreign particles pass through drafting rolls and disrupt yarn tension. Each break drops operator efficiency and introduces knots or splices that weaken the finished yarn.
Unplanned end-breaks cost mills roughly 0.08 USD per occurrence in lost capacity and manual piecing labor.
Polypropylene contamination undetected at blowroom optical sorters accounts for over 65 percent of post-dyeing fabric rejections in fine gauge knitting mills.
The largest economic hit from optical dynamic spatial masking occurs during wet processing. Natural cotton absorbs direct, reactive, and vat dyes through hydroxyl binding sites in its cellulose matrix. Synthetic polymers like polypropylene and polyethylene have non-polar hydrocarbon chains that reject water-soluble dyes completely.
When fabrics containing spun-in synthetic fragments are dyed, those fibers take no color, appearing as white specks across finished cloth.
| Processing Stage | Contamination Defect Type | Physical Failure Mechanism | Operational Cost Impact (USD / Metric Ton) | Contractual Claim Exposure |
|---|---|---|---|---|
| Rotor Spinning | Bark, Stems, Heavy Trash | Rotor groove buildup, yarn count deviation, end-breaks | 18.50 – 32.00 | Spinning efficiency penalty clauses |
| Ring Spinning | Jute, Feather, Human Hair | Drafting zone choke, thin/thick slub creation, splices | 45.00 – 85.00 | Yarn quality grade downgrading (Uster % failure) |
| Winding & Clearing | Dark Synthetic Fibers | Optical yarn clearer cuts, excessive package splices | 30.00 – 60.00 | Winder capacity loss, yarn yield reduction |
| Dyeing & Finishing | Clear Polypropylene Film | Zero dye uptake, white speck appearance in finished fabric | 220.00 – 650.00 | Total fabric roll rejection, chemical strip/re-dye bills |
| Garment Manufacturing | Spun-in Foreign Matter | Needle breakage during sewing, visual garment seconds | 400.00 – 1200.00 | Full shipment chargebacks, retail brand debit notes |
Calculating the true landed cost of raw cotton requires accounting for waste ejection losses and contamination risk penalties. Raw upland cotton bought at 2.10 USD per kilogram on an International Cotton Association (ICA) contract looks economical next to higher-grade combed cotton at 2.80 USD per kilogram. But if lower-grade bales contain fine polypropylene wrap, optical sorters must run at higher sensitivity, driving up good fiber rejection (Rgt).
Consider a typical mill run processing 100 metric tons of low-grade raw cotton with high trash content. To keep downstream dye defects down, operators lower sensitivity thresholds, raising ejection volume. Total blowroom lint loss jumps from a baseline 0.8 percent to 2.4 percent, throwing away 2.4 metric tons of usable fiber worth 5,040 USD.
Even with aggressive sorting, spatial masking allows 12 percent of synthetic fragments to pass into carding. Downstream, that residual contamination downgrades 15 metric tons of dyed fabric from First Quality to Second Quality, forcing a 35 percent price markdown worth 24,150 USD. Extra lab testing costs (ISO 1833 chemical separation and FTIR spectroscopy) and customer debit notes push total losses far past initial savings on raw material.
Customs misclassification risks also arise when foreign contamination alters raw fiber composition declarations. Tariff schedules enforce strict limits on synthetic polymer content in imported natural fibers. If significant synthetic packaging fragment levels remain in exported cotton waste or low-grade yarns, customs labs using gravimetric or chemical analysis may reclassify shipments into synthetic-blend tariff codes.
That triggers duty adjustments, higher tariffs, and fines that wipe out profit margins on cross-border orders.
Raw cotton lots carrying variable density tufts elevate the optical noise floor, driving systemic contamination carryover directly into finished yarn production.