Density Mapping
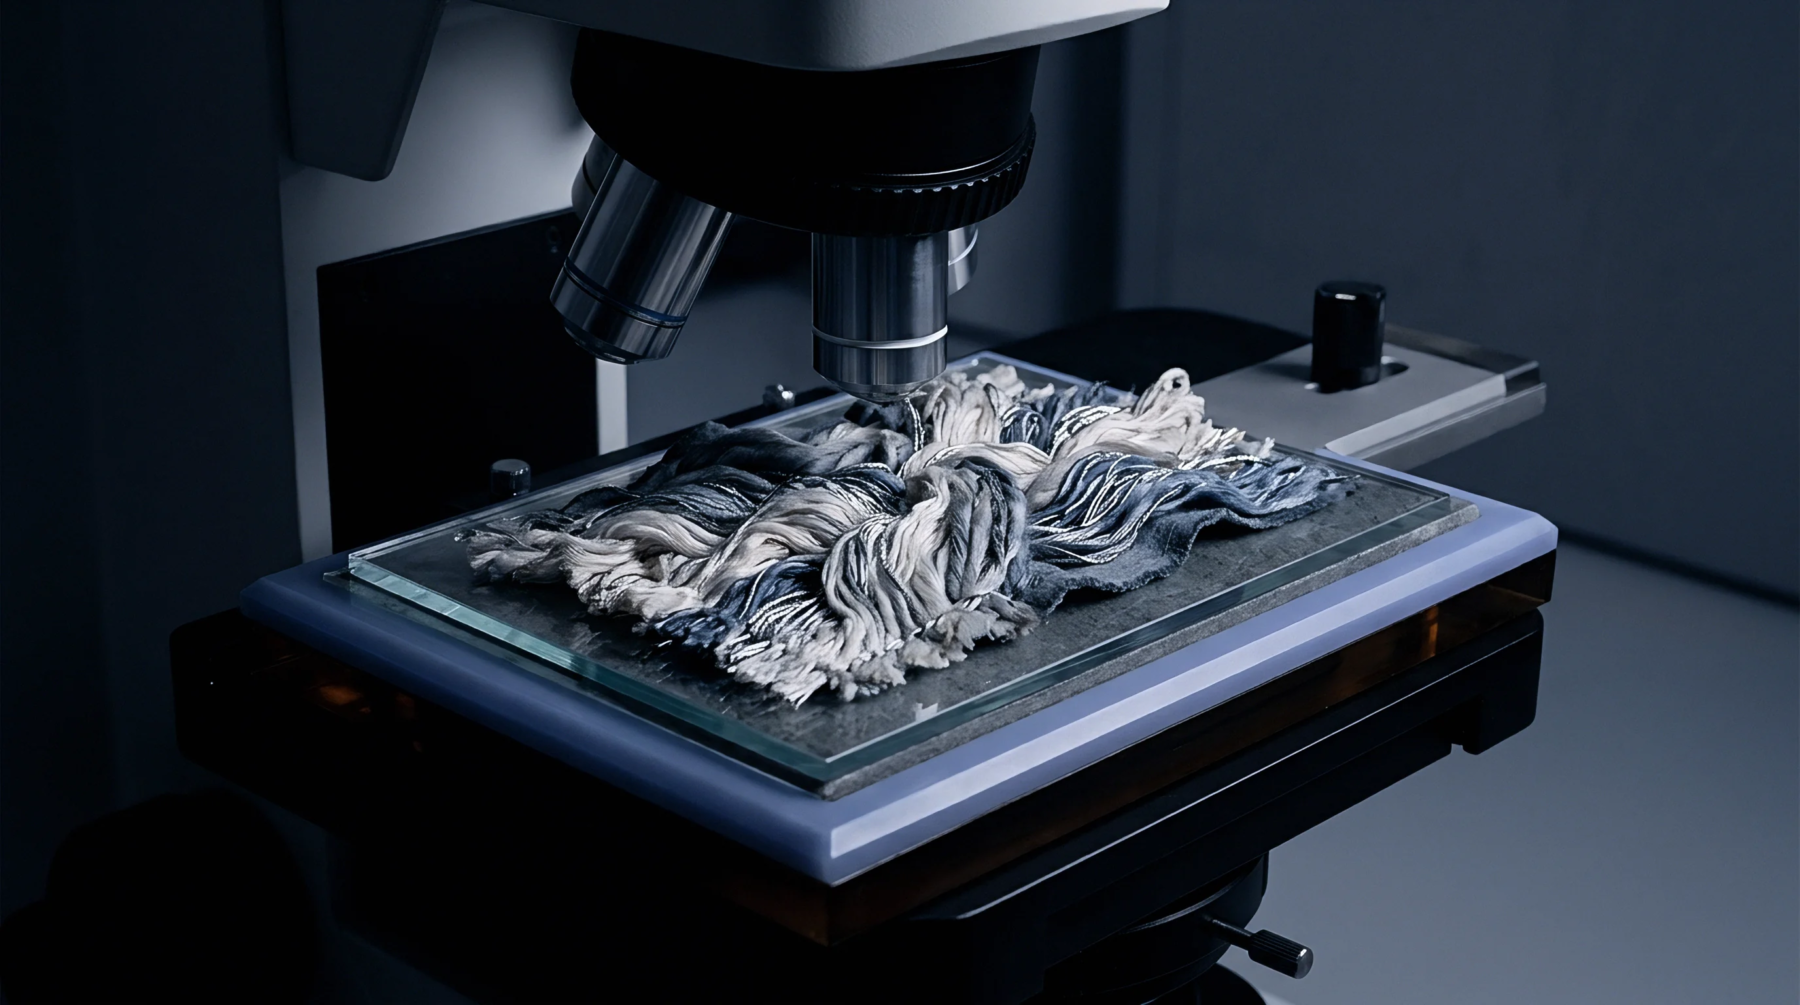
Sequential data sets represent the varying levels of light intensity captured by a sensor as a continuous stream of material passes before it. An optical attenuation profile allows the software to map the density and transparency of a moving web of fabric or fiber. Sudden drops in light transmission indicate thick spots.
Defect Recognition
Real-time analysis of the signal identifies irregularities that fall outside of the standard deviation for the batch. The optical attenuation profile acts as a digital fingerprint for every meter of production. By comparing this profile to a known master, the system flags deviations that might indicate a broken needle or a clogged feeder in a knitting machine.
Uniformity Measurement
Consistency in the density of a non-woven or woven product is verified by the flatness of the signal. A stable optical attenuation profile confirms that the distribution of fibers is even across the width of the roll. In technical textiles, this uniformity is essential for ensuring the correct filtration or strength properties of the finished goods.
Signal Normalization
External factors like lamp aging or dust on the lens can shift the baseline of the data. Regular calibration ensures the optical attenuation profile remains accurate over long production runs. Software filters remove the low-frequency drift caused by these environmental changes, leaving only the high-frequency data that relates to the product itself and ensuring that the detection of defects remains consistent from the start to the end of a shift.