Bayesian Acceptance Sampling Models for Multi-Layered Chemical Profile Variance in Technical Coated Fabrics
Bayesian acceptance sampling with depth-isolated microtome preparation isolates localized layer non-compliance, reducing consumer import risk below zero point five percent.


Resin
Technical coated textiles rely on polymer formulations built up in distinct structural layers. Whether using a flexible polyvinyl chloride membrane, a polyurethane barrier film, a polyorganosiloxane cover, or a fluoropolymer topcoat, every layer carries a distinct mix of plasticizers, cross-linkers, flame retardants, thermal stabilizers, and solvent residues. Over time, these additives migrate.
Heat, concentration gradients, and cure temperatures push volatile organic compounds and unreacted monomers across internal layer boundaries during multi-pass oven runs.
Because chemical concentrations vary across the depth of a multi-layer fabric, import compliance testing gets complicated. Standard regulatory methods usually treat the entire composite as uniform. Cryogenically grinding an architectural membrane blends the heavy base fabric with tie coats, plasticized foam cores, and thin fluoropolymer lacquers.
That pulverization averages concentrations across the full mass, masking sharp local spikes that break regulatory limits inside single layers.
Evaluating residual solvent transport across skin coats shows steep thermal gradients during oven curing. A polyurethane skin over a woven polyamide substrate traps solvent molecules deep near the boundary while the outer surface burns off its volatiles. Standard gas chromatography headspace analysis on a blended sample can return a compliant bulk concentration, even when the internal interface retains enough residual N,N-dimethylformamide to trigger enforcement under European market surveillance rules.
Standard quality control models assume chemical distribution follows a simple Gaussian curve across a production run ~ an assumption that fails on multi-layer fabrics. Variance occurs across three axes: along the coating knife width, down the roll length, and vertically through the z-axis of the layer stack. Coating knife deflection drives coat weight drift across the web, while uneven oven temperatures yield inconsistent drying rates across the fabric.

Architectural Stratification of Coated Fabrics
Technical textiles often feature up to six polymer coats built onto a structural backing. High-tenacity polyester or polyaramid filaments supply base tensile strength, while a liquid tie coat sinks into yarn bundles to anchor subsequent coats. Intermediate layers ~ often expanded foam or dense elastomers ~ add impact cushioning, opacity, and sound damping.
Outer skin layers provide fluid resistance, color density, and durability, protected by top lacquers of cross-linked acrylic or polyvinylidene fluoride against UV degradation and weather.
Each coating layer relies on a chemical mix designed for its role. Phthalate plasticizers like di-2-ethylhexyl phthalate and diisononyl phthalate keep flexible polyvinyl chloride foam soft at low temperatures. Halogenated flame retardants, such as antimony trioxide paired with chlorinated paraffins, sit concentrated in middle barrier coats for fire compliance.
Topcoats use fluoro-surfactants and UV absorbers to maintain low surface energy and shed dirt. These deliberate choices create sharp, step-like changes in chemical concentration through the depth of the textile.
Thermodynamic forces pull low molecular weight compounds across layer boundaries over time. Plasticizers migrate from heavily loaded interior foam toward surface lacquers, stiffening the inner core while softening the outer coat. Trapped solvents in lower tie coats gradually work outward after high-speed runs, creating sticky spots or gas pinholes.
When sampling protocols ignore this vertical stratification, they misjudge whether a production lot complies with regulations.

Chemical Partitioning across Functional Coatings
Solvent extraction behavior depends heavily on polymer density and cross-linking. Polyurethane layers built from aliphatic or aromatic diisocyanates form dense, hydrogen-bonded networks that retain residual solvents during analytical extraction. Polyvinyl chloride plastisols break down readily in tetrahydrofuran or hexane, dissolving the vinyl matrix and releasing plasticizer additives directly into solution.
Grinding a multi-layer fabric destroys these chemical zones, creating an averaged sample that hides local non-compliance. A fabric can test within acceptable bulk limits for short-chain chlorinated paraffins even if its tie coat carries three times the legal threshold under persistent organic pollutant rules. Whole-sample extraction washes the pulverized material together, diluting the concentrated tie coat with clean base yarns and un-additivated layers.
Substrate yarns introduce background noise into analytical results. Synthetic filaments carry spin finishes, anti-static agents, and residual caprolactam or terephthalic acid monomers that extract alongside coating additives, cluttering gas chromatography mass spectrometry scans. Obtaining clean data requires isolating the coating layers before introducing extraction solvents.
Volatile solvent loss during multi-stage oven passaging can reduce total bulk residual levels to within regulatory specifications, even while local skin coat concentrations remain well above compliance limits.


Stratum
Modeling chemical variance across multi-layer textiles requires a hierarchical framework to isolate random and systematic spread. Standard sampling plans assuming independent and identically distributed variables underestimate lot variance on complex fabrics. Total variance breaks down into horizontal spread across the surface, vertical spread through the depth, roll-to-roll variation within a production shift, and batch-to-batch differences from masterbatch mixing.
Variance along the vertical z-axis often exceeds horizontal x-y variance by two orders of magnitude. Continuous coating lines maintain fairly stable coat weights across a run, keeping transverse variation low. However, intentional chemical differences between adhesive primers and fluoroelastomer topcoats create structural variance through the thickness.
Collapsing these distinct dimensions into a single variance value obscures the source of defects, giving process engineers little actionable insight.
Solvent entrapment during rapid curing creates concentrated localized hot spots within specific layers.
Hierarchical Bayesian models account for structural variance by nesting layer-level random effects inside roll and lot distributions. Instead of assuming a uniform mean concentration for restricted substances, this approach assigns hyper-prior distributions to individual layer formulations. Destructive test results then update these hyper-priors, producing posterior probability density functions for chemical levels in each coating layer.

Hierarchical Variance Modeling Mechanics
To model multi-layer chemical dispersion, sample concentration is written as a sum of nested stochastic terms. Let Yijk be the measured concentration of a restricted substance in layer i of roll j from batch k. The model decomposes this value into a baseline mean, a batch effect, a roll effect nested within the batch, a layer effect nested within the roll, and residual measurement error.
Variance priors are established by assigning inverse-gamma or Wishart distributions to the precision matrices of these nested effects. If plant logs confirm consistent masterbatch dosing alongside fluctuating oven drying performance, the hyper-prior for batch variance receives high precision while layer solvent retention gets a broad, uninformative distribution. This separation prevents localized drying flaws from misregistering as raw material mixing errors.
Delaminating individual layers yields clean analytical fractions free from substrate interference.
Numerical sampling updates the posterior distribution, pinpointing where variance resides in the stack. If tests show dimethylformamide levels climbing in finished rolls, the posterior density isolates whether the increase stems from heavy primer application or inadequate dwell time in the topcoat drying tunnel, letting operators adjust targeted oven zones without altering chemical feed rates.
Compound Class Profiles and Concentration Distributions
Restricted compounds display distinct variance profiles across layers based on stability, volatility, and matrix interaction. Phthalate plasticizers remain unbound in polyvinyl chloride matrices and slowly diffuse outward. Organotin stabilizers stay bound in rigid vinyl until exposed to thermal breakdown during high-temperature welding.
Fluorotelomer water repellents concentrate almost exclusively in thin topcoats, forming a large portion of the surface layer while representing a tiny fraction of total fabric mass.
Residual solvents exhibit complex variance patterns due to their sensitivity to oven dynamics. Dimethylformamide, N-methyl-2-pyrrolidone, and toluene evaporate dynamically as the web passes through heating zones. Incomplete drying creates parabolic solvent profiles across the roll, leaving higher concentrations near the selvages where airflow drops.
The table below outlines major compound classes, target layers, test standards, regulatory limits, and observed variance patterns.
| Chemical Compound Class | Target Coating Layer | Test Method Standard | Regulatory Limit | Dominant Variance Dimension |
|---|---|---|---|---|
| Ortho-phthalates (DEHP, DBP, BBP, DINP) | PVC Foam and Tie Coats | EN ISO 14362-1 / GC-MS | 0.1 percent by weight | Inter-layer diffusion gradient |
| Residual Solvents (DMF, DMAC, NMP) | PUR Skin and Adhesives | DIN EN ISO 23134 / GC-MS | 1000 mg/kg (REACH Annex XVII 72) | Transverse edge-to-center plane |
| Organotin Compounds (DBT, DOT, TBT) | Structural PVC Stabilizer | EN ISO 17353 / derivatization GC-MS | 0.1 percent tin by weight | Batch-to-batch masterbatch mix |
| Fluorinated Compounds (PFOA, PFOS, PFCAs) | Fluoropolymer Topcoat | CEN/TS 15968 / LC-MS-MS | 25 ppb (PFOA / POPs Regulation) | Surface coat weight application |
| Heavy Metals (Lead, Cadmium, Antimony) | Pigment and Flame Retardant | EN 16711-1 / ICP-OES | 100 mg/kg total metal content | Lot-to-lot raw material quality |
Layer isolation directly alters regulatory compliance outcomes. Dimethylformamide is capped at 1000 mg/kg under REACH Annex XVII Entry 72 for skin-contact textiles, measured via gas chromatography under DIN EN ISO 23134 with a limit of quantification of 50 mg/kg. If European Chemicals Agency lists reduce that limit to 100 mg/kg, composite test certificates for multi-pass polyurethane fabrics become obsolete.
Enforcing REACH Annex XVII Entry 72 on a per-layer basis shifts the regulatory benchmark from bulk average weight to peak local concentration, eliminating standard mill composite testing allowances.


Prior
Constructing accurate prior distributions is essential for Bayesian sampling on technical fabrics. These priors integrate historical test logs, masterbatch batch sheets, reaction stoichiometry, and drying models into statistical density functions. Using flat or uninformative priors when sample sizes are small reduces the model to a classical estimator, discarding useful process history.
Informative priors reflect physical plant constraints. A polyurethane topcoat line using automated dosing pumps cannot exceed a maximum add-on rate without flooding the web and causing visible flaws. That boundary allows engineers to cap prior distributions at a definitive upper limit.
Similarly, reaction kinetics define minimum residual monomer levels in acrylic lacquers, establishing lower bounds for informative gamma distributions.
Reviews of converter dispute files show that the primary point of failure lies in unstated composite sample preparation protocols.
When prior parameters originate from supplier test certificates, compliance teams must adjust for laboratory measurement uncertainty. Supplier certificates typically reflect clean bench trials rather than full-width production runs. Applying a variance expansion factor to supplier priors widens the scale parameter, buffering against process variations during commercial runs.

Constructing Prior Distributions from Masterbatch Data
Masterbatch dosing logs supply empirical data for constructing prior distributions on non-volatile additives like flame retardants and heavy metal pigments. Liquid PVC plastisol prepared in three-thousand-liter batches uses automated load cells for plasticizers and hopper scales for solid stabilizers. Load cell accuracy specifications establish the initial shape of the batch concentration prior.
Conversion factors translate batch ratios into expected dry fabric concentrations. Plasticizer volatilization during gelling reduces soft PVC plasticizer mass by two to five percent, depending on stenter dwell time and airflow. Modeling this loss with a conjugate normal-inverse-gamma prior aligns the mean with target formulation minus expected thermal loss, while variance accounts for historical stenter temperature swings.
Selecting appropriate prior distributions directly influences overall statistical sample efficiency.
Substrate absorption influences prior variance in lower tie coats. High-filament woven backings draw liquid tie coat resins into yarn gaps, altering coat weight per unit area. Tie coat concentration priors must account for substrate weave, widening the scale parameter when transitioning from plain-weave to satin-weave backings.

Is Layer Separation Required during Analytical Extraction?
Physically separating layers prior to solvent extraction is necessary whenever regulations target localized coating phases rather than total fabric mass. Whole-fabric extraction dilutes concentrated inner layers below analytical thresholds, generating false passes that fail border audits. Cryogenic microtomy, precision surface scraping, and selective chemical delamination serve as primary laboratory methods for layer isolation.
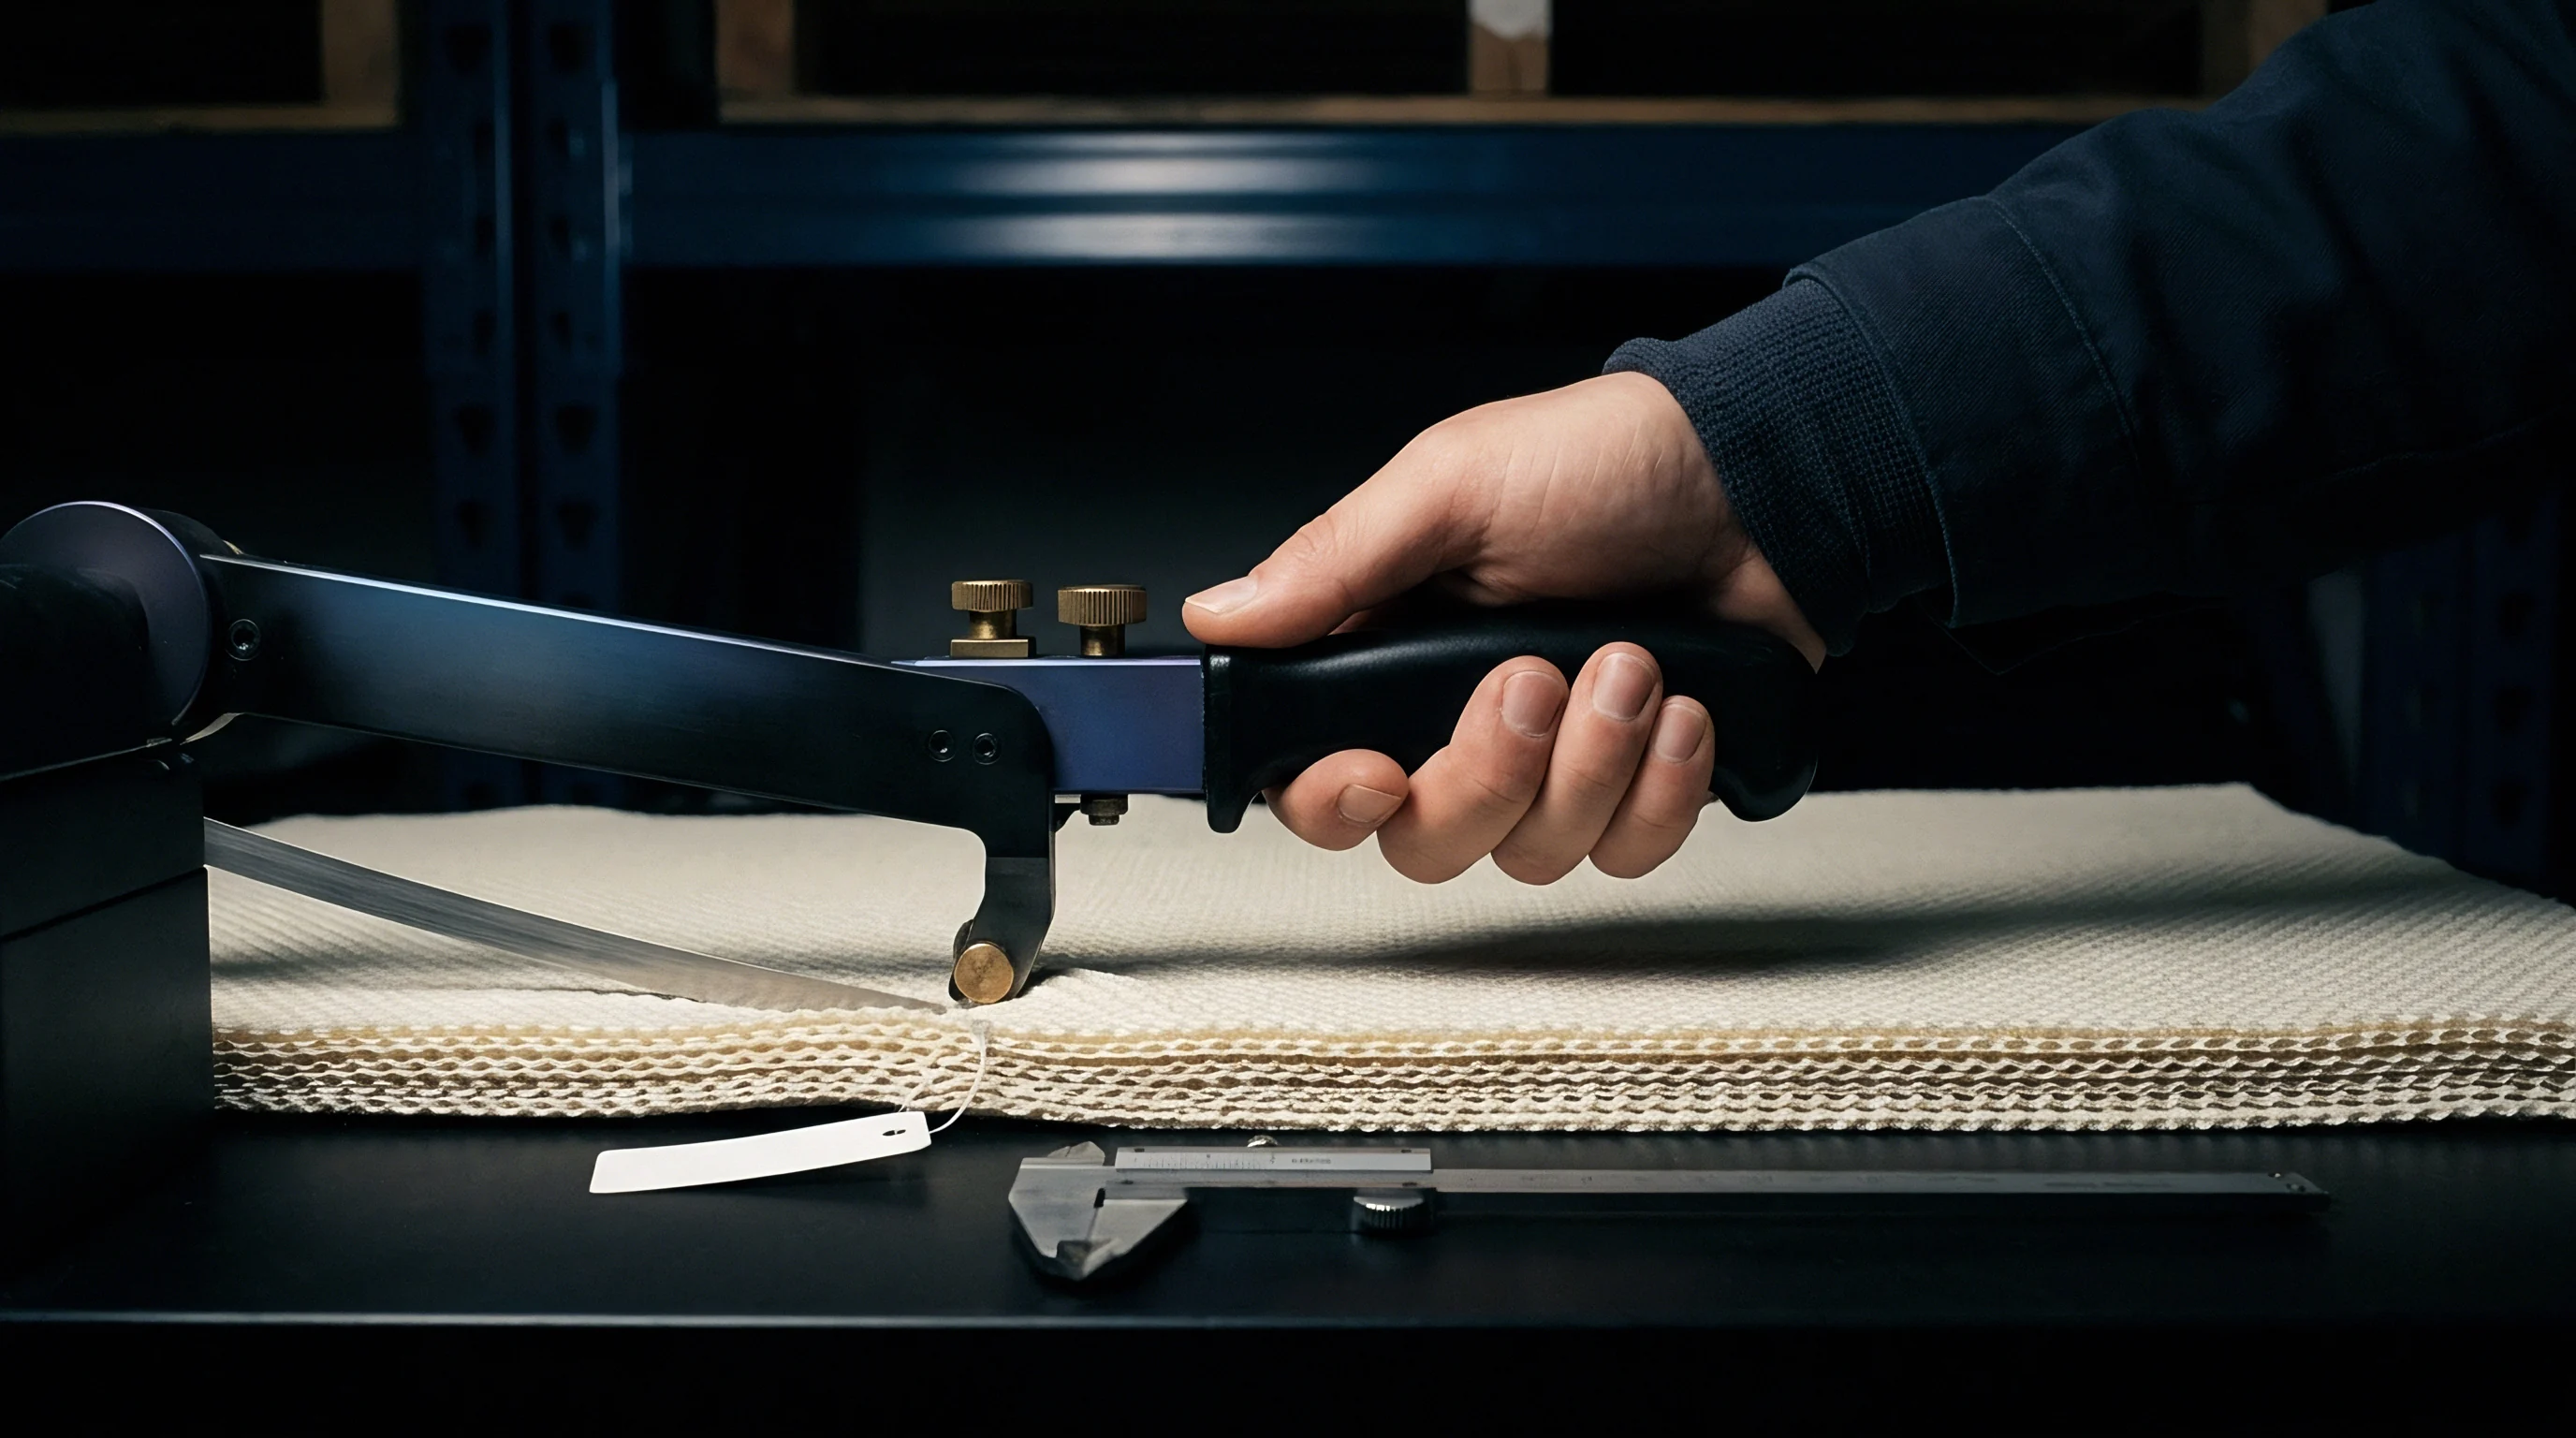
Cryogenic microtomy slices frozen fabric specimens horizontally at micrometer increments, producing sections that correspond to distinct coating layers. Precision surface scraping uses micro-spatulas under magnification to remove top lacquers and skin coats without disturbing tie coats or substrate yarns. Selective chemical delamination uses solvent pairs to swell adhesive bonds, allowing layers to peel apart cleanly before extraction.
Isolating layers requires strict handling controls to prevent cross-contamination between coats. The sequence below outlines the step-by-step extraction procedure for multi-layer fabric verification.
- Mount a twenty-by-twenty millimeter swatch of technical fabric onto a Peltier cooling stage maintained at minus forty degrees Celsius to freeze all elastomeric phases.
- Section the frozen specimen horizontally using a microtome blade set at fifteen-micrometer stroke increments to isolate the upper surface topcoat layer from underlying foam beds.
- Collect the isolated topcoat section shaves into a pre-weighed glass extraction vial and record the dry sample mass using a calibrated analytical balance with zero point zero one milligram precision.
- Dispense five milliliters of HPLC-grade tetrahydrofuran into the vial to achieve complete polymer matrix dissolution of the isolated surface layer shaves.
- Agitate the sealed vial in an ultrasonic bath at thirty-five degrees Celsius for forty-five minutes to extract all target low molecular weight organic constituents into the liquid phase.
- Filter the extract through a zero point two two micrometer polytetrafluoroethylene syringe filter directly into an autosampler vial for gas chromatography mass spectrometry injection.
An estimated fourteen percent inter-layer migration coefficient for volatile organotin stabilizers during hot-air stenter drying cycles represents an unverified process parameter that cannot be stated with absolute certainty. Buyers managing this parameter gap require physical layer-isolated gas chromatography verification on every third incoming production lot.
The inspection team absorbed a twelve thousand euro retesting penalty after accepting a univariable prior distribution that failed to capture plasticizer migration across the adhesive interface.


Inference
Posterior inference algorithms merge prior distributions with laboratory test data to reach clear accept or reject decisions. Classical hypothesis tests rely on p-values, which evaluate the probability of sample data under a null hypothesis rather than providing the direct probability of lot compliance. Bayesian posterior inference calculates the explicit probability that chemical concentrations remain below legal thresholds, establishing a firm basis for lot release.
Markov Chain Monte Carlo algorithms, specifically Metropolis-Hastings and Gibbs sampling, draw samples from complex, non-conjugate posterior distributions. When microtome sectioning restricts laboratory sample sizes, numerical MCMC methods approximate posterior density without relying on normality assumptions that fail on small sample sets.
Bayesian posterior updates significantly reduce sample sizes required for destructive testing. Analyzing three specimens from a high-risk lot alongside an informative prior yields statistical confidence equivalent to fifteen samples under a classical plan, cutting testing costs while maintaining consumer risk protections.
Markov Chain Monte Carlo Sampling Engines
MCMC algorithms construct Markov chains that converge on target posterior distributions across layer stacks. Gibbs sampling draws each unknown variance component and layer mean from its full conditional distribution while holding other parameters fixed, simplifying multi-layer variance estimation into univariate steps.
Verifying convergence requires monitoring scale reduction factors and effective sample sizes across independent chains. When evaluating volatile solvents in polyurethane coatings, spatial autocorrelation across roll width can slow chain mixing, necessitating thinner sampling intervals and longer burn-in runs to eliminate bias. Poorly mixed chains indicate unmodeled structural variance, signalling floor-level process shifts.
Posterior updates yield direct credible intervals for chemical concentrations. A ninety-five percent Bayesian credible interval defines the range containing the true mean concentration of a layer. If the upper bound remains below statutory thresholds, the quality system can automatically clear the lot.
Key boundary conditions for Bayesian acceptance updates include:
- Prior Distribution Precision must reflect verified historical batch performance metrics rather than uncalibrated mill target specifications.
- Likelihood Function Calibration must incorporate certified laboratory measurement uncertainty values derived from round-robin test proficiency trials.
- Convergence Parameter Thresholds must maintain Gelman-Rubin scale reduction metrics below one point zero one across all sampled chains.
- Loss Function Asymmetry must penalize false acceptance outcomes at least twenty times more heavily than false rejection outcomes.
Uncertainty from analytical variance directly skews posterior density calculations.
Small production lots frequently conceal substantial chemical compliance risks.
Bayesian risk models incorporate asymmetric loss functions to reflect commercial liabilities. Standard quadratic loss functions treat overestimation and underestimation as equally costly, but real-world liabilities are lopsided. Releasing a non-compliant lot that causes a product recall costs far more than rejecting a conforming batch.
Asymmetric loss functions, such as the Linex function, adjust acceptance thresholds downward to protect buyers against market exposure.

Decision Risk Analysis and Sensitivity Bands
Bayesian acceptance decisions directly govern producer risk alpha and consumer risk beta. Producer risk represents the probability that a conforming lot is rejected by the sampling plan, while consumer risk is the probability that a non-compliant lot passes inspection. Bayesian plans allow compliance teams to enforce a fixed upper bound on consumer risk regardless of batch size.
Sensitivity analysis highlights the practical advantage of Bayesian sampling over classical ISO 3951-1 variables plans. Evaluating a synthetic lot of five thousand meters of polyvinylidene fluoride architectural membrane tested for residual dimethylformamide illustrates the point. The statutory limit is 1000 mg/kg under REACH Annex XVII Entry 72; the true lot mean concentration is 850 mg/kg, with a localized standard deviation of 120 mg/kg in the lower tie coat.
| Sampling Methodology | Sample Size (N) | Prior Information Status | Producer Risk (Alpha) | Consumer Risk (Beta) | Lot Acceptance Decision |
|---|---|---|---|---|---|
| ISO 3951-1 Variable Plan (s-method) | 3 | None (Classical) | 0.142 | 0.088 | Accepted (False Pass) |
| ISO 3951-1 Variable Plan (s-method) | 10 | None (Classical) | 0.035 | 0.012 | Rejected (Correct) |
| Bayesian Acceptance Sampling Plan | 3 | Informative Masterbatch Prior | 0.018 | 0.004 | Rejected (Correct) |
| Bayesian Acceptance Sampling Plan | 3 | Diffuse Non-Informative Prior | 0.115 | 0.062 | Accepted (False Pass) |
| Bayesian Acceptance Sampling Plan | 5 | Informative Masterbatch Prior | 0.003 | 0.001 | Rejected (Correct) |
This comparison shows that classical variables sampling with small sample sizes overlooks non-compliance caused by localized layer variance, leaving consumer risk at an unacceptable eight point eight percent. In contrast, the Bayesian model using an informative prior reduces consumer risk to zero point four percent with three physical samples. When diffuse priors replace informative ones, the Bayesian advantage evaporates, underscoring the reliance of sample efficiency on prior quality.
A posterior probability of non-compliance below 0.02 is required under EN ISO 17025 verification protocols before releasing medical-grade polyurethane coated fabrics from import quarantine.
Whether variograms derived from spatial micro-sampling can reliably predict long-term plasticizer bleed in dynamic flame-retardant architectural membranes remains an unresolved mathematical question.


Swatch
Sampling protocols dictate whether downstream lab testing and Bayesian models yield valid results. Taking swatches solely from roll ends introduces sample bias, as edge heat loss in stenter ovens alters solvent evaporation along margins. Representative sampling requires pulling specimens across both warp and weft directions.
Grinding composite swatches represents a frequent point of failure in commercial textile testing. Pulverizing a multi-layer membrane in a rotary mill mixes heavy polyester base yarns with thin functional lacquers, averaging chemical concentrations across the matrix and diluting localized violations below detection limits.
Applying asymmetric loss functions directly reflects commercial financial liabilities.
Standard composite sample preparation risks clearing non-compliant fabric for market entry. A fabric carrying heavy flame-retardant loads in an interior foam layer can pass bulk testing because clean surface coats and substrate yarns dilute the overall sample mass. Microtome depth profiling or surface layer isolation isolates the non-compliant layer, producing analytical findings that withstand regulatory audit.

Specimen Preparation Protocols and Dilution Risks
Preparing specimens for compliance testing requires precise layer isolation to prevent cross-contamination and dilution. Cutting with uncooled rotary blades generates friction heat that volatilizes sensitive residual solvents prior to extraction. Cryogenic freeze-milling or precision scalpel sectioning under controlled temperatures preserves sample integrity.
Dilution calculations illustrate how composite grinding hides local non-compliance. Consider a three-layer fabric weighing six hundred grams per square meter: heavy polyester base yarn accounts for three hundred grams per square meter, the PVC foam coat adds two hundred and fifty grams per square meter, and a thin PVDF topcoat contributes fifty grams per square meter containing a restricted fluoro-surfactant at five hundred milligrams per kilogram.
The selection of laboratory extraction methods directly dictates observed chemical yields.
Grinding the whole fabric yields a calculated average of forty-one point six milligrams per kilogram, passing a fifty milligram per kilogram threshold. Isolating the topcoat via microtome sectioning reveals the true concentration of five hundred milligrams per kilogram ~ ten times the statutory limit. The table below compares composite grinding with microtome depth profiling across five substance classes.
| Target Chemical Class | Physical Preparation Method | Dilution Mass Factor | Observed Recovery Rate | False Compliance Probability |
|---|---|---|---|---|
| Fluorinated Topcoat Surfactants | Whole-Fabric Composite Grinding | 12:1 Mass Dilution | 18 percent | 0.82 |
| Fluorinated Topcoat Surfactants | Microtome Layer Isolation | 1:1 Isolated Layer | 96 percent | 0.01 |
| Tie Coat Residual Solvents (DMF) | Whole-Fabric Composite Grinding | 4:1 Mass Dilution | 35 percent | 0.44 |
| Tie Coat Residual Solvents (DMF) | Microtome Layer Isolation | 1:1 Isolated Layer | 92 percent | 0.02 |
| Organotin Plastic Stabilizers | Whole-Fabric Composite Grinding | 2:1 Mass Dilution | 62 percent | 0.15 |
The data confirms that whole-fabric grinding causes systematic dilution, generating false compliance probabilities up to eighty-two percent for topcoat additives. Microtome isolation eliminates dilution bias, providing accurate recovery rates that prevent non-compliant materials from entering inventory.

Analytical Error Propagation in Multi-Layer Testing
Instrument uncertainty propagates non-linearly through multi-layer Bayesian engines. Gas chromatography mass spectrometry calibration curves, solvent extraction yields, and analytical balance limits introduce noise into concentration measurements. If instrument error is not separated from material variance, posterior variance inflates, artificially driving up required sample sizes.
Instrument variance is modeled using laboratory round-robin proficiency data. Repeated runs with certified reference standards establish the baseline precision matrix for chromatographic equipment. Subtracting known instrument variance from total variance isolates true physical material variation across rolls.
Incorporating posterior updates systematically reduces required sample sizes during testing.
Micro-sampling introduces higher relative measurement uncertainty due to small sample masses. Weighing a five-milligram section of microtomed topcoat requires a micro-analytical balance with sub-microgram resolution to prevent weighing error from skewing variance calculations. Primary failure modes in multi-layer sample preparation include:
- Thermal Volatilization Loss occurs when high-speed mechanical cutting tools heat specimen margins, driving off volatile residual solvents prior to extraction vials sealing.
- Cross-Layer Contamination happens when rotary microtome blades drag soft internal plasticizer formulations across cleanly cut surface topcoat layers during sectioning.
- Solvent Channeling Bias emerges during extraction when dense synthetic substrate yarns impede liquid solvent penetration into interior tie coat matrices.
- Mass Fraction Distortion arises when manual scalpel scraping incorporates variable quantities of un-additivated substrate fiber into topcoat sample fractions.
Under REACH Annex XVII Entry 51, detecting DEHP above 0.1 percent by weight in any individual coating layer triggers immediate lot seizure regardless of total roll mass dilution.
Physical separation of structural layers provides more defensible laboratory evidence than full-thickness mechanical pulverization when submitting compliance dossiers to border authorities.

Escrow
Supply contracts for multi-layer technical fabrics require explicit legal mechanisms to enforce layer-specific compliance. Purchase orders specifying only fabric weight, tensile strength, and general restricted substance lists leave buyers exposed to customs detentions. When authorities hold containers over localized layer violations, generic warranty clauses often collapse into lengthy international disputes over sampling definitions.
Enforceable contracts feature explicit line-item specifications mandating layer-isolated testing. Purchase agreements should define laboratory preparation protocols, analytical methods, prior distribution parameters, and Bayesian decision rules for lot acceptance. Establishing these criteria upfront in the order eliminates ambiguity when shipments are rejected based on microtome depth profiling.
Customs detentions quickly stall incoming cargo shipments and disrupt downstream supply chains.
Managing financial exposure relies on escrow arrangements tied to certified analytical reports. Under an escrow structure, a significant portion of the order payment remains in an independent account until incoming swatches pass Bayesian evaluation. If customs testing reveals non-compliance, the buyer draws directly on escrow funds to cover re-exporting, re-testing, or reprocessing costs without pursuing offshore suppliers in foreign courts.
Commercial Purchase Order Compliance Mechanics
Drafting sound compliance clauses requires defining technical standards and legal obligations explicitly. Contract terms must state that regulatory thresholds apply to each individual coating layer, film, lacquer, and substrate component. Broad references to whole-fabric averages leave importers vulnerable to enforcement under European and North American regulations.
Contracts must clearly allocate testing costs and re-inspection rights. While the buyer covers initial screening, terms should specify that lots failing Bayesian acceptance criteria trigger full laboratory fee reimbursement by the supplier. Additionally, suppliers must absorb port storage fees, demurrage charges, and re-export penalties when non-compliant shipments are detained.
Chemical and mechanical delamination isolates individual coating layers for targeted testing.
Defensible compliance files require traceable documentation linking container seals directly to accredited test reports. Mill transaction certificates must detail the exact batch numbers within the shipment; any mismatch between manifest numbers and laboratory certificates breaks the chain of custody and invalidates the dossier during brand audits.

Border Detention Dossier Assembly and Defence
Resolving border detentions requires assembling a comprehensive technical dossier without delay. Customs officials and product safety agencies reject self-declarations and generic certificates of conformity. A complete clearance dossier contains accredited third-party test reports, raw material masterbatch declarations, roll traceability logs, and the formal statistical acceptance report.
Bayesian acceptance sampling documentation carries substantial weight during regulatory reviews. Providing enforcement officers with a statistical report detailing prior inputs, MCMC posterior distributions, and explicit Bayes risk calculations demonstrates thorough importer due diligence. This evidence proves that the sampling plan held consumer risk within statutory bounds, protecting against allegations of gross negligence.
If border authorities detain a shipment based on rapid surface screening, the importer should file an immediate appeal. The submission presents layer-isolated chemical analysis from an accredited laboratory, demonstrating that screening results were skewed by surface contamination or improper sample preparation. The table below outlines the essential structural elements of a commercial clearance file.
Relying on unverified prior assumptions introduces severe bias into statistical compliance models.
Residual solvents gradually migrate toward outer coating surfaces during storage.
Classical variables sampling consistently underestimates localized material variance in layered composites.
Informative priors built from verified masterbatch dosing records reduce necessary destructive sample draws while tightening consumer risk bounds.
Establishing joint escrow accounts tied to analytical verification protocols provides a practical commercial mechanism for managing lot rejections without disrupting production schedules.