Cross Sectional Dye Concentration Profiling for Micro Capillaries Mass Transport Model Verification
Cross-sectional profiling verifies internal fiber dye diffusion to prevent fastness failures caused by ring dyeing in fine synthetic yarns.

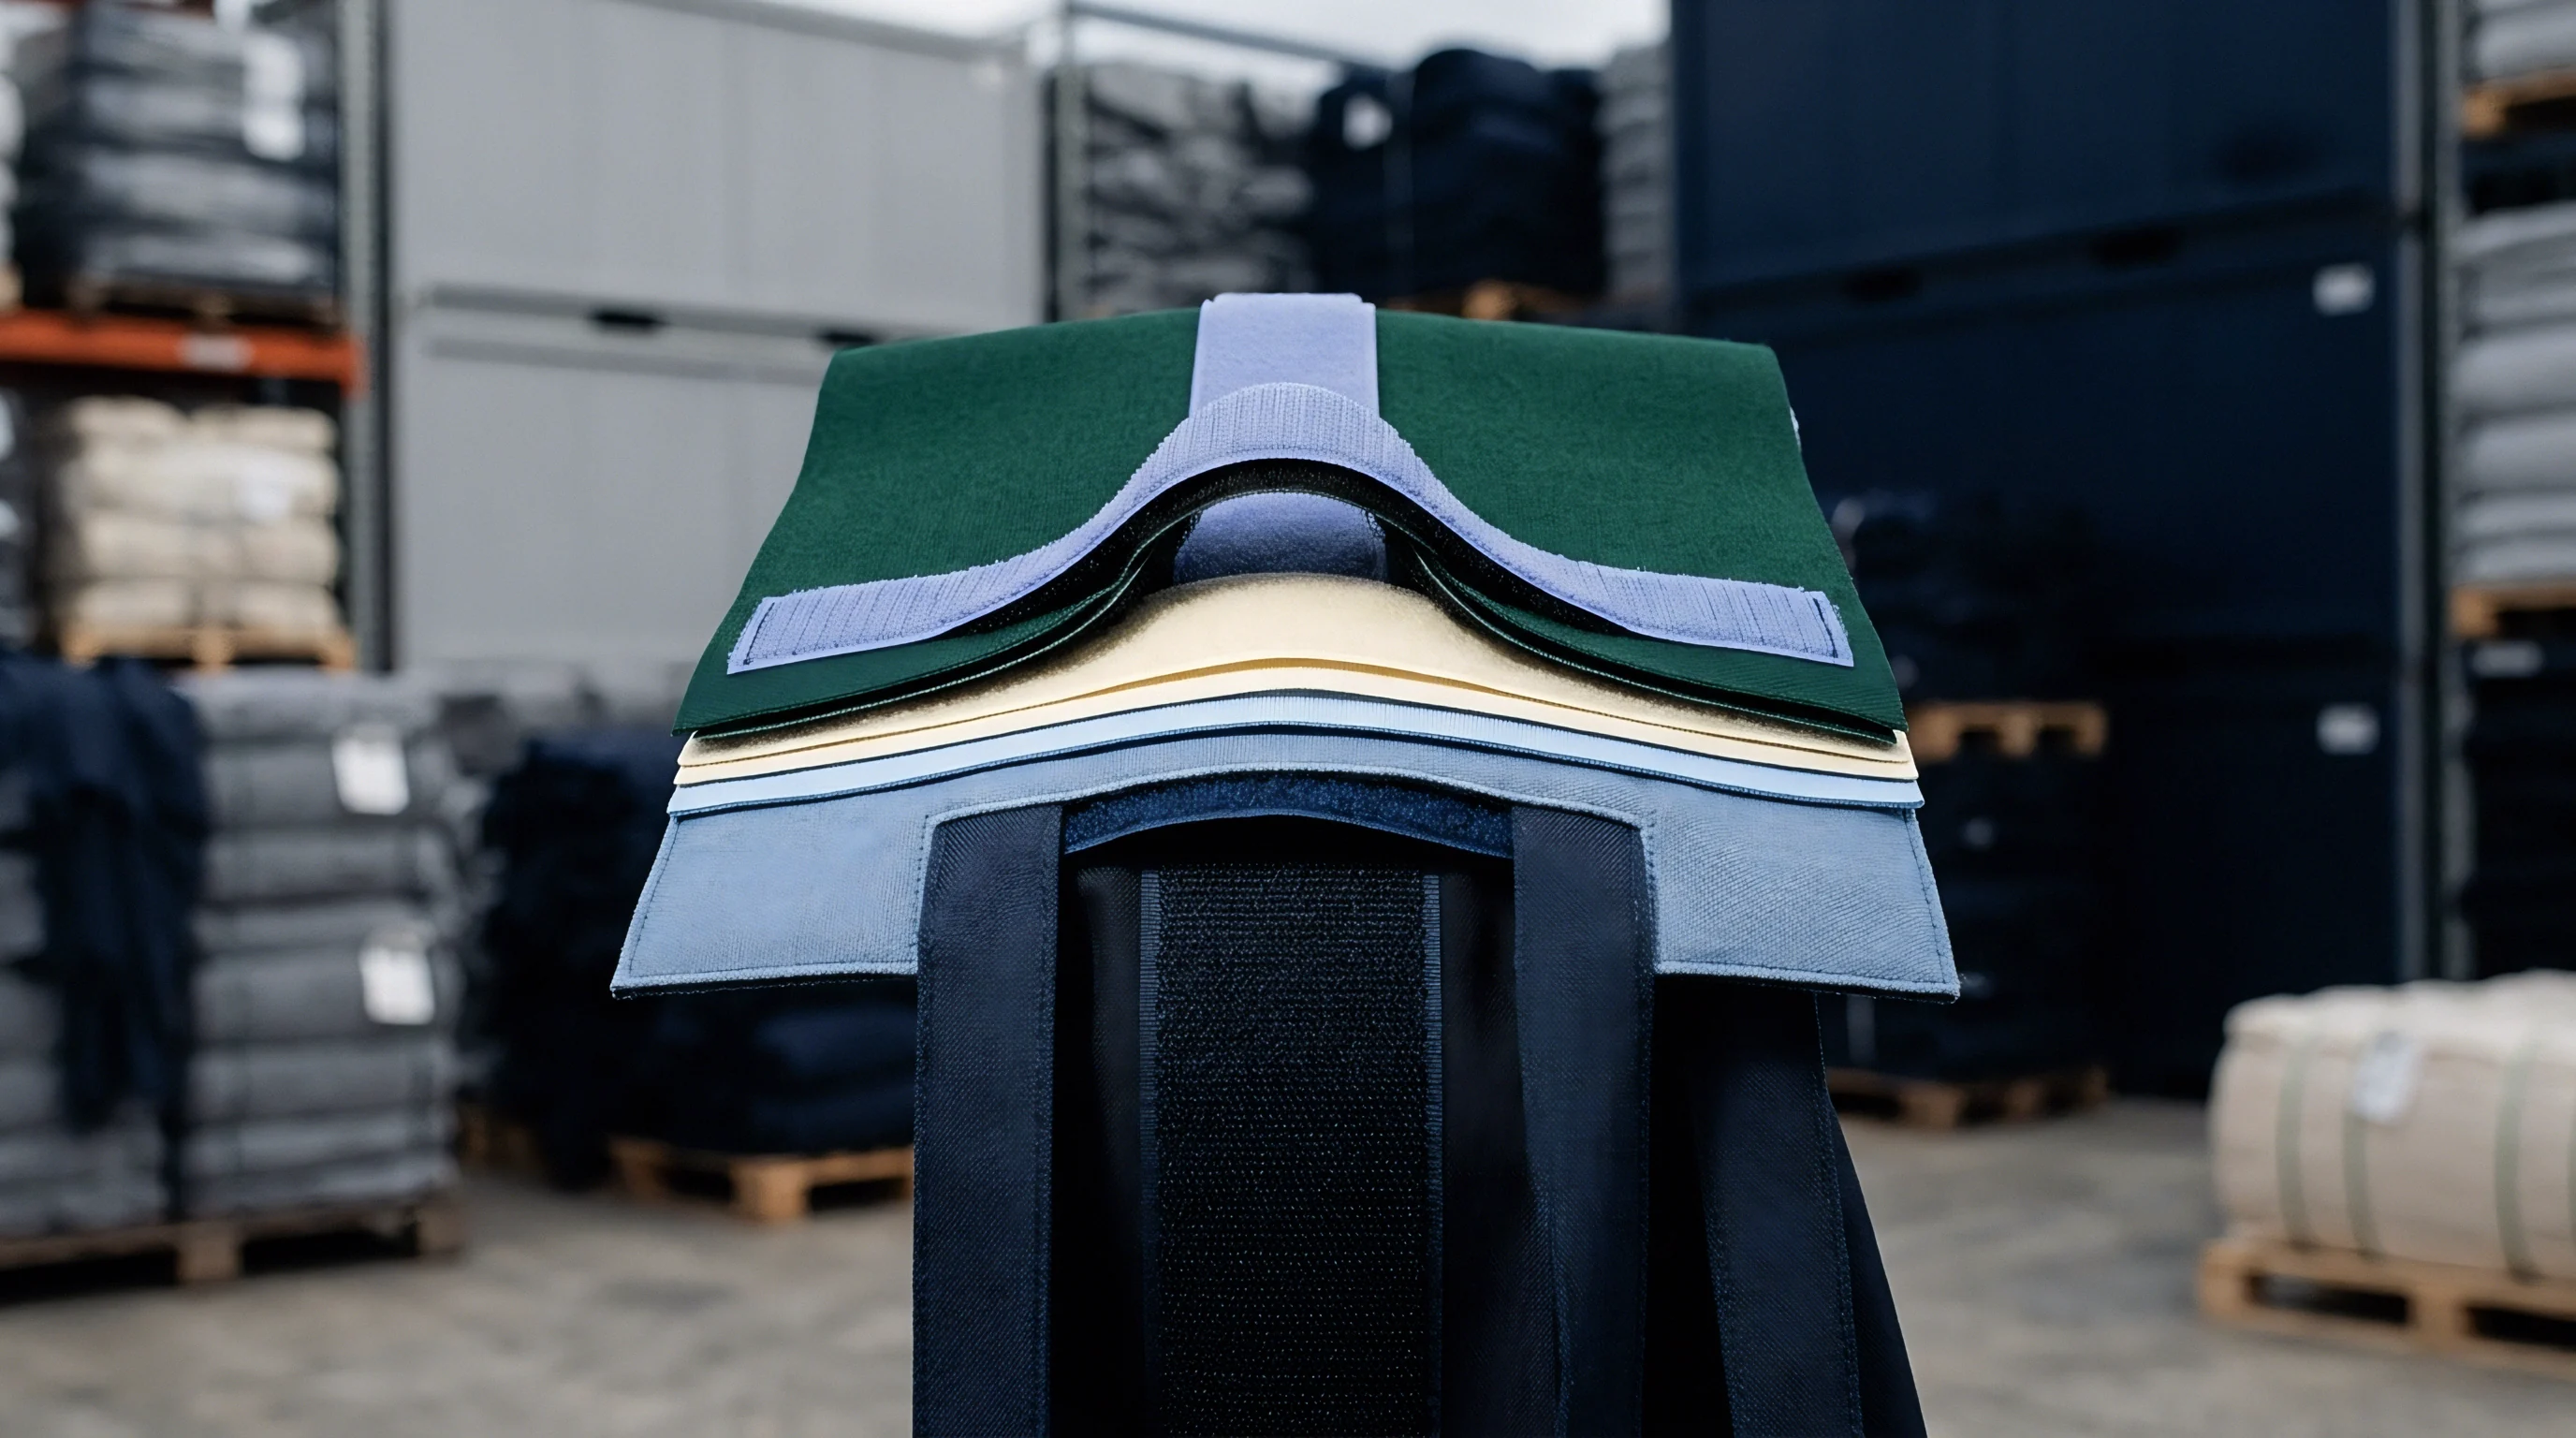
Slice
Micro-capillary dye penetration determines colorfastness, apparent depth, and levelness across fine-filament textiles. A finished polyester microfiber yarn composed of one hundred forty-four filaments at seventy-five denier presents an average single-filament diameter of approximately eight micrometres. When dye liquor circulates through a compressed yarn package, fluid advection moves through the inter-filament capillaries while pure diffusion governs molecular transport from the filament perimeter toward the core.
Measuring this internal concentration gradient requires physical cross sectioning without mechanical distortion. Standard microtome preparation easily crushes synthetic microfibers, creating false penetration artifacts where dye appears forced into interior voids. Technicians embed conditioned yarn bundles in a low-viscosity epoxy resin cured at sixty degrees Celsius for twenty-four hours.
This thermal window prevents heat-induced dye migration inside the polymer matrix during polymerization. The cured resin block undergoes ultramicrotomy using a fresh glass or diamond knife, slicing target sections to a thickness between one and two micrometres. The capillary radius governs flux.
Cutting forces introduce compressive shear along the knife advance vector. Softer embedding media deform under the blade, compressing circular fiber cross sections into elliptical geometries and smearing surface dye deposits across internal zones. The technician maintains knife clearance angles between four and six degrees with a cutting speed of one millimetre per second.
Dry cutting produces severe chatter marks that ruin optical measurement. Collecting cut sections onto an aqueous bath containing five percent isopropyl alcohol reduces surface tension, enabling smooth ribbon collection onto standard glass slides. The strike rate doubles.
Embedding resin hardness matches filament resistance to prevent mechanical cross section distortion during diamond knife contact.
Fiber bundle packing densities shift during package winding, creating local voids that range from fifteen to sixty percent inter-filament volume. In tight winding zones, fibers flatten against neighboring boundaries, restricting the circumferential surface area available for liquor contact. The technician documents bundle orientation before sectioning.
Transverse sections reveal whether the dye front advances symmetrically from all perimeter points or enters preferentially through exposed peripheral sectors. Dye strikes the surface instantly. Core filaments remain undyed.
When lab strike-offs fail visual shade checks despite proper bath exhaustion percentages, incomplete radial penetration is the primary mechanical cause. The dyehouse typically claims the fiber manufacturer altered the polymer drawing ratio or heat-setting history, pointing to raw material variation rather than investigating package winding tension profiles.


Flux
Mass transport within micro-capillary networks combines convective flow through interstitial pores and Fickian diffusion into individual solid polymer cylinders. The Hagen-Poiseuille relationship models liquor transport along yarn interstitial channels, where volumetric flow rate scales with the fourth power of the hydraulic pore radius. In micro-denier yarns, inter-filament pore radii frequently measure under two micrometres.
Pumping pressure drops rapidly across dense packages, creating steep liquor velocity gradients between outer and inner yarn layers. Once dye molecules reach the filament surface, mass transfer transitions from convective boundary layer transport to solid-state diffusion governed by the concentration-dependent diffusion coefficient of the specific dye-polymer couple. Finer fibers consume more dyestuff.

How Do Convective Fronts Override Radial Sorption?
Dye sorption proceeds through a progressive boundary mechanism. High convective liquor velocity maintains maximum surface dye concentration, driving a steep radial concentration gradient toward the filament axis. When bath flow stalls or channeling occurs, local boundary layer starvation drops the surface concentration below saturation equilibrium.
The dye fronts collide. Radial diffusion slows, leaving dye molecules localized in an outer annular ring. Mathematical models predicting exhaustion kinetics treat individual filaments as isolated infinite cylinders immersed in an infinite well-stirred bath.
Bulk dyehouse machines violate this assumption because tight mechanical packing forces filaments into mutual contact lines, shielding up to forty percent of the outer surface area from direct liquor contact.
Apparent radial diffusivity drops below ten to the power of minus fourteen square metres per second when yarn bundle packing density exceeds seventy percent.
Evaluating mass transport kinetics requires balancing fluid hydrodynamic drag against sorption rates across four dimensionless groups.
- Peclet Number Threshold confirms whether advective flow overrides capillary diffusion inside the interstitial voids.
- Damköhler Ratio Range balances the surface adsorption rate against mass transfer resistance across the hydrodynamic boundary layer.
- Tortuosity Factor Allowance corrects the bulk diffusion coefficient for irregular inter-filament geometry within textured multifilament yarns.
- Effective Capillary Radius establishes the fluid intake velocity under changing liquor viscosity and processing pressure.
Diffusion coefficients drop tenfold. When the bulk liquor temperature drops during rapid cooling cycles, polymer chain mobility in the amorphous zones freezes, locking the concentration profile in place before complete core saturation occurs.
| Transport Parameter | Physical Significance | Typical Measured Range | Process Impact on Uniformity |
|---|---|---|---|
| Hydraulic Pore Radius | Equivalent inter-filament capillary spacing | 0.8 to 2.4 micrometres | Governs interstitial flow velocity and head loss |
| Peclet Number | Ratio of advective to diffusive mass transport | 12.0 to 180.0 | Values above unity indicate advection-dominated flow |
| Damköhler Number | Ratio of dye reaction rate to convective mass transfer | 0.15 to 3.20 | High values cause severe outer ring dyeing |
| Radial Diffusion Coefficient | Solid-state transport within polymer matrix | 1.2e-15 to 4.5e-14 m²/s | Determines time required for total core penetration |
| Capillary Tortuosity Factor | Ratio of actual path length to bundle length | 1.25 to 1.85 | Higher twist levels increase flow path resistance |
The mathematical transport equation reliably forecasts radial penetration depths under steady liquor circulation, yet predicting how dynamic package compaction under high-pressure pump reversal alters local void fractions remains an open problem across industrial dyeing systems.
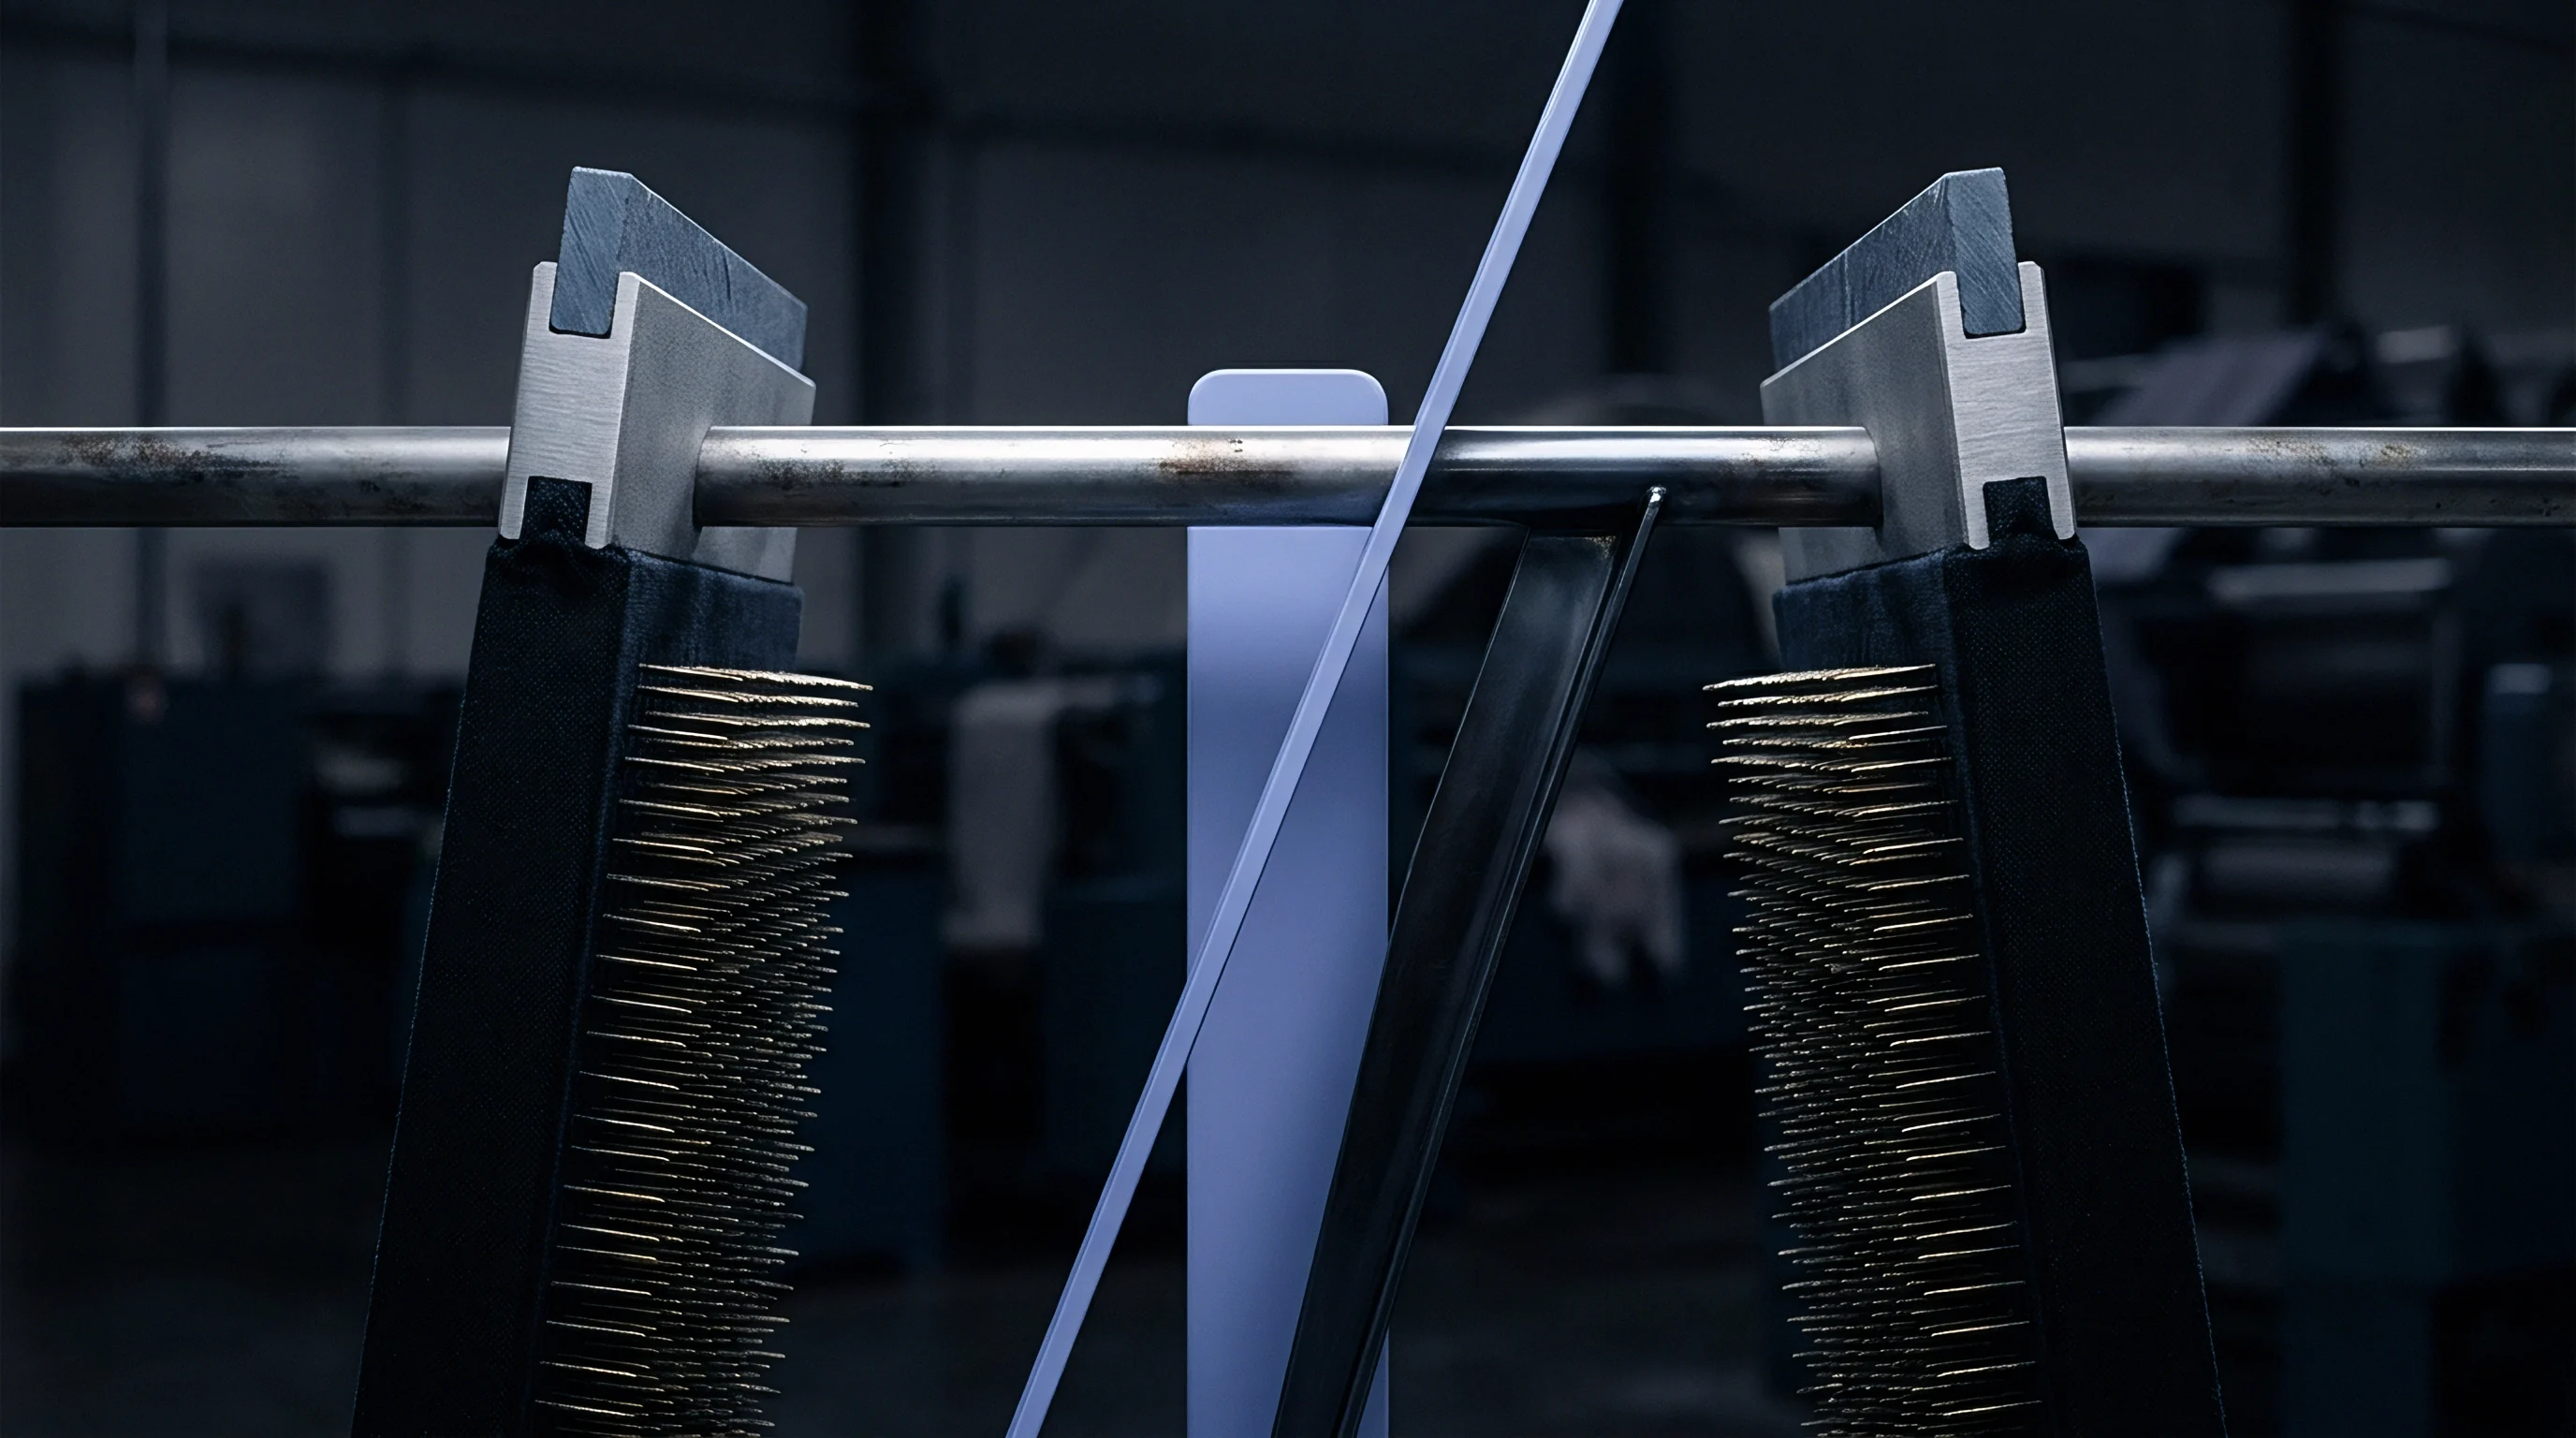
Lens
Microspectrophotometry quantifies dye concentration across thin sections with sub-micrometre spatial resolution. The instrument projects a monochromatic light beam through an optical microscope onto the mounted slice, measuring transmitted light intensity through an adjustable aperture. According to the Beer-Lambert law, optical absorbance correlates with the product of the molar extinction coefficient, optical path length, and local dye concentration.
Solid synthetic filaments introduce optical artifacts absent in liquid solutions. The cylindrical boundary acts as a lens, scattering incident rays at curved edges. The analyst mounts sliced specimens in an immersion liquid whose refractive index matches the embedding resin and the polyester substrate at 1.54 to eliminate interface refraction.
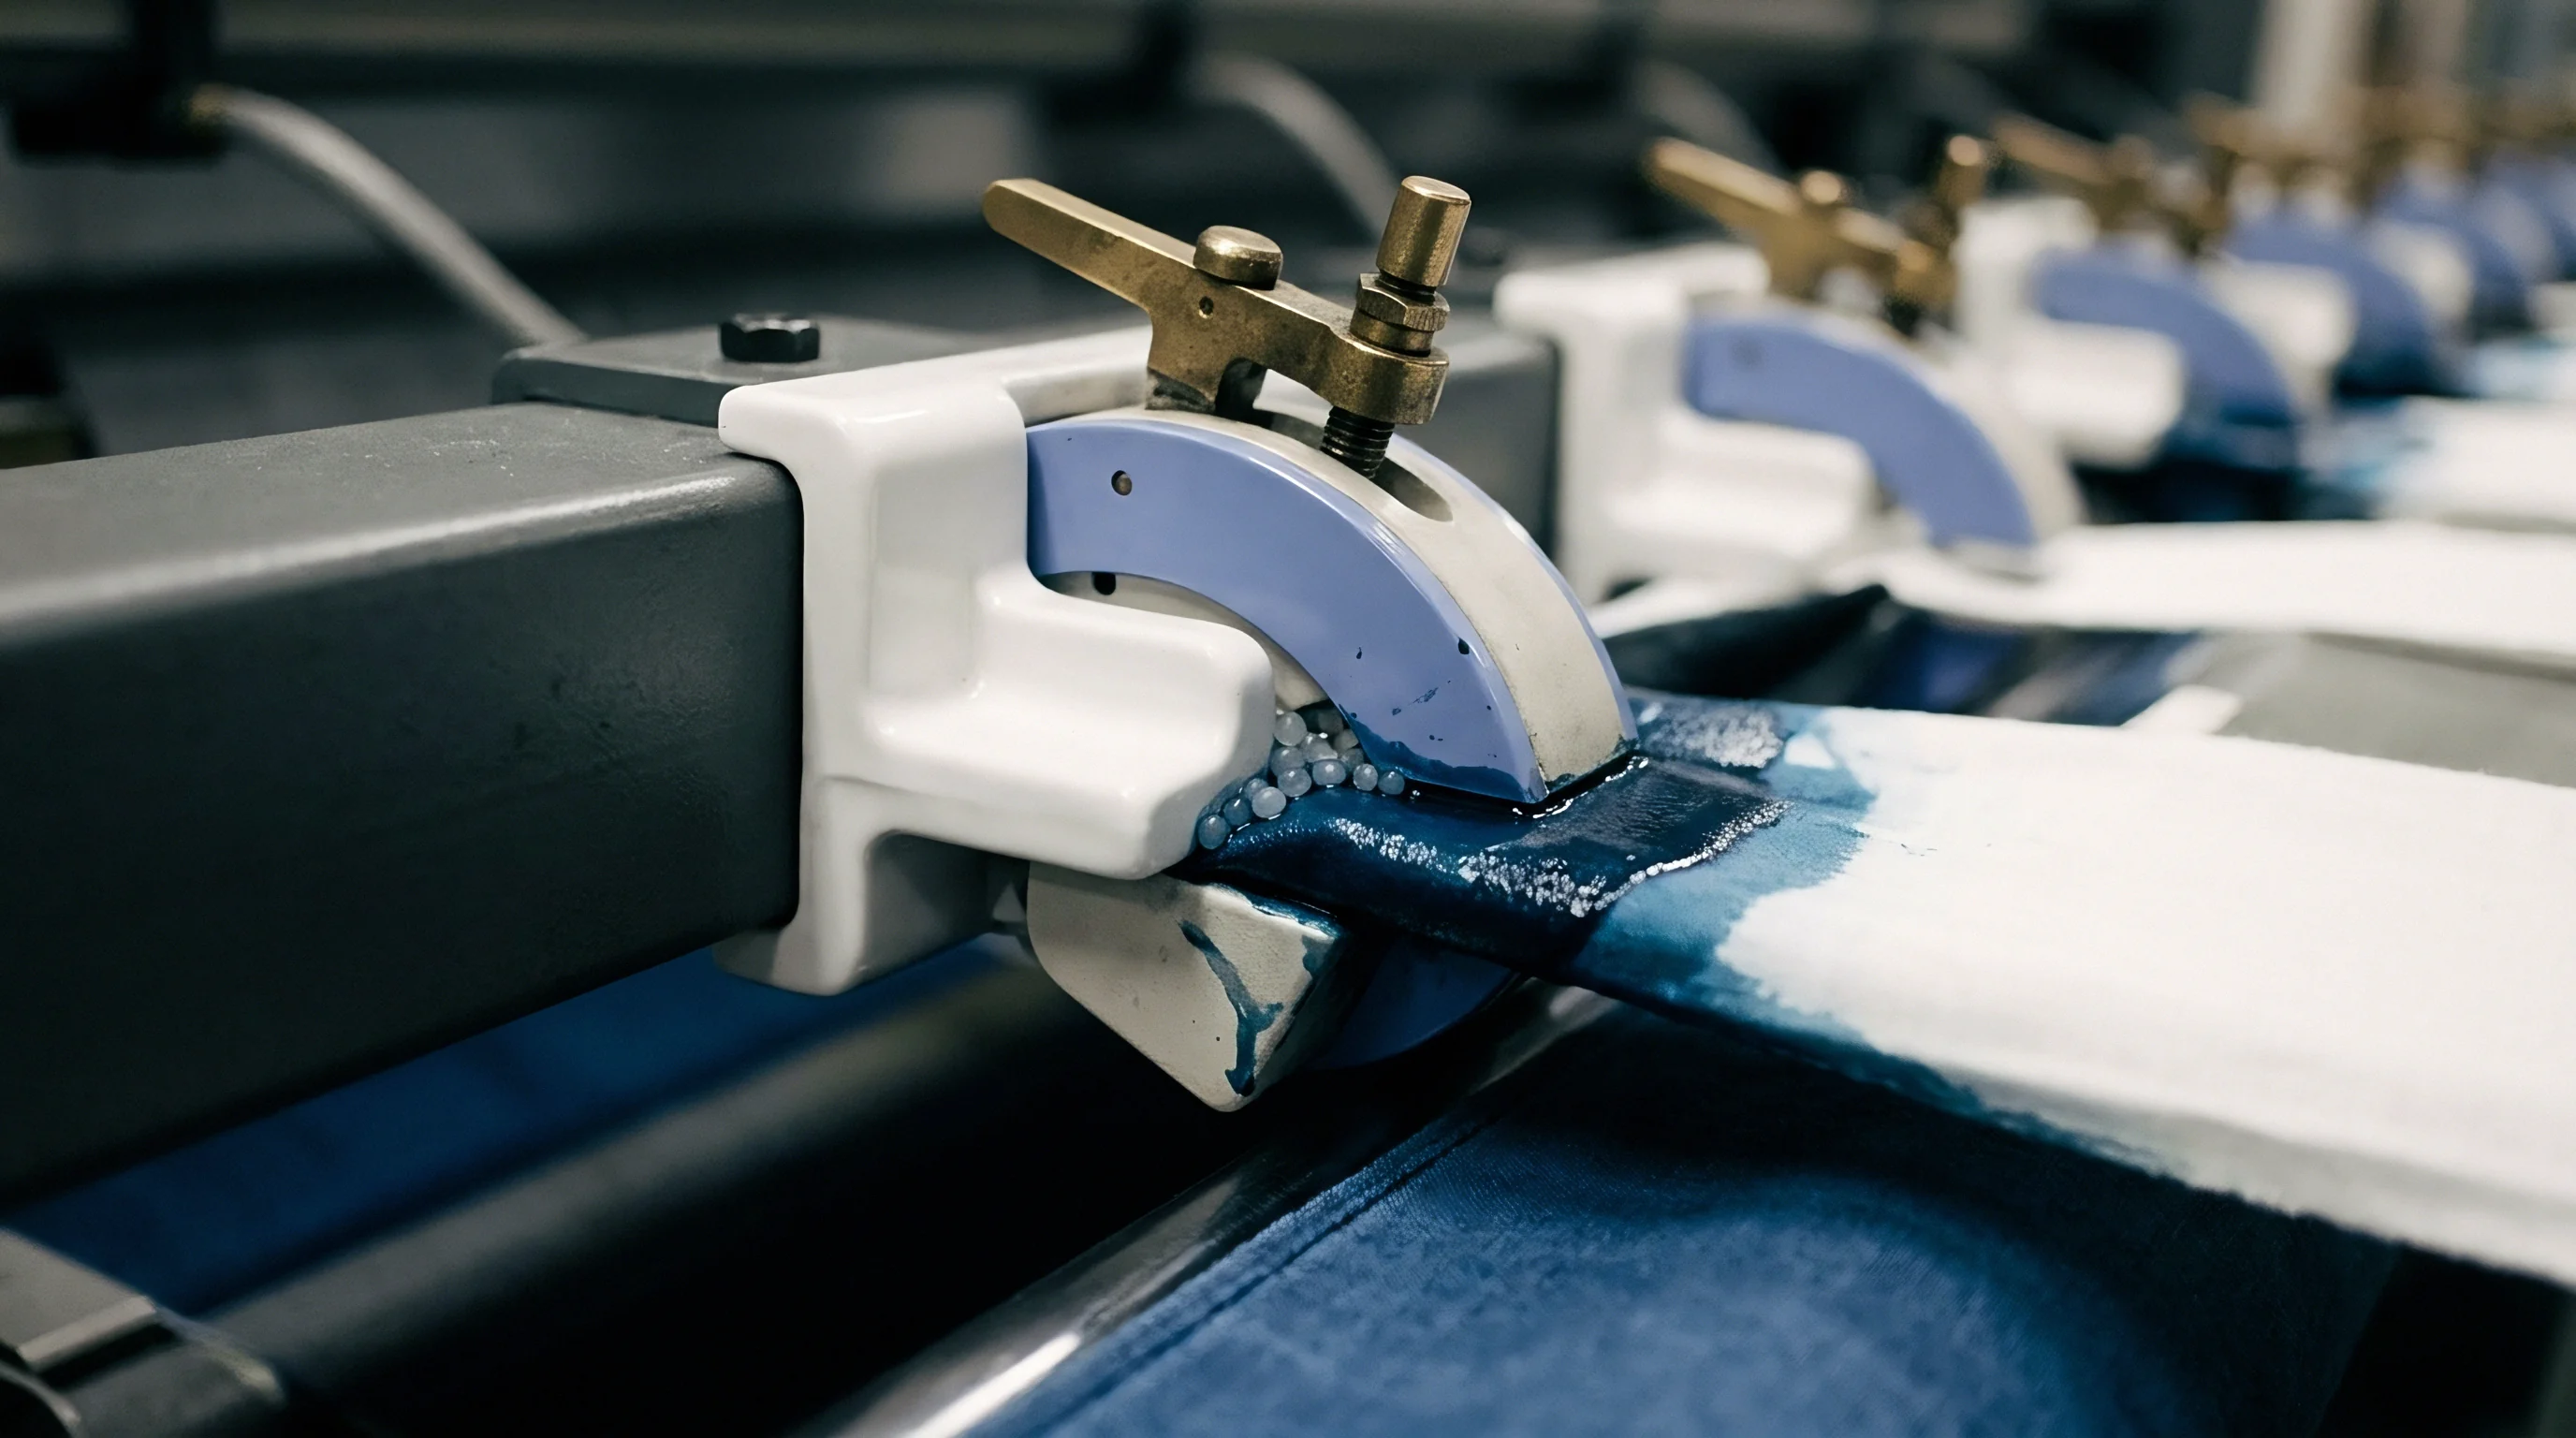
Why Do Optical Edge Artifacts Skew Calibration?
Transmission profiles recorded near filament perimeters frequently show apparent concentration spikes caused by total internal reflection rather than genuine dye accumulation. The knife edge dulls quickly. Correcting these boundary errors involves running a baseline profile on an undyed control filament prepared in the identical resin block.
Subtracting the blank absorbance profile cancels refraction losses and residual resin absorption. High-performance dyeings achieve filament concentrations where absorbance exceeds linear detector response. Dilution calibration curves generated from dyed polymer films of known thickness establish the upper limit of photometric linearity.
Beyond an absorbance of 1.8, stray light within the optical train flattens measured peaks, falsely suggesting a uniform concentration plateau across outer fiber zones.
Refractive index matching oil eliminates scatter at filament interfaces during transmission microspectrophotometry.
Consider an experimental test verification run. A thirty-denier polyester yarn with twenty-four filaments undergoes high-temperature exhaust dyeing with C.I. Disperse Blue 56 at one hundred thirty degrees Celsius. The target exhaustion reaches ninety-five percent, yielding a nominal fiber concentration of twenty grams dyestuff per kilogram of dry substrate.
The analyst cuts cross sections to two micrometres thickness and scans radial profiles from the outer perimeter to the center at fifty-nanometre spatial intervals using a beam aperture of 0.5 micrometres at six hundred nanometres wavelength.
- Calibrate the spectrophotometer against optical neutral density standards across the transmission range from five to ninety-five percent.
- Section embedded micro-capillary yarn bundles to a uniform slice thickness of two micrometres using a diamond knife microtome.
- Record transmission spectra in five-hundred-nanometre increments across the bundle cross section with a diffraction-limited beam aperture.
- Convert absorbance values to local concentration figures through the matrix-corrected extinction coefficient table.
The run stalls. The resulting dataset maps local dye distribution against radial coordinate normalized to unity at the fiber boundary.
| Radial Position (r/R) | Measured Absorbance | Actual Dye Content (g/kg) | Model Prediction (g/kg) | Deviation (%) |
|---|---|---|---|---|
| 1.00 (Perimeter) | 1.62 | 38.4 | 39.1 | -1.79 |
| 0.80 | 1.35 | 31.2 | 31.8 | -1.89 |
| 0.60 | 0.98 | 22.1 | 21.5 | +2.79 |
| 0.40 | 0.54 | 11.8 | 10.9 | +8.25 |
| 0.20 | 0.21 | 4.3 | 3.8 | +13.16 |
| 0.00 (Center) | 0.08 | 1.6 | 1.2 | +33.33 |
| Test conditions: Section thickness 2.0 micrometres, wavelength 600 nm, filament radius 4.2 micrometres, liquor ratio 10:1, dyeing hold time 30 minutes. | ||||
Matching the resin refractive index to the polymer core eliminates optical refraction artifacts across the interface.

Drift
Discrepancies between theoretical mass transport predictions and bulk finishing results originate from microscopic capillary variations across commercial yarn lots. Package density varies between package shoulders and package centers. In automated package dyeing machines, winding tension variations of five percent alter package permeability by up to twenty-five percent.
The outer layers receive excess liquor flow while dense inner layers suffer starved flow regimes. This mechanical unevenness produces severe radial profile drift across different packages in the identical dye bath. Penetration depth dictates color yield.

Predicting Wet Processing Failure Modes
Incomplete dye penetration causes catastrophic physical property failures in subsequent manufacturing stages. Disperse dyes concentrated exclusively within the outer three hundred nanometres of microfibers exhibit low fastness ratings under standard laundering. Wet rubbing transfers surface colorants onto adjacent lighter fabrics during domestic wear.
- Ring Dyeing Defect produces severe wash-fastness degradation when the outer annulus carries the complete dye mass while core filaments remain pale.
- Capillary Channeling Error generates longitudinal streaks along the cloth width because uneven yarn tension pinches inter-filament spaces.
- Boundary Layer Starvation leaves central fibers unpenetrated during rapid liquor circulation cycles in package dyeing.
- Thermal Migration Breakdown occurs during subsequent stenter heat-setting when disperse dye molecules move back toward the filament exterior.
Ring dyeing increases wet crocking. When dry heat setting runs at one hundred ninety degrees Celsius for heat-setting stabilization, high thermal exposure causes reverse diffusion. Disperse dye molecules migrate from the outer fiber layers back to the surface, recrystallizing as micron-scale particulate deposits on the filament perimeter.
Viscosity dictates the wash stage. The beam pressure drops.
When buyers fail to specify cross-sectional penetration limits during initial lab dips, bulk lots that match visual shade targets under primary illuminants display unacceptable shade changes under secondary store lighting, resulting in total consignment rejection at port arrival.

Scrap
Incomplete dye diffusion inflates production costs and destroys manufacturing margins. A mill producing micro-denier athletic apparel goods must balance machine hold times against energy consumption. Extending dye cycle dwell time from thirty minutes to sixty minutes at one hundred thirty degrees Celsius ensures total core penetration and eliminates the ring-dyeing defect.
This thirty-minute extension reduces daily dyehouse vessel output by twenty-five percent while consuming four kilograms of steam per kilogram of processed cloth. Mills frequently abbreviate the high-temperature dwell period to preserve machine throughput, discharging packages once the external bath exhausts, regardless of actual internal fiber penetration levels. The margin collapses.
The resulting fastness failures shift financial losses downstream. If goods fail ISO 105-C06 wash fastness or ISO 105-X12 crocking tests after cut-and-sew operations, the finished garment value represents five to eight times the greige material cost. Audit the batch record.
Brands without contractual cross-sectional penetration clauses absorb these write-offs because standard commercial lab dip approvals evaluate only total surface reflectance values measured on spectrophotometers.
ISO 105-C06 wash testing rejects lots showing ring-dyed cross sections because unfixed outer colorants bleed into adjacent white panels.
Specifying cross-sectional profiling protocols establishes actionable qualification metrics before bulk fabric processing begins.
| Penetration Rating | Radial Penetration Percentage | ISO 105-X12 Wet Crock Rating | Dyehouse Reject Probability | Processing Cost Adjustment |
|---|---|---|---|---|
| Grade A (Complete) | 90 to 100 percent core depth | Grade 4-5 | Under 0.5 percent | Base price plus 8 percent dwell surcharge |
| Grade B (Standard) | 70 to 89 percent core depth | Grade 3-4 | 2.0 to 4.0 percent | Standard contract rate |
| Grade C (Borderline) | 50 to 69 percent core depth | Grade 2-3 | 12.0 to 18.0 percent | Five percent penalty rebate applied |
| Grade D (Ring Dyed) | Under 50 percent core depth | Grade 1-2 | Exceeds 50 percent | Lot rejected without finishing allowance |
Standard master purchase agreements incorporate specific inspection provisions requiring cross-sectional micro-capillary verification on initial production strike-offs, compelling the supplier to assume full liability for color bleeding whenever internal penetration measures below seventy percent of the filament radius.