Delta E Formula Selection Principles for Woven Fabric Batch Consistency
CIEDE2000 with 2:1:1 parametric weighting aligns numerical batch tolerances with visual panel acceptance across woven fabrics better than legacy DE76 or CMC equations.


Geometry
Textile color-difference calculations convert spectrophotometric reflectance curves into three-dimensional spatial coordinates. Older color spaces like CIELAB 1976 rely on Euclidean distance, assuming that equal geometric steps anywhere in that space represent equal shifts in human visual perception. In practice, visual trials on dyed woven fabrics show that human eye sensitivity forms ellipsoids rather than spheres around target coordinates.
These tolerance ellipsoids stretch in saturated areas and contract in neutral grays. A basic Euclidean Delta E from the 1976 equation will return the same number for a shift in pale gray as it does for one in deep navy, even when human observers reject the navy out of hand while passing the gray without question.
Woven fabrics complicate evaluation because yarn geometry alters directional reflectance. Warp and weft arrangements form micro-textures that scatter light according to thread count, yarn twist, and float length. A plain weave poplin reflects light fairly uniformly, whereas a 3/1 twill or satin channels specular reflection along diagonal ridges.
As illumination angles shift, the ratio of specular to diffuse reflection changes across these structures. Older linear formulas interpret these structural reflections as genuine chromatic shifts, triggering false batch rejections on textured goods that look identical to the master sample.
CIELAB DE76 calculations overestimate visual shade differences in saturated woven goods by up to 300 percent compared to visual panel results under standardized light booth conditions.
Perceptual Non-Uniformity in CIELAB Space
The uniform grid of the 1976 CIE L a b model does not reflect how human eyes register chromatic shifts at different saturation levels. Early industrial colorimetry took uniformity across all axes for granted. Later testing showed that discrimination ellipses sit tightest around the neutral axis and stretch out as chroma climbs.
In saturated yellows and reds, inspectors accept noticeably larger distances in L a b space before flagging a mismatch. Near the neutral axis, however, tiny drift in red-green or yellow-blue coordinates prompts immediate rejection.
Fiber cross-sections and twist factors interact with surface texture to scatter light in complex ways. Continuous filament polyester produces sharp specular glints, whereas ring-spun staple cotton diffuses light across micro-fibrils. Evaluating batch variation with an unweighted vector distance leads to erratic pass-fail results across different substrates.
Reliable color control requires formulas that scale their tolerance boundaries according to where the target shade sits in the visual field.
Whether spectrophotometer firmware will eventually integrate multi-angle bidirectional reflectance distribution functions into online dyehouse monitoring without driving up hardware costs remains an open question.

Swatch
Spectrophotometer reflectance readings depend heavily on how a textile sample is mounted and backed. A woven swatch is optically anisotropic, showing distinct behavior along the warp and weft. Dropping a twill fabric into an instrument port without controlling its orientation shifts the reflectance curve and introduces artificial variation.
Reliable measurement requires rigid sample preparation to separate true dye-yield differences from optical grain effects.
Aperture Size and View Area Selection
Optical ports must cover enough weave repeats to average out the micro-shadows cast by yarn crossovers. A small area view aperture of 4 millimeters in diameter ends up reading individual warp floats or yarn slubs, creating wide spectral swings across different spots on the same dyed fabric. Large area view ports of 25 millimeters or 30 millimeters integrate reflectance across dozens of yarn intersections, smoothing structural noise into a stable, representative curve.
| Instrument Parameter | Standard Setting | Twill and Satin Modifications | Impact on Delta E Calibration |
|---|---|---|---|
| Aperture Diameter | 25 mm (Large Area View) | 30 mm or largest available port | Prevents localized yarn float noise from distorting hue readings |
| Specular Component | Specular Included (SPIN) | Specular Included (SPIN) | Eliminates surface glare differences caused by calender finishing |
| UV Component | UV Included (D65 calibrated) | UV Excluded for un-brightened shades | Stabilizes optical brightener excitation in white and pastel batches |
| Sample Layering | 4 layers (Opaque thickness) | 4 to 8 layers depending on basis weight | Eliminates background light transmission through porous weaves |
| Sample Rotation | Average of 4 readings at 90 degrees | Average of 4 readings at 90 degrees | Cancels directional weave texture reflectance anisotropy |
| Measurement settings defined per ISO 105-J01 testing conditions using d/8 degree sphere benchtop spectrophotometers. | |||

Specular Component Handling and Texture Suppression
Integrating spheres measure reflectance in either specular included or specular excluded mode, which fundamentally alters hue calculations on spun yarns. Specular Included mode captures total reflected light regardless of surface sheen, isolating the dyestuff’s actual absorption profile inside the fiber. Specular Excluded mode discards the gloss component, leaving the reading sensitive to finishes like resin coatings, calendering, or sanding.
When checking production lots for dye concentration, Specular Included mode delivers the truest reading of chemical shade differences against the standard.
Sample preparation procedures require systematic control over physical presentation to maintain reproducibility across laboratory locations:
- Aperture undersizing causes localized optical sampling errors by measuring individual yarn floats rather than the overall composite weave structure.
- Insufficient specimen opacity allows backing board optical characteristics to bleed through thin woven structures, contaminating spectral reflectance curves.
- Uncontrolled specimen rotation introduces directional optical variations from prominent twill lines or satin floats into calculated chromatic parameters.
- Inconsistent clamping pressure alters yarn packing density at the port face, modifying light scattering coefficients between sequential reads.
Aligning every specimen in the same warp-wise orientation across tests keeps batch reflectance data consistent throughout a production run.

Weighting
Adjusting formula weights compensates for how visual sensitivity differs across hue, lightness, and chroma. The CMC l:c equation from the Colour Measurement Committee of the Society of Dyers and Colourists introduced dedicated factors for lightness (l) and chroma (c), reshaping the tolerance ellipsoid’s semi-axes for specific industrial uses. A 2:1 lightness-to-chroma ratio (CMC 2:1) has long been standard for general batch release.
Giving lightness double the tolerance reflects human inspection reality: observers will accept moderate lightness variation in garment panels far more readily than shifts in chromatic saturation.

Why Do Dark Shade Batch Comparisons Fail under Euclidean Color Metrics?
Deep blacks and saturated navies heighten sensitivity to subtle shifts where the eye catches minute spectral imbalances. In dark shades, an unweighted Delta E formula produces a deceptively low reading even when a lot carries an obvious red or green cast. Visual inspection panels routinely reject dark fabric with a calculated DE76 of just 0.60 if that error lies along the hue angle.
Newer formulas scale the hue weighting inversely with chroma, tightening allowable hue deviation as saturation drops or depth builds.
- Mount the reference master swatch over a non-fluorescent white backing tile inside the spectrophotometer sample holder.
- Execute four spectral measurements, rotating the swatch 90 degrees between each scan to establish the target baseline reflectance vector.
- Select the desired parametric factor ratio based on end-use requirements, applying 2:1 for garment batch production or 1:1 for critical panel-to-panel seam matching.
- Measure the production batch sample using identical aperture, specular, and rotation configurations applied during reference swatching.
- Calculate the individual lightness, chroma, and hue delta components to determine whether the total tolerance ellipse boundary was breached.
Parametric Factor Tuning for Woven Structures
Balancing lightness and chroma ratios accounts for surface fuzz and yarn crimp in heavier twills or satins. Fine dress shirting woven from 80/2 two-ply combed cotton has a smooth face where buyers enforce narrow hue limits. Conversely, 14-ounce denim or heavy canvas twill undergoes mechanical washing and finishing that significantly alters surface reflectance.
Applying CMC 2:1 or a CIEDE2000 l:c:h setting of 2:1:1 widens the lightness tolerance, keeping mills from rejecting bulk rolls whose minor reflectance shifts stem from stenter frame tension rather than dye concentration.
Applying a 2:1 lightness to chroma ratio in CMC or CIEDE2000 equations aligns numerical batch pass rates with visual panel shade acceptance across woven cotton apparel runs.
For automotive interior trim, where adjacent panels meet directly at eye level, manufacturers set parametric ratios to 1:1 to keep tight control over lightness differences. For general outerwear, a 2:1 lightness setting avoids unnecessary mill rejections while maintaining visual harmony on retail racks.
Mismatched parametric settings can lead a dyehouse to release off-shade fabric that ultimately triggers full shipment rejections and chargebacks at the garment factory.

Computation
Comparing spectral batch data across formulas highlights how different equations reach opposing pass-fail decisions from the same spectrophotometer scan. Current color software calculates differences using positional weighting functions for lightness, chroma, and hue. CIEDE2000 remains the most sophisticated model, using an explicit rotation term (R_T) to resolve historic calculation errors in the blue region alongside dedicated corrections for neutral grays and low-chroma shades.

Spectral Reflectance Shift Scenarios
Consider two production lots of woven cotton poplin measured against a standard lab dip on a benchtop spectrophotometer. Lot A shows a pure lightness shift, having finished pale because of low dye liquor pick-up on the padder. Lot B shows a hue shift in the blue-violet range caused by a slight formulation error.
Testing both lots against identical numerical limits under different formulas shows why formula choice determines commercial acceptance.
| Batch Deviation Profile | CIELAB DE76 | CMC (2:1) | CIE94 (2:1:1) | CIEDE2000 (1:1:1) | CIEDE2000 (2:1:1) |
|---|---|---|---|---|---|
| Lot A (Pure Lightness Shift, High Chroma Red) | 1.45 | 0.72 | 0.74 | 1.21 | 0.68 |
| Lot B (Hue Shift, Saturated Navy Blue) | 0.88 | 1.15 | 1.08 | 1.34 | 1.28 |
| Lot C (Chroma Shift, Neutral Medium Gray) | 0.65 | 0.82 | 0.78 | 0.94 | 0.89 |

Equation Comparative Analysis
Running identical spectral curves through different equations reveals why older formulas cause unneeded re-dyes. On Lot A, the unweighted CIELAB 1976 equation yields a Delta E of 1.45 purely from lightness drift. Under a typical commercial cutoff of DE = 1.00, Lot A fails DE76.
Evaluated with CIEDE2000 (2:1:1), the value drops to 0.68; the formula accounts for human tolerance of lightness drift in vivid reds, releasing the lot without further dyehouse shading.
Lot B presents the reverse problem: a hue shift in saturated navy. The unweighted DE76 formula returns a passing value of 0.88 against a DE = 1.00 limit. Because human vision picks up navy hue shifts so readily, CIEDE2000 (1:1:1) flags the lot at 1.34, and CIEDE2000 (2:1:1) rates it 1.28.
Both CIEDE2000 variants reject Lot B, stopping the factory from cutting fabric that would show obvious shading between garment panels on the sales floor.
On a 20,000-metre run of dyed polyester-cotton twill with a pass threshold of 1.00, an unweighted DE76 specification often produces a 15 percent re-dye rate on lightness-shifted lots that visual inspectors would accept. At a re-dye cost of 0.35 USD per metre in energy, dye, and effluent treatment, relying on DE76 adds 1,050 USD in unnecessary reprocessing for every 10,000 metres. Switching contracts to CIEDE2000 (2:1:1) removes those false rejections without relaxing protection against off-hue lots.
In high-chroma woven textiles, CIEDE2000 (2:1:1) suppresses false lightness rejections while tightening hue boundary controls compared to older CIELAB equations.
A technical submission dossier for batch color clearance includes specific analytical data elements:
- Target reflectance vector containing absolute spectral data at 10-nanometer intervals across the visible spectrum from 400 to 700 nanometers.
- Equation specification parameters declaring the precise formula, illuminant, observer, and parametric factors used for calculation.
- Component breakdown values listing individual delta L , delta C , and delta H scalar figures alongside total calculated Delta E.
- Metamerism index ratings comparing shade shifts between primary D65 daylight and secondary F02 or TL84 retail lighting conditions.
Production disputes often frame batch deviations as raw dyestuff strength variation, though the choice of color difference equation frequently decides whether those lots pass or fail.


Threshold
Clear numerical tolerance bands in procurement contracts eliminate subjective shade disputes between mills and brand buyers. No single threshold fits every construction and end use. A tight CIEDE2000 (2:1:1) limit below 0.60 is realistic for continuous ranges running uniform 100 percent cotton poplin, but impossible for batch-dyed textured nylon outerwear that shrinks unevenly during stenter drying.

End-Use Categorization and Tolerance Assignment
Commercial limits depend directly on how the garment is cut and worn. High-end tailored suitings, where pieces from different rolls meet at jacket seams, require panel-to-panel variation below CIEDE2000 (2:1:1) 0.50. For casual cotton trousers finished with garment washing, batch-to-batch tolerances can safely expand to 1.20 without triggering retail returns.
| Fabric Category | Typical Weave Structure | Target End Use | Recommended Formula | Max Allowable Delta E |
|---|---|---|---|---|
| Tailored Suitings | 2/2 Twill (Fine Wool/Poly) | Jackets and trousers | CIEDE2000 (1:1:1) | 0.50 |
| Dress Shirtings | Plain Weave (Combed Cotton) | Formal shirts | CIEDE2000 (2:1:1) | 0.75 |
| Workwear Canvas | 3/1 Heavy Cotton Twill | Industrial uniforms | CMC (2:1) | 1.00 |
| Casual Outerwear | Ripstop Nylon / Polyester | Jackets and windbreakers | CIEDE2000 (2:1:1) | 1.25 |
| Garment Dye Greige | Plain Weave Cotton Slub | After-wash apparel | CIELAB DE76 | 1.50 |
Shade Banding and Roll Sorting Methods
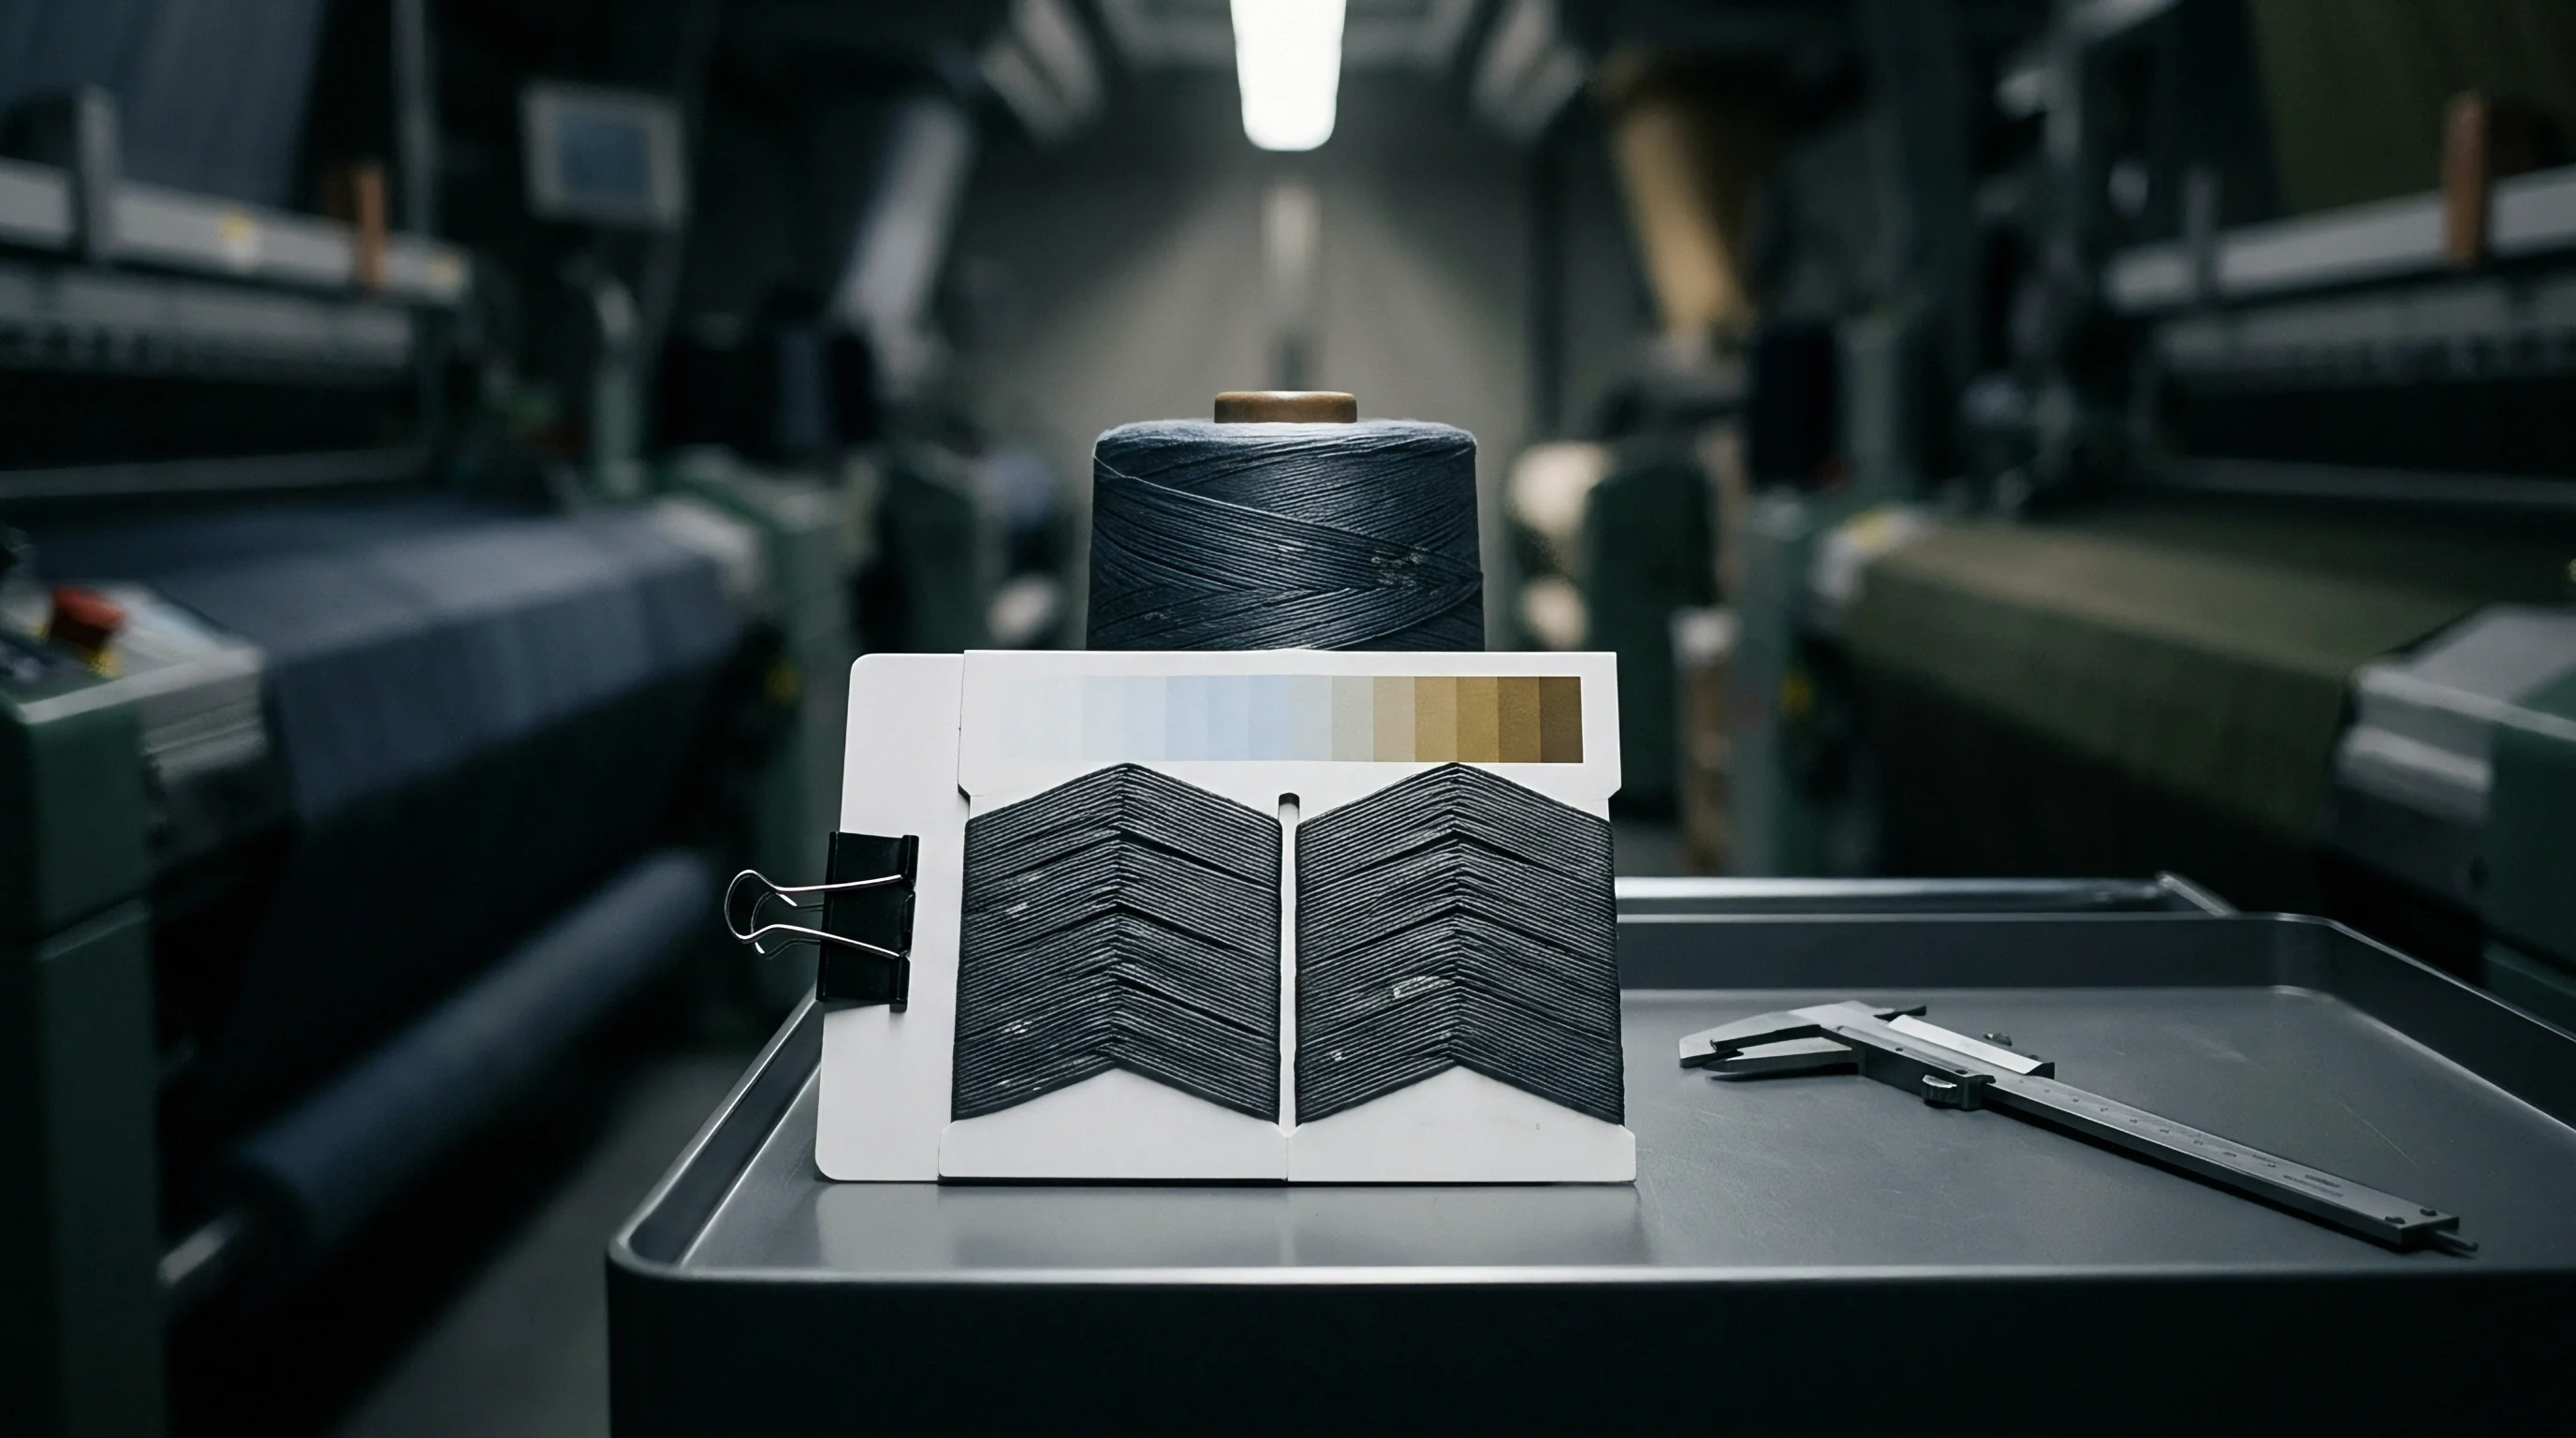
Sorting finished rolls into delivery groups prevents panel mismatching when cutting markers in the garment factory. When a production lot shows wide shade variation around the target lab dip, mills measure every roll and sort them into discrete bands (such as Band A, Band B, and Band C). Rolls within a single band stay within a tight CIEDE2000 tolerance of less than 0.40, even if the entire lot spans 1.20 overall.
Cutting rooms then lay up markers using fabric drawn strictly from one band at a time.
While lab dips set the baseline under simulated D65 daylight, uncorrected specular reflection can distort instrument data, making systematic roll grouping necessary to prevent panel shading in assembly.
Contractual shade limits must specify both total Delta E values and individual delta hue thresholds to block visual mismatching in saturated colorways.
In cross-border procurement, mills frequently propose CMC 2:1 tolerances while brand buyers inspect against CIEDE2000 (2:1:1). In high-chroma blue-greens, a batch that passes CMC 2:1 at 0.90 can fail CIEDE2000 at 1.05 because of the equation’s rotational ellipse correction. To prevent dispute, buyers protecting retail margins establish CIEDE2000 as the sole binding referee formula in the master purchasing agreement.
Citing ISO 105-J03 clause 4.2 in the master purchase order binds both mill and buyer to CIEDE2000 under D65 illumination with specular reflectance included.