Establishing Dual Route Spectrophotometric Tolerances in Textile Printing
Dual-route spectrophotometric tolerances align inline continuous scanning with conditioned bench readings by establishing dynamic wavelength offset matrices.


Scale
Bench spectrophotometers and inline continuous spectral arrays measure print coloration under fundamentally different physical states. Integrating benchtop laboratory analysis with high-speed press management requires establishing mathematical offset matrices that map transient off-press optical signals to conditioned, fully relaxed fabric benchmarks. Without dual-route calibration, print mills encounter systematic color shifts between press delivery frames and incoming buyer light boxes.
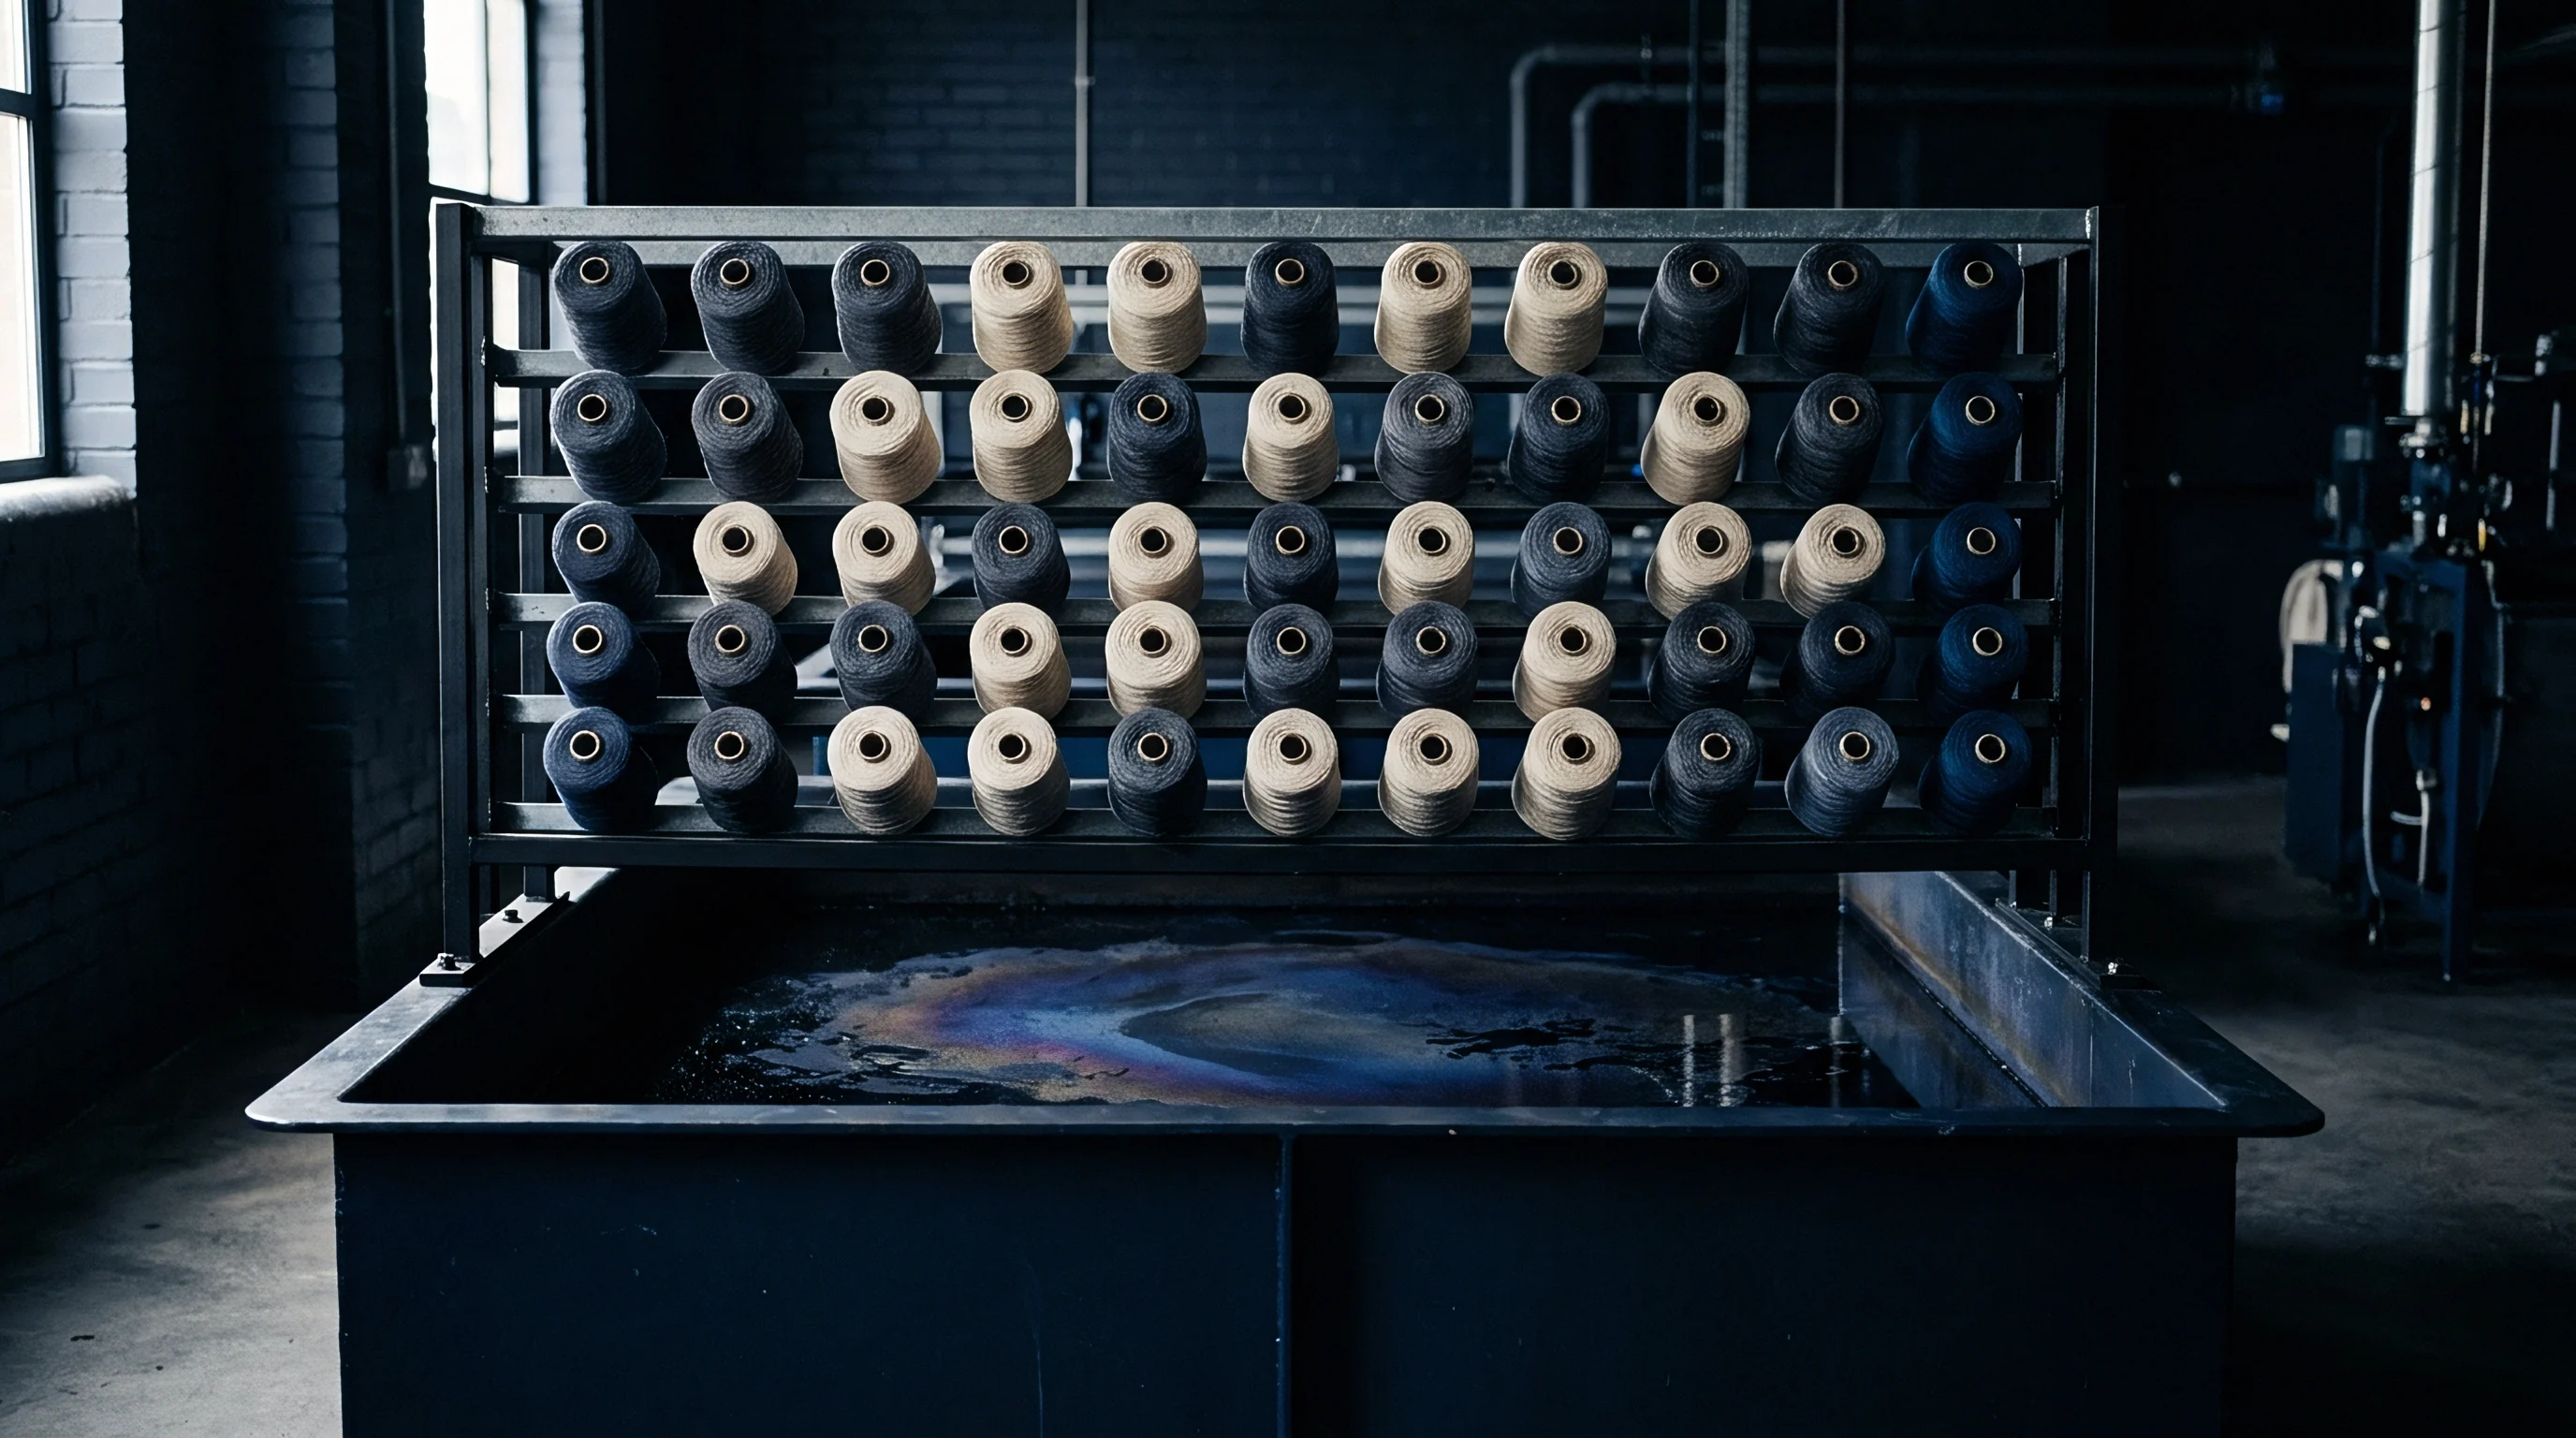
Spectrophotometric Routing in Textile Wet Processing
Benchtop testing relies on conditioned swatches cut from finished rolls, whereas inline optical heads scan unconditioned moving fabric webs directly behind the print head or stenter exit. Off-line bench measurement according to ISO 105-J01 standardizes moisture, temperature, and specular reflectance conditions. The laboratory instrument captures light reflected from a static swatch that has achieved moisture equilibrium within a regulated room.
Inline instruments scan fabric moving at speeds up to eighty metres per minute while the substrate retains residual thermal energy and transient moisture levels from drying or steaming.
Moisture distorts target shade readings. Water molecules inside cellulose or synthetic fibers alter the refractive index of the substrate, causing unconditioned wet print pastes to absorb more light across visible wavelengths. Wet print pastes reflect light unevenly.
Consequently, real-time spectral monitoring of hot, partially unconditioned print webs yields lower L-star values and exaggerated chroma readings compared to fully relaxed swatches evaluated twenty-four hours later.
| Measurement Parameter | Off-Line Bench Instrument | Inline Continuous Array | Physical Discrepancy Driver |
|---|---|---|---|
| Optical Geometry | d/8° sphere or 45°/0° directional | 45°/0° multi-angle LED array | Specular component integration differences |
| Specimen State | Relaxed, conditioned (20°C, 65% RH) | Transient thermal state (45°C–70°C), unconditioned | Thermochromism and moisture-induced refractive shifts |
| Aperture Size | 20 mm to 30 mm circular aperture | 10 mm to 15 mm continuous line-scan spot | Yarn structural averaging vs high-frequency noise |
| Illuminant Source | Pulsed Xenon with calibrated UV | Solid-state calibrated white LED array | Ultraviolet excitation of fluorescent whitening agents |
| Data reflects typical operational conditions for continuous rotary screen and digital inkjet print lines operating under ISO 105-J01 testing protocols. | |||
Establishing dual-route tolerances demands a systematic procedure that converts real-time press readings into predictive benchmarks that match final laboratory approvals.
- Condition bench sample swatches under ISO 139 atmospheric standards for twenty-four hours to record reference reflectance data between 360 and 700 nanometres.
- Measure unconditioned moving print webs at the stenter frame exit using synchronized optical scanning heads under calibrated LED illumination.
- Calculate wavelength-by-wavelength delta values between conditioned bench reflectance data and real-time press outputs across fifty linear metres.
- Program offset mathematical coefficients directly into press management software to adjust real-time pass threshold boundaries during continuous production runs.
Wet print pastes register artificially dark L-star values prior to stenter drying and steaming cycles.
CIEDE2000 Formula Application across Production Phases
Mathematical color difference equations calculate total color variance by weighting lightness, chroma, and hue differences according to human visual perception threshold ellipses. The CIEDE2000 total color difference formula (ISO 105-J03) resolves non-uniformities in the older CIELAB space, particularly along neutral axes and within high-chroma blue regions. Industrial practice sets default parametric factors kL, kC, and kH to 1:1:1 for smooth planar prints.
For heavily textured knitted substrates or rotary screen prints on coarse slub cotton, setting the lightness parametric factor kL to 2.0 prevents minor surface shadow variations from over-triggering rejection limits.
Setting tolerances for dual-route monitoring requires split delta thresholds. While an off-line bench inspection enforces a strict CIEDE2000 limit of 0.8 units against the master lab dip, the inline continuous system operates under an expanded transient threshold of 1.3 units. This dynamic allowance accommodates real-time web flutter, transient thermochromism, and moisture evaporation without forcing false press stoppages.
Inserting ISO 105-J03 Annex A clauses into print procurement master contracts shifts the legal point of shade verification from raw off-press web output to fully conditioned, twenty-four-hour relaxed finished goods.
Geometry
Optical alignment choices in measurement instruments govern how specular surface reflection interacts with underlying colorant absorption. Selecting between diffuse sphere structures and directional angled geometry determines whether physical surface texture or chemical dye concentration dominates the measured spectral curve. Textile print evaluation requires aligning optical geometry selection directly with the mechanical surface treatment of the substrate.
Specular Component Selection on Textured Substrates
Sphere instruments capture light integrated across an integrating cavity, offering choices between specular component included and specular component excluded modes. The specular component included mode measures total spectral reflectance, capturing both internal pigment absorption and specular surface glare. This mode isolates true chemical colorant concentration from mechanical surface variations.
The specular component excluded mode uses a specular light trap to remove direct surface glare, yielding color values that closely mirror human visual assessment of surface gloss changes.
Excluding specular reflectance during bench measurements prevents surface calendar gloss from distorting true pigment absorption values on finished cotton weaves.
Calender pressure alters pile density. Surface fuzz shifts chromatic values. When printed cotton poplin undergoes friction calendering, the flattened surface increases specular gloss.
A specular-excluded reading registers an artificial shift toward higher chroma and lower lightness, even though dye mass per unit area remains identical. Employing specular component included geometry on bench instruments verifies dye yield stability across uncalendered and calendered print sections, eliminating surface gloss noise from color strength calculations.
- Uncalibrated UV Illumination Filters skew spectral readings on bleached cotton print bases by shifting b-star values toward blue.
- Variable Substrate Moisture Levels cause erratic L-star shifts during inline scanning on high-speed stenter frames.
- Specular Surface Glare Variations from calender rolls generate false color difference spikes on heavy twill print lines.
- Inconsistent Sensor Standoff Distances introduce optical scatter errors when monitoring moving knitted print webs.
Optical Brightener Drift under Variable Illuminants
Fluorescent whitening agents added during substrate bleaching absorb ultraviolet energy and re-emit visible blue wavelengths, skewing spectrophotometric data when light sources lack calibrated ultraviolet control. Printed fabric bases containing optical brighteners exhibit significant spectral fluctuations in the 400 to 440 nanometre range under illuminant D65 when the ultraviolet component decays. Spectrophotometers equipped with adjustable UV filters according to ISO 105-J02 allow technicians to calibrate ultraviolet emission against standardized plastic reference tiles.
Calibrating UV content prevents optical brightener excitation from masking subtle yellowing or shade drift in light-toned pastel prints.
Print mills frequently explain shade discrepancies between off-press scanning and buyers’ light boxes by claiming that heat dissipation during stenter drying alters transient dye molecular configurations.


Variance
Statistical distribution of color difference measurements across continuous print lots reveals significant differences between single illuminant benchmarks and multi-illuminant pass criteria. A dye formulation that matches an approved shade standard under daylight conditions can split dramatically when viewed under commercial retail lighting. Managing dual-route quality systems mandates calculating spectral variance across primary, secondary, and tertiary illuminants simultaneously.
Quantitative Metamerism Evaluation in Reactive Print Batches
Color pairs matching under daylight frequently split into distinct hues when exposed to point-of-sale retail lighting or incandescent home illuminants. Consider a worked example involving a continuous rotary screen print run of 20,000 metres of 100% combed cotton poplin (120 gsm) printed with reactive dyes. The buyer contract specifies a target shade tolerance of CIEDE2000 DE2000 0.80 or lower under primary illuminant D65 (6500K daylight), alongside secondary metamerism index limits under illuminant F11 (4000K commercial fluorescent) and illuminant A (2856K incandescent tungsten).
Metamerism breaks single lighting approvals. Unbound dye shifts reflection angles. During initial dye dispensing, a green shade formulation utilizes reactive turquoise and reactive yellow components.
Bench measurements taken from the approved laboratory dip and the initial bulk production roll produce the colorimetric data set tabulated below.
| Illuminant | Target L a b | Batch L a b | dL | dC | dH | DE2000 | Metamerism Index | Status |
|---|---|---|---|---|---|---|---|---|
| D65 (Daylight) | 52.10, -18.40, 14.20 | 52.35, -18.15, 14.60 | +0.25 | +0.32 | +0.12 | 0.38 | Base Ref | Pass |
| F11 (Fluorescent) | 51.80, -15.20, 12.80 | 52.45, -13.80, 14.10 | +0.65 | +1.18 | +0.45 | 1.14 | 0.76 | Fail |
| A (Tungsten) | 53.40, -12.10, 16.50 | 53.80, -11.50, 17.20 | +0.40 | +0.62 | +0.22 | 0.62 | 0.24 | Pass |
Analysis of the spectral data reveals that while the batch easily passes inspection under primary illuminant D65 with a DE2000 of 0.38, it fails under store lighting illuminant F11 with a DE2000 of 1.14 and a metamerism index of 0.76. The spectral reflectance curves diverge near 500 nanometres due to narrow absorption bands in the selected yellow reactive dye molecule. Correcting the formulation requires substituting a broader-spectrum yellow dye component to flatten the metameric index across secondary retail light sources.
A CIEDE2000 total color difference exceeding 0.8 units under illuminant D65 causes observable shade banding across continuous rotary screen print runs on combed cotton lawn.
Why Do Inline Sensors Overshoot Bench Colorimeters?
Continuous optical heads reading moving fabric webs operate at elevated temperatures with ambient light interference and mechanical flutter that alter baseline reflectance outputs. High speed movement creates optical jitter. Continuous scanning heads positioned above a running print line encounter web vibration that alters the optical distance between sensor optics and the fabric surface.
A distance variation of two millimetres scatters reflected light energy, causing artificial L-star elevation and false chroma attenuation.
Steam conditioning restores moisture balance. Reactive dyes exhibit post-cure darkening. Furthermore, high-temperature fixation stenters release printed fabrics at temperatures between 50°C and 80°C. Many disperse, acid, and reactive dye classes exhibit transient thermochromism, shifting shade significantly when hot and returning to their baseline state only after cooling to ambient room temperature.
An inline sensor measuring a hot web records elevated a-star and b-star values, generating an apparent color variance that dissipates naturally once the fabric conditions inside a holding warehouse over twenty-four hours. Failing to account for thermochromic recovery windows leads buyers to reject full production shipments that would otherwise drop within spec after forty-eight hours of ambient relaxation.
Audit
Physical verification of color measurement equipment demands rigorous routines governing physical calibration standards, clean testing environments, and optical sensor drift tracking. Integrating inline press sensors with laboratory spectrophotometers requires synchronizing calibration cycles across both measurement pathways. Neglecting routine calibration verification compromises color data integrity across the entire converter network.

Standardization of Atmospheric and Tile Calibration Procedures
Ceramic calibration standards require weekly cleaning protocols and periodic factory re-certification to maintain absolute reflectance accuracy across visible spectrum wavelengths. Laboratory technicians must clean working white and black calibration tiles using optical-grade isopropyl alcohol and lint-free microfiber wipes. Calibration tiles degrade over time.
White tiles absorb ambient grime. Microscopic dust grease or pigment residue on a calibration tile alters baseline spectral reflectance figures, skewing instrument calibration across all subsequent shade measurements. Spectrophotometer geometry defines light collection.
Unconditioned cloth shifts measured shade.
| Calibration Target | Standard Reference | Tolerated Drift | Verification Frequency | Action on Exceedance |
|---|---|---|---|---|
| Bench White Tile | NIST traceable ceramic master | < 0.05 DE2000 units | Every 8 hours / shift start | Clean tile; rerun zero calibration |
| Inline Optical Array | Internal automated green tile | < 0.15 DE2000 units | Every 2 hours continuous | Execute automated shutter recalibration |
| Wavelength Accuracy | Holmium oxide filter bands | < 0.2 nm spectral shift | Monthly laboratory audit | Recalibrate monochromator assembly |
| Conditioning Ambient | ISO 139 atmosphere chamber | ± 1.0°C, ± 2.0% RH | Continuous digital logging | Hold shade approvals until room stabilizes |
Executing systematic equipment audits across production shifts maintains consistency between press floor monitoring systems and off-line testing facilities.
- White Tile Absolute Reflectance Verification ensures working ceramic tiles remain within 0.05 DE2000 units of factory master standards.
- Atmospheric Chamber Log Inspection confirms that specimen conditioning rooms hold relative humidity within plus or minus two percent.
- Sensor Standoff Distance Calibration verifies that inline laser positioning maintains constant optical geometry above the moving print web.
- Illuminant Energy Output Profiling tracks LED or xenon lamp aging before spectral decay compromises short-wavelength accuracy.
Adherence to ISO 105-J03 dictates that spectral shade measurements occur only after fabric specimens reach moisture equilibrium inside a standard atmosphere of 20 degrees Celsius and 65 percent relative humidity.
Inline Optical Array Maintenance Schedules
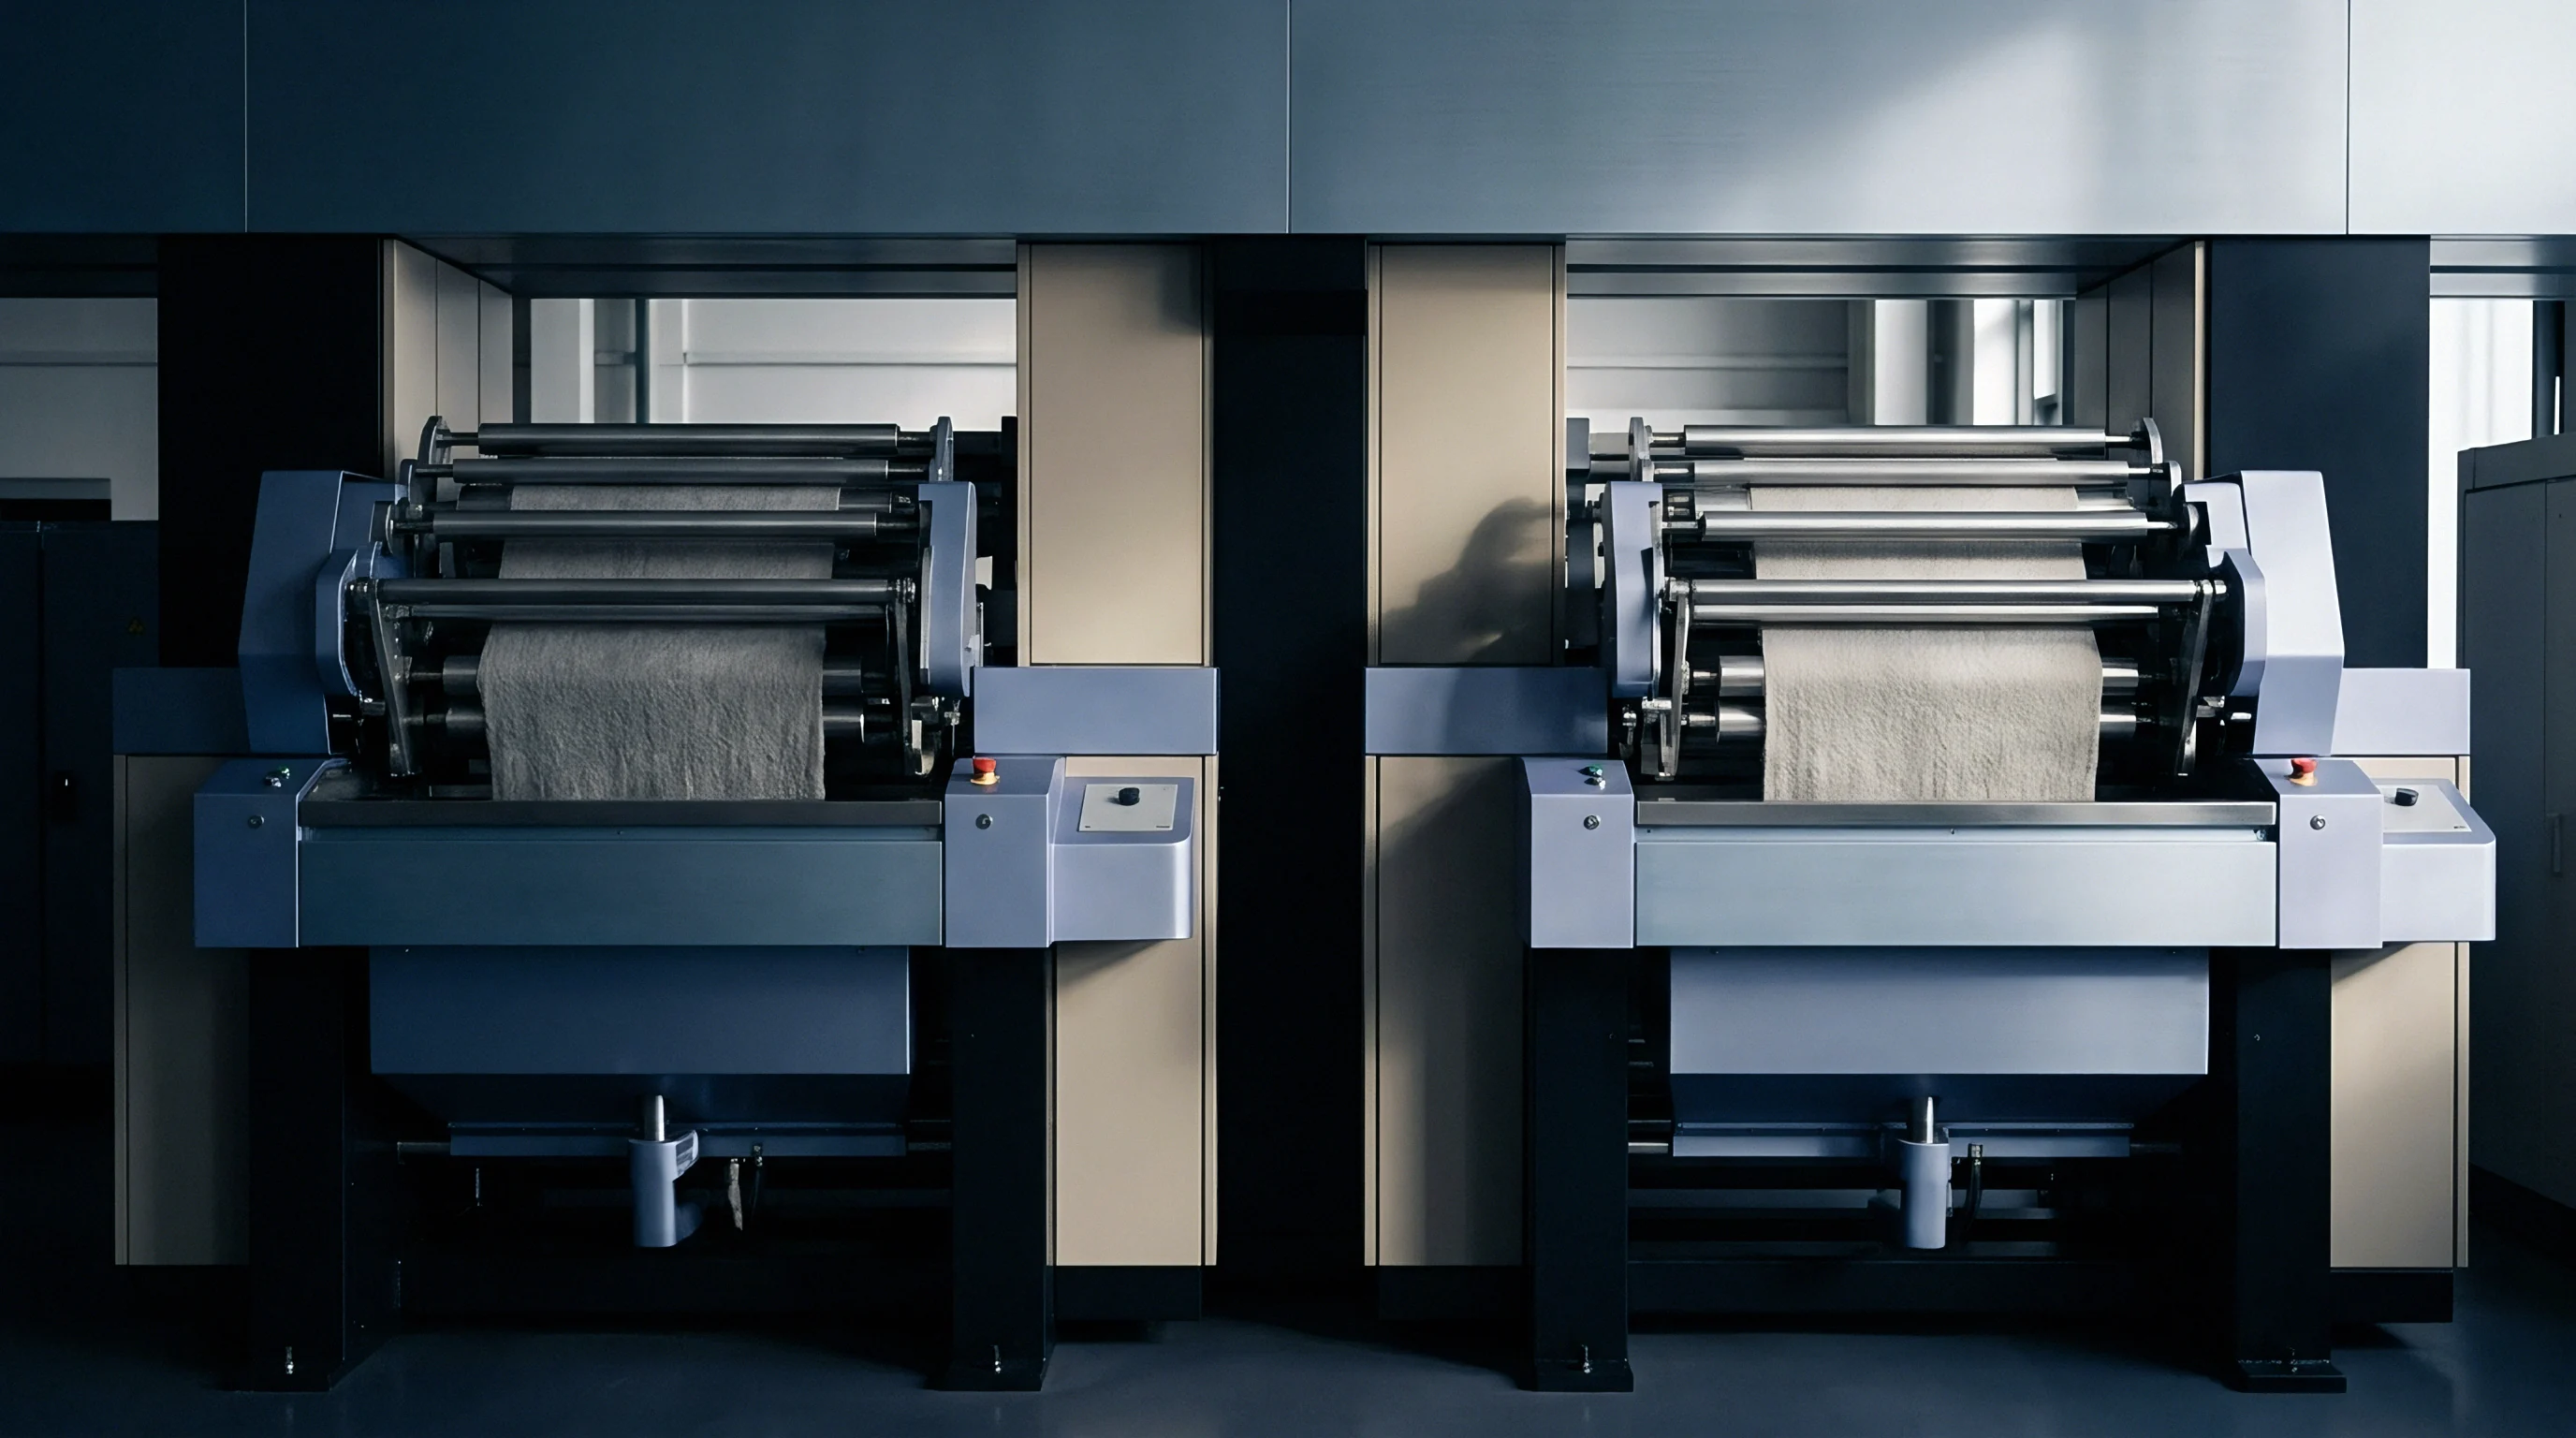
Dust accumulation on optical lenses and stenter lint build-up systematically attenuate light reflection signals, causing artificial drift in calculated shade coordinates. Air knives mounted forward of inline scanning lenses divert volatile dye fumes, lint particles, and moisture vapor away from optical sightlines. Maintenance routines dictate clearing optical glass housings with pressurized dry nitrogen every four hours during continuous printing runs.
Automated shutter mechanisms drop protective ceramic calibration tiles across sensor apertures at regular intervals to perform zero-drift re-baselining without interrupting fabric motion. Checking calibration tile cleanliness before running morning shade approvals prevents false dyehouse re-recipe calls.
Dispute
Commercial conflict between print converters and apparel buyers usually arises when laboratory measurements taken post-shipment diverge from inline approvals generated on the printing floor. Establishing dual-route spectrophotometric tolerances in supply agreements provides explicit rules for resolving technical discrepancies before goods arrive at cutting facilities. Clear legal definitions governing sample preparation and referee instruments prevent costly shipment rejections and chargeback proceedings.
Commercial Resolution Frameworks for out of Spec Goods
Legal contracts covering custom printed fabric orders specify arbitration rules that designate which instrument geometry, illuminant set, and conditioning duration govern final product acceptance. Purchase contracts define the referee laboratory instrument as a d/8° sphere spectrophotometer operating under specular component included geometry with illuminant D65 and 10° observer angles. The agreement establishes that inline pressing optical data functions solely as a process control tool, while off-line laboratory measurements taken after twenty-four hours of ISO 139 atmospheric conditioning serve as the legally binding authority for lot acceptance.
When a buyer rejects a print batch based on off-line spectral measurement, the dispute clause mandates executing three joint verification steps: re-measuring master archival swatches on the buyer’s calibrated instrument, checking conditioning chamber environmental logs, and testing physical specimens at an ISO 17025 accredited independent textile testing facility. Heat drives transient shade shift. Specifying precise tolerance boundaries alongside multi-illuminant pass limits eliminates subjective light box arguments, binding both mill and buyer to verifiable spectral metrics.
Whether inline continuous spectral arrays will eventually replace benchtop spectrophotometry as the sole legal referee instrument in international textile print contracts remains undecided as sensor speed and thermochromic compensation software continue to evolve.