Harmonizing Inline Continuous Spectral Camera Measurements with Laboratory Benchtop Spectrophotometer Standards in Global Textile Supply Chains
Harmonize inline cameras with benchtop spectrophotometers by pairing dynamic thermal-moisture compensation with matrix transforms aligned to ISO 105-J03.

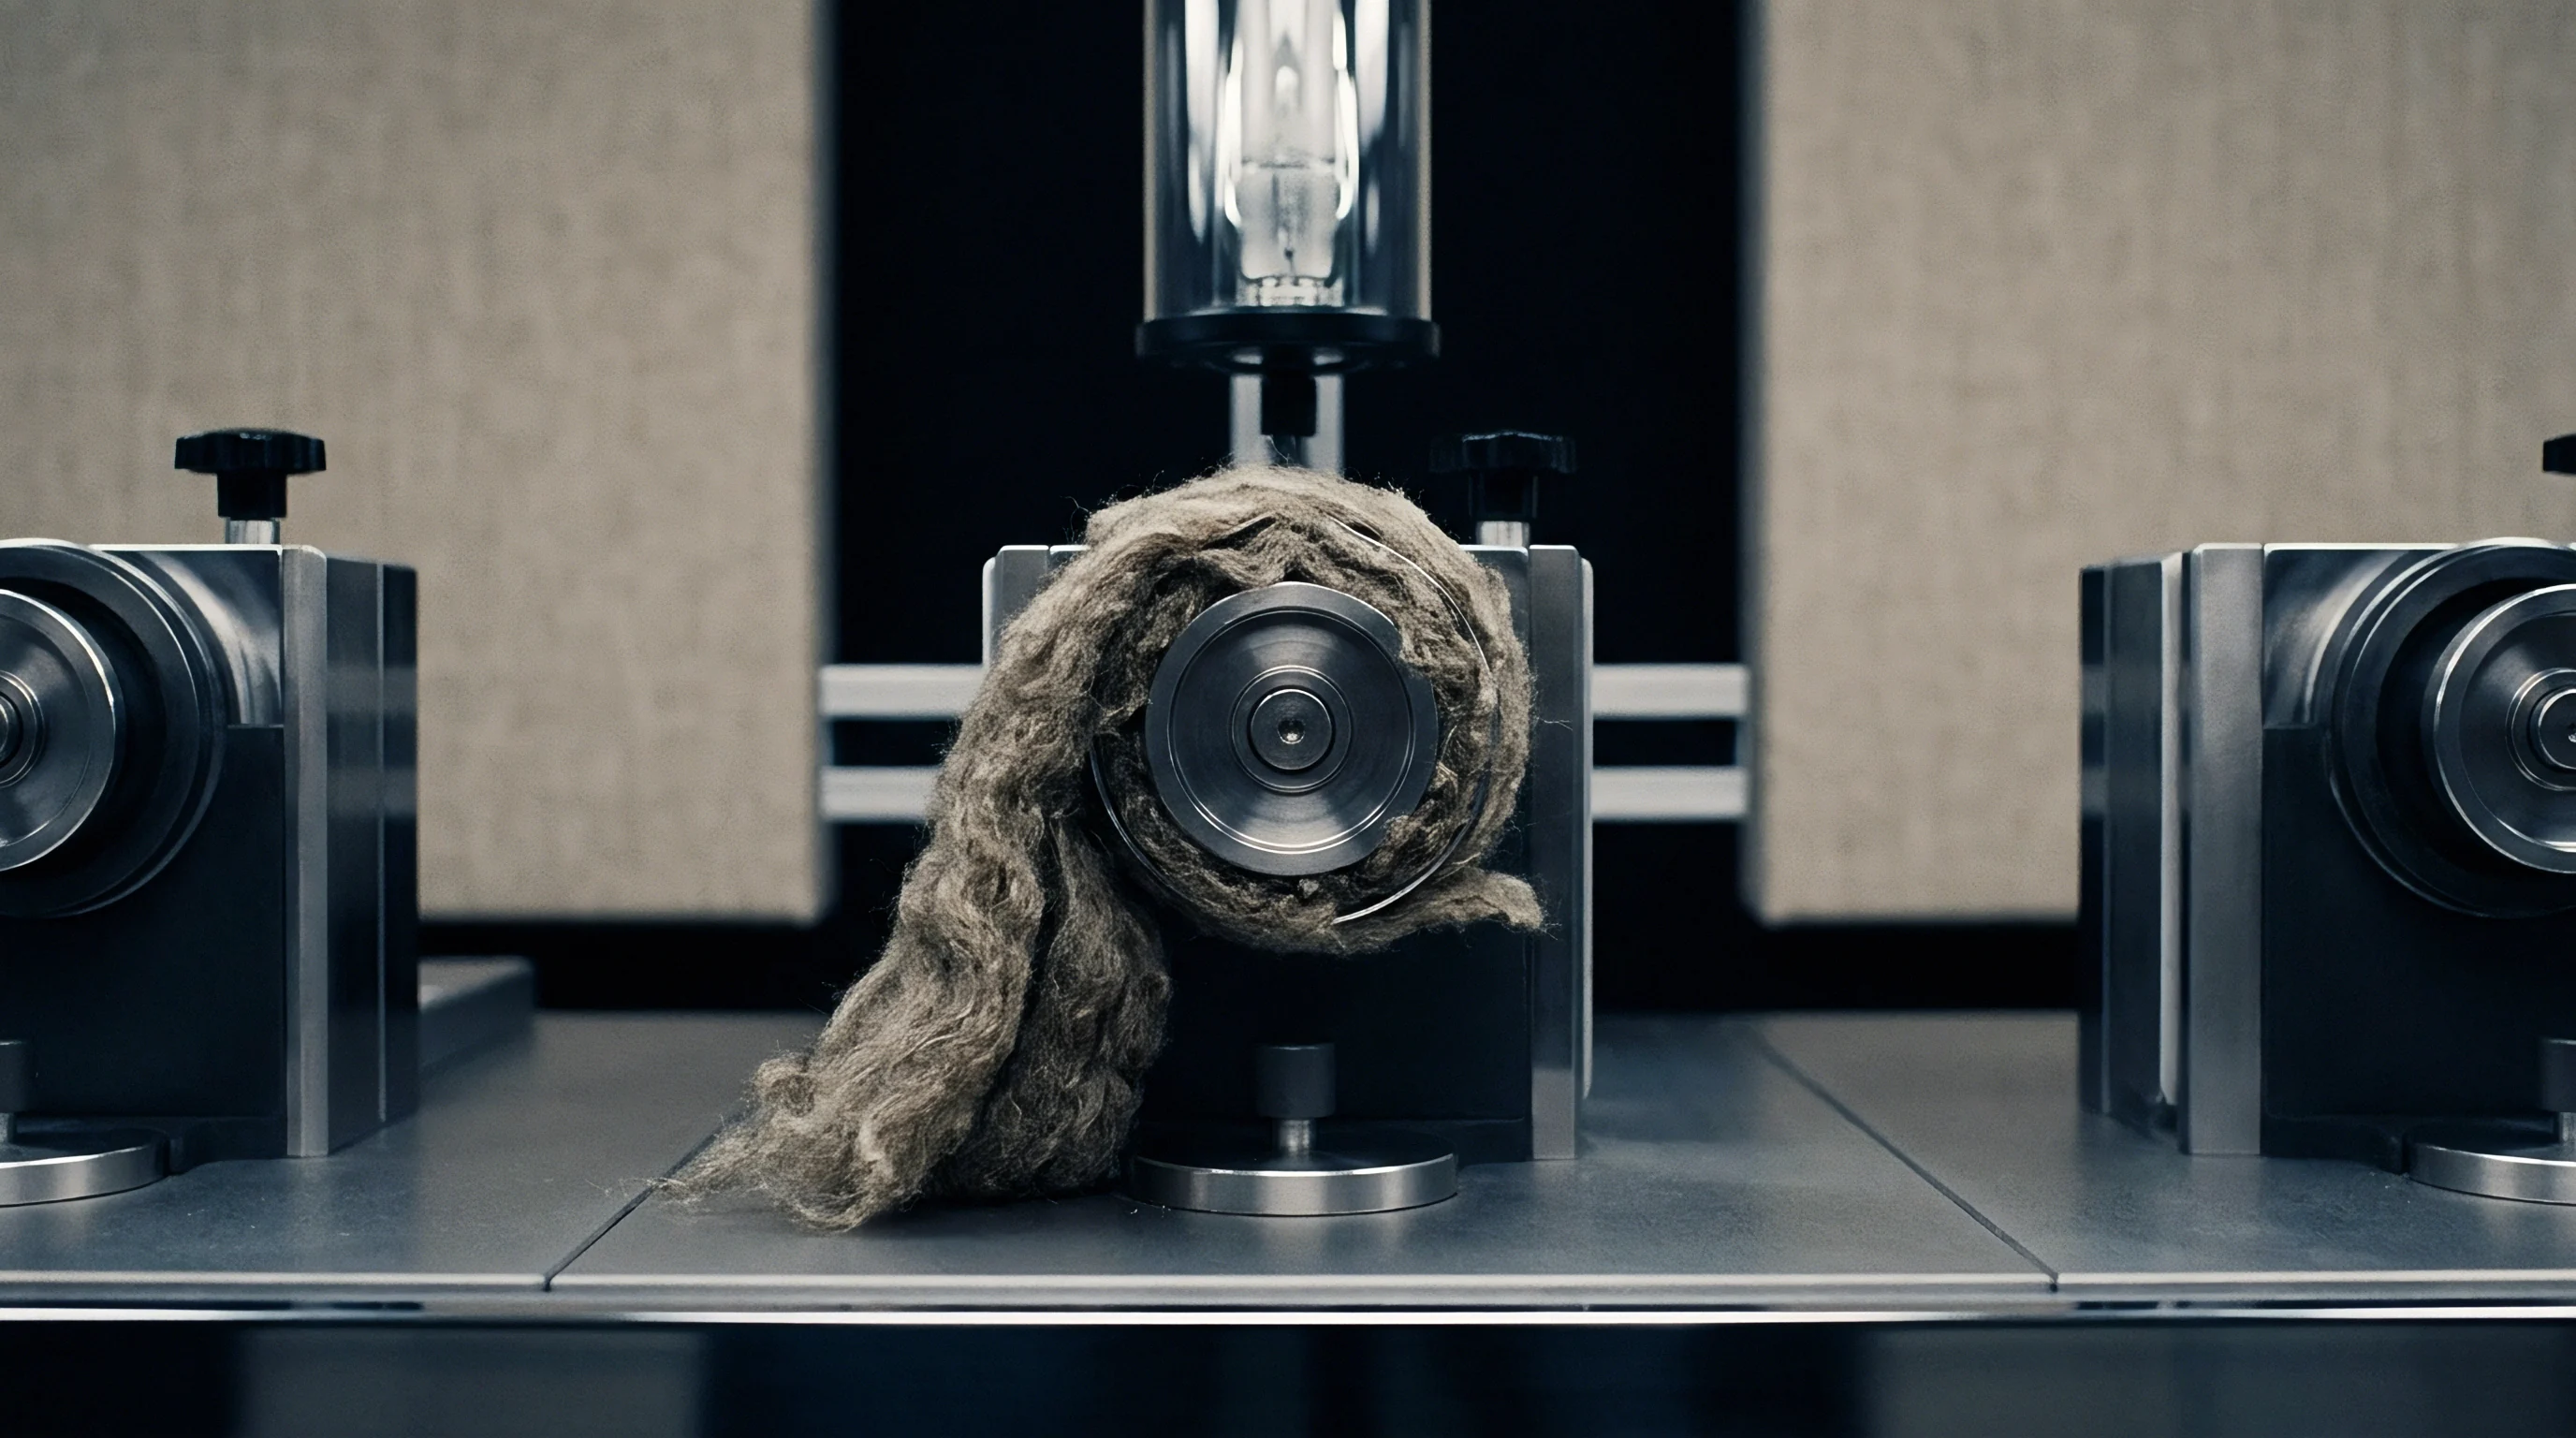
Gantry
Continuous line-scan spectral cameras mounted above moving inspection frames or stenter exits sample fabric at line speeds exceeding sixty metres per minute. The hardware captures reflected radiance across hundreds of narrow wavebands for every spatial pixel across the full bolt width. Benchtop spectrophotometers in accredited quality control laboratories take static point measurements through a fixed aperture using dual-beam integrating spheres with diffuse eight-degree geometry.
These two measurement worlds frequently produce conflicting colour difference values on identical dye lots. Converting raw spatial radiance data into benchtop reflectance factors demands strict mechanical stability, calibrated line illumination, and defined integration geometry.
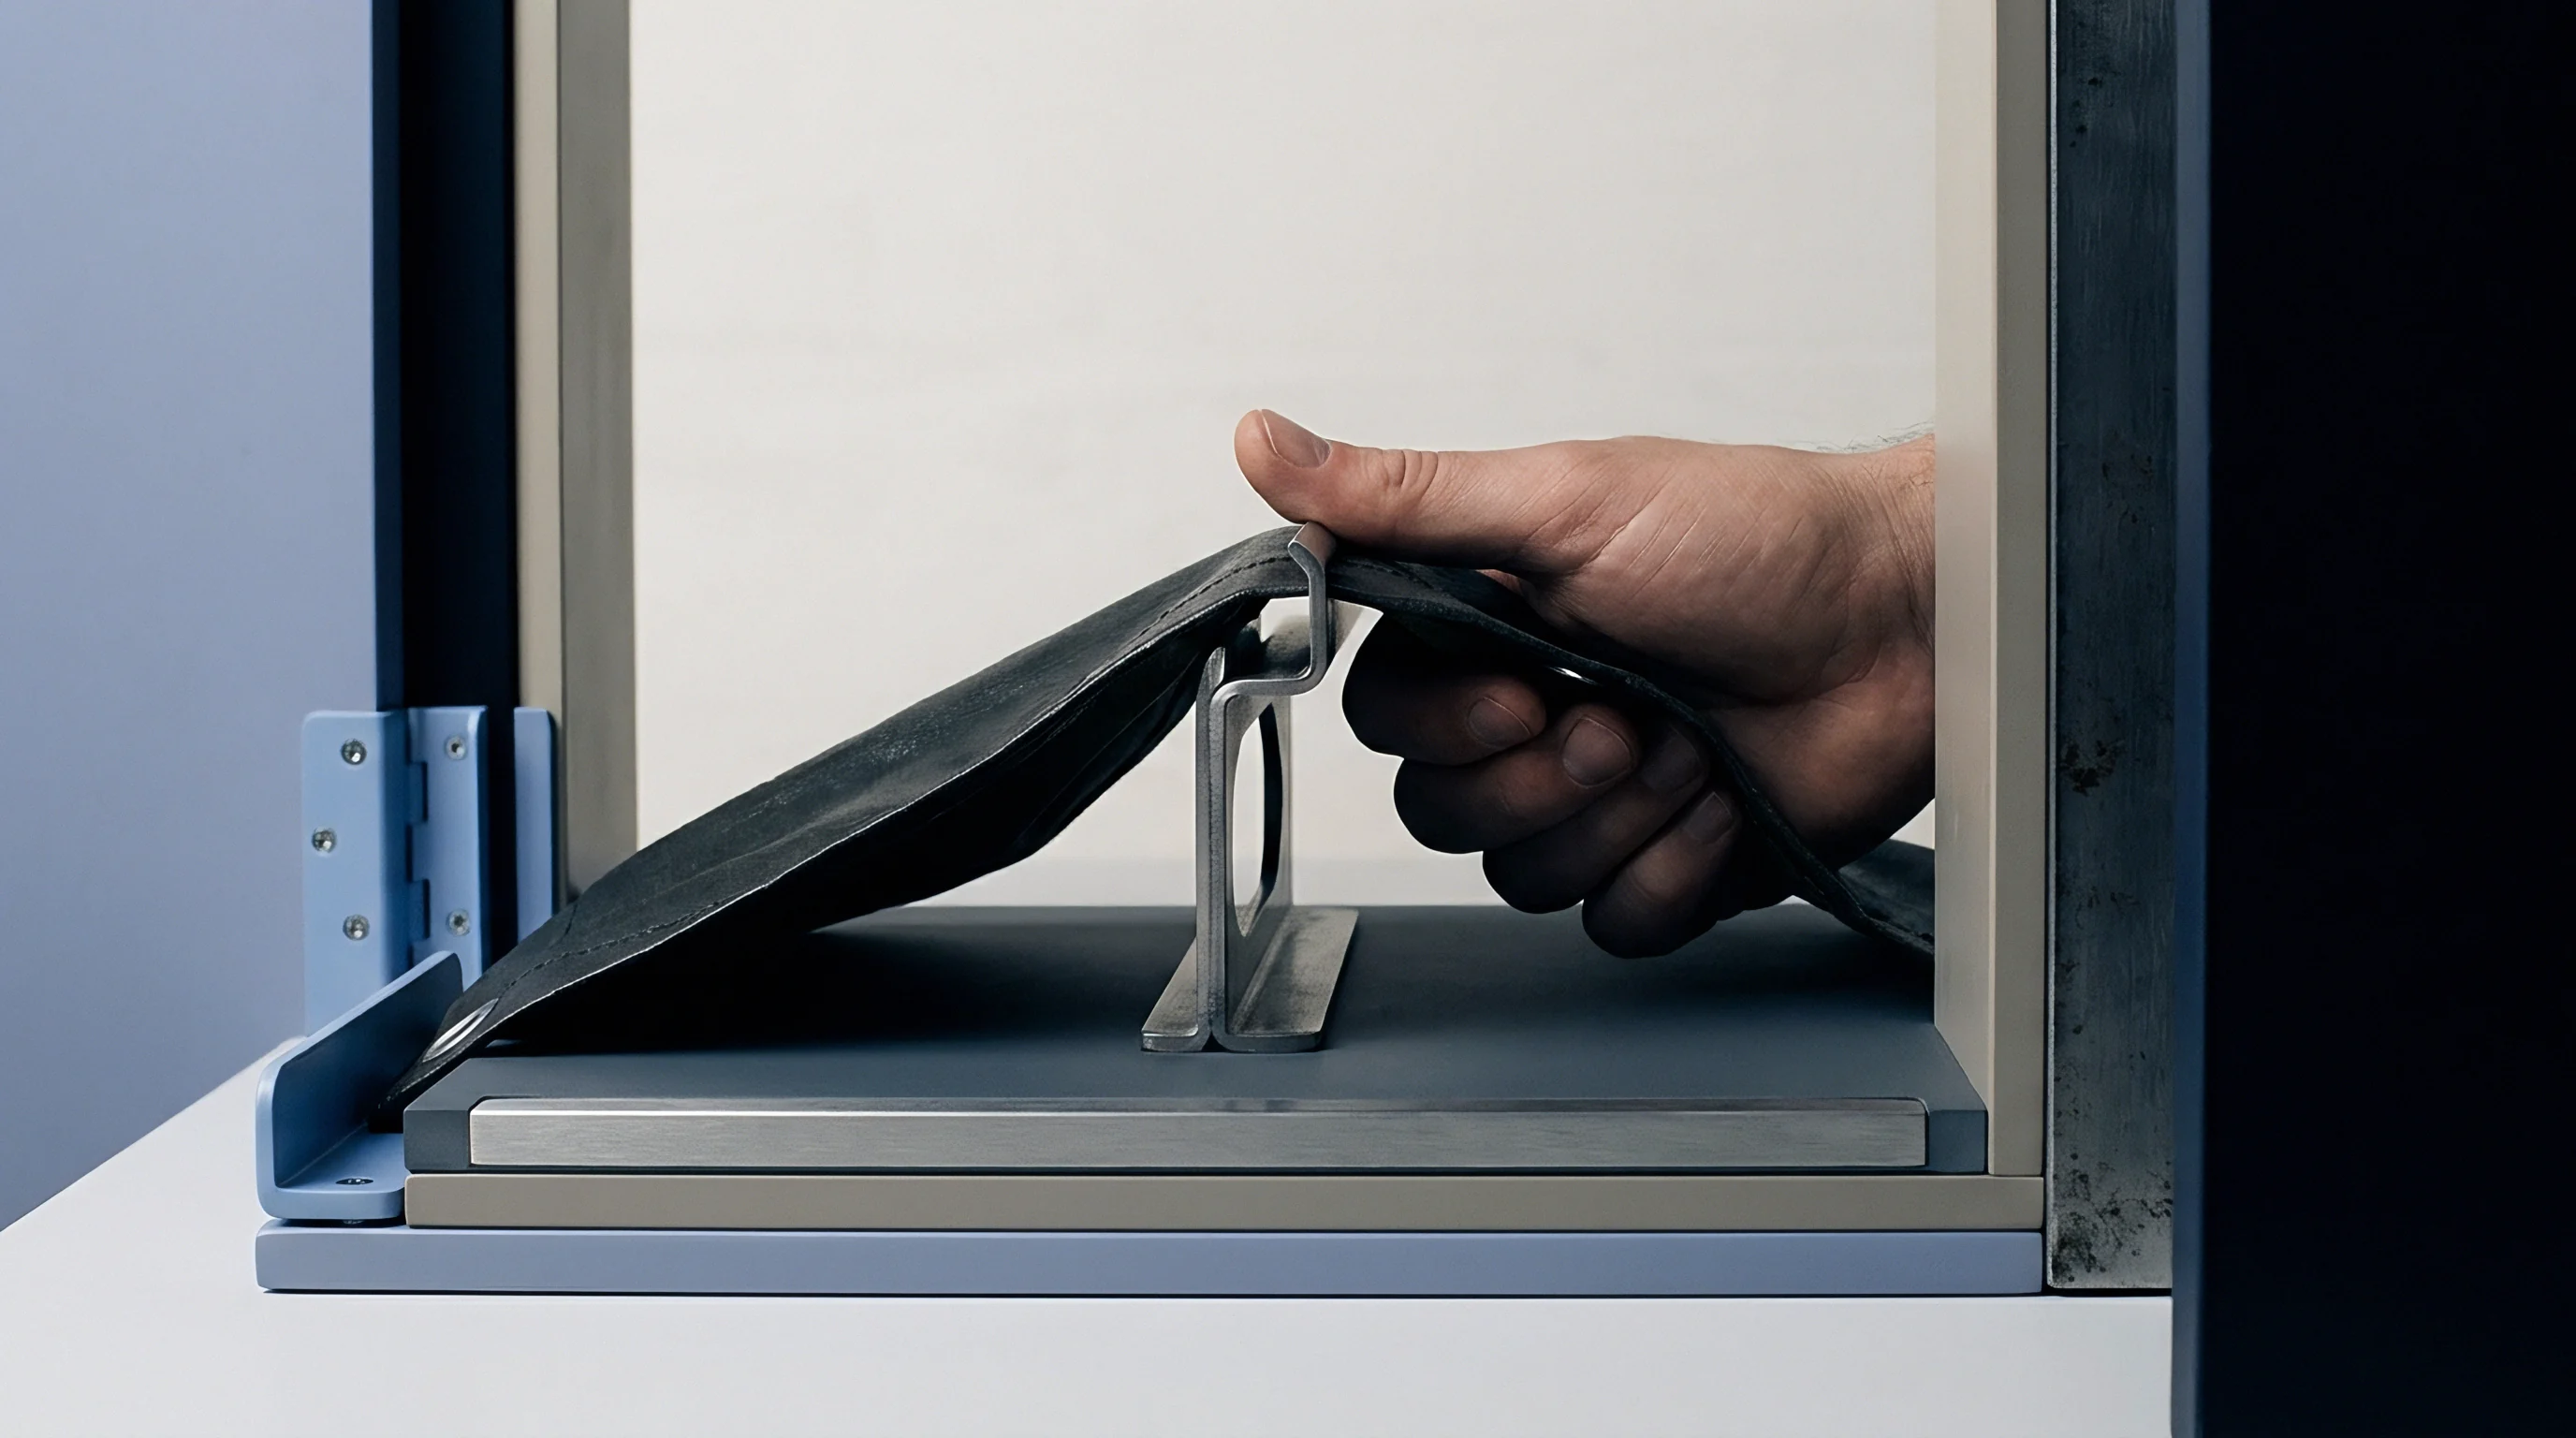
Industrial textile gantries hold pushbroom hyperspectral imagers alongside stabilized tungsten-halogen or high-CRI broadband LED line lights. Line flutter, mechanical vibration, and distance variation between the lens and the moving web directly alter the incident photon flux reaching the charge-coupled device or CMOS detector array. A vertical fabric displacement of two millimetres shifts the absolute reflectance curve across all wavelengths, producing artificial lightness errors.
Rigid tension rolls, vacuum hold-down plates, and precision mechanical encoders stabilize the moving target plane to maintain constant focal distance across the entire operational run.
- The mechanical engineer positions the optical frame perpendicular to the selvedge over a vibration-isolated roller support.
- The line scan sensor runs continuous dark-current and white-tile reference calibrations every sixty minutes to arrest detector drift.
- The acquisition software registers high-resolution spectral arrays across the full width, tagging cross-roll coordinates to specific yarn positions.
- The processor converts radiance values into standardized CIE L a b coordinates under defined illuminant and observer tables.
Divergence between inline spectral cameras and laboratory instruments generates false rejections on the finishing line or permits out-of-shade yardage to ship. Unaligned inline monitoring systems produce conflicting shade data that invalidates automated cutting sorting, forcing whole-lot quarantine at the destination port.
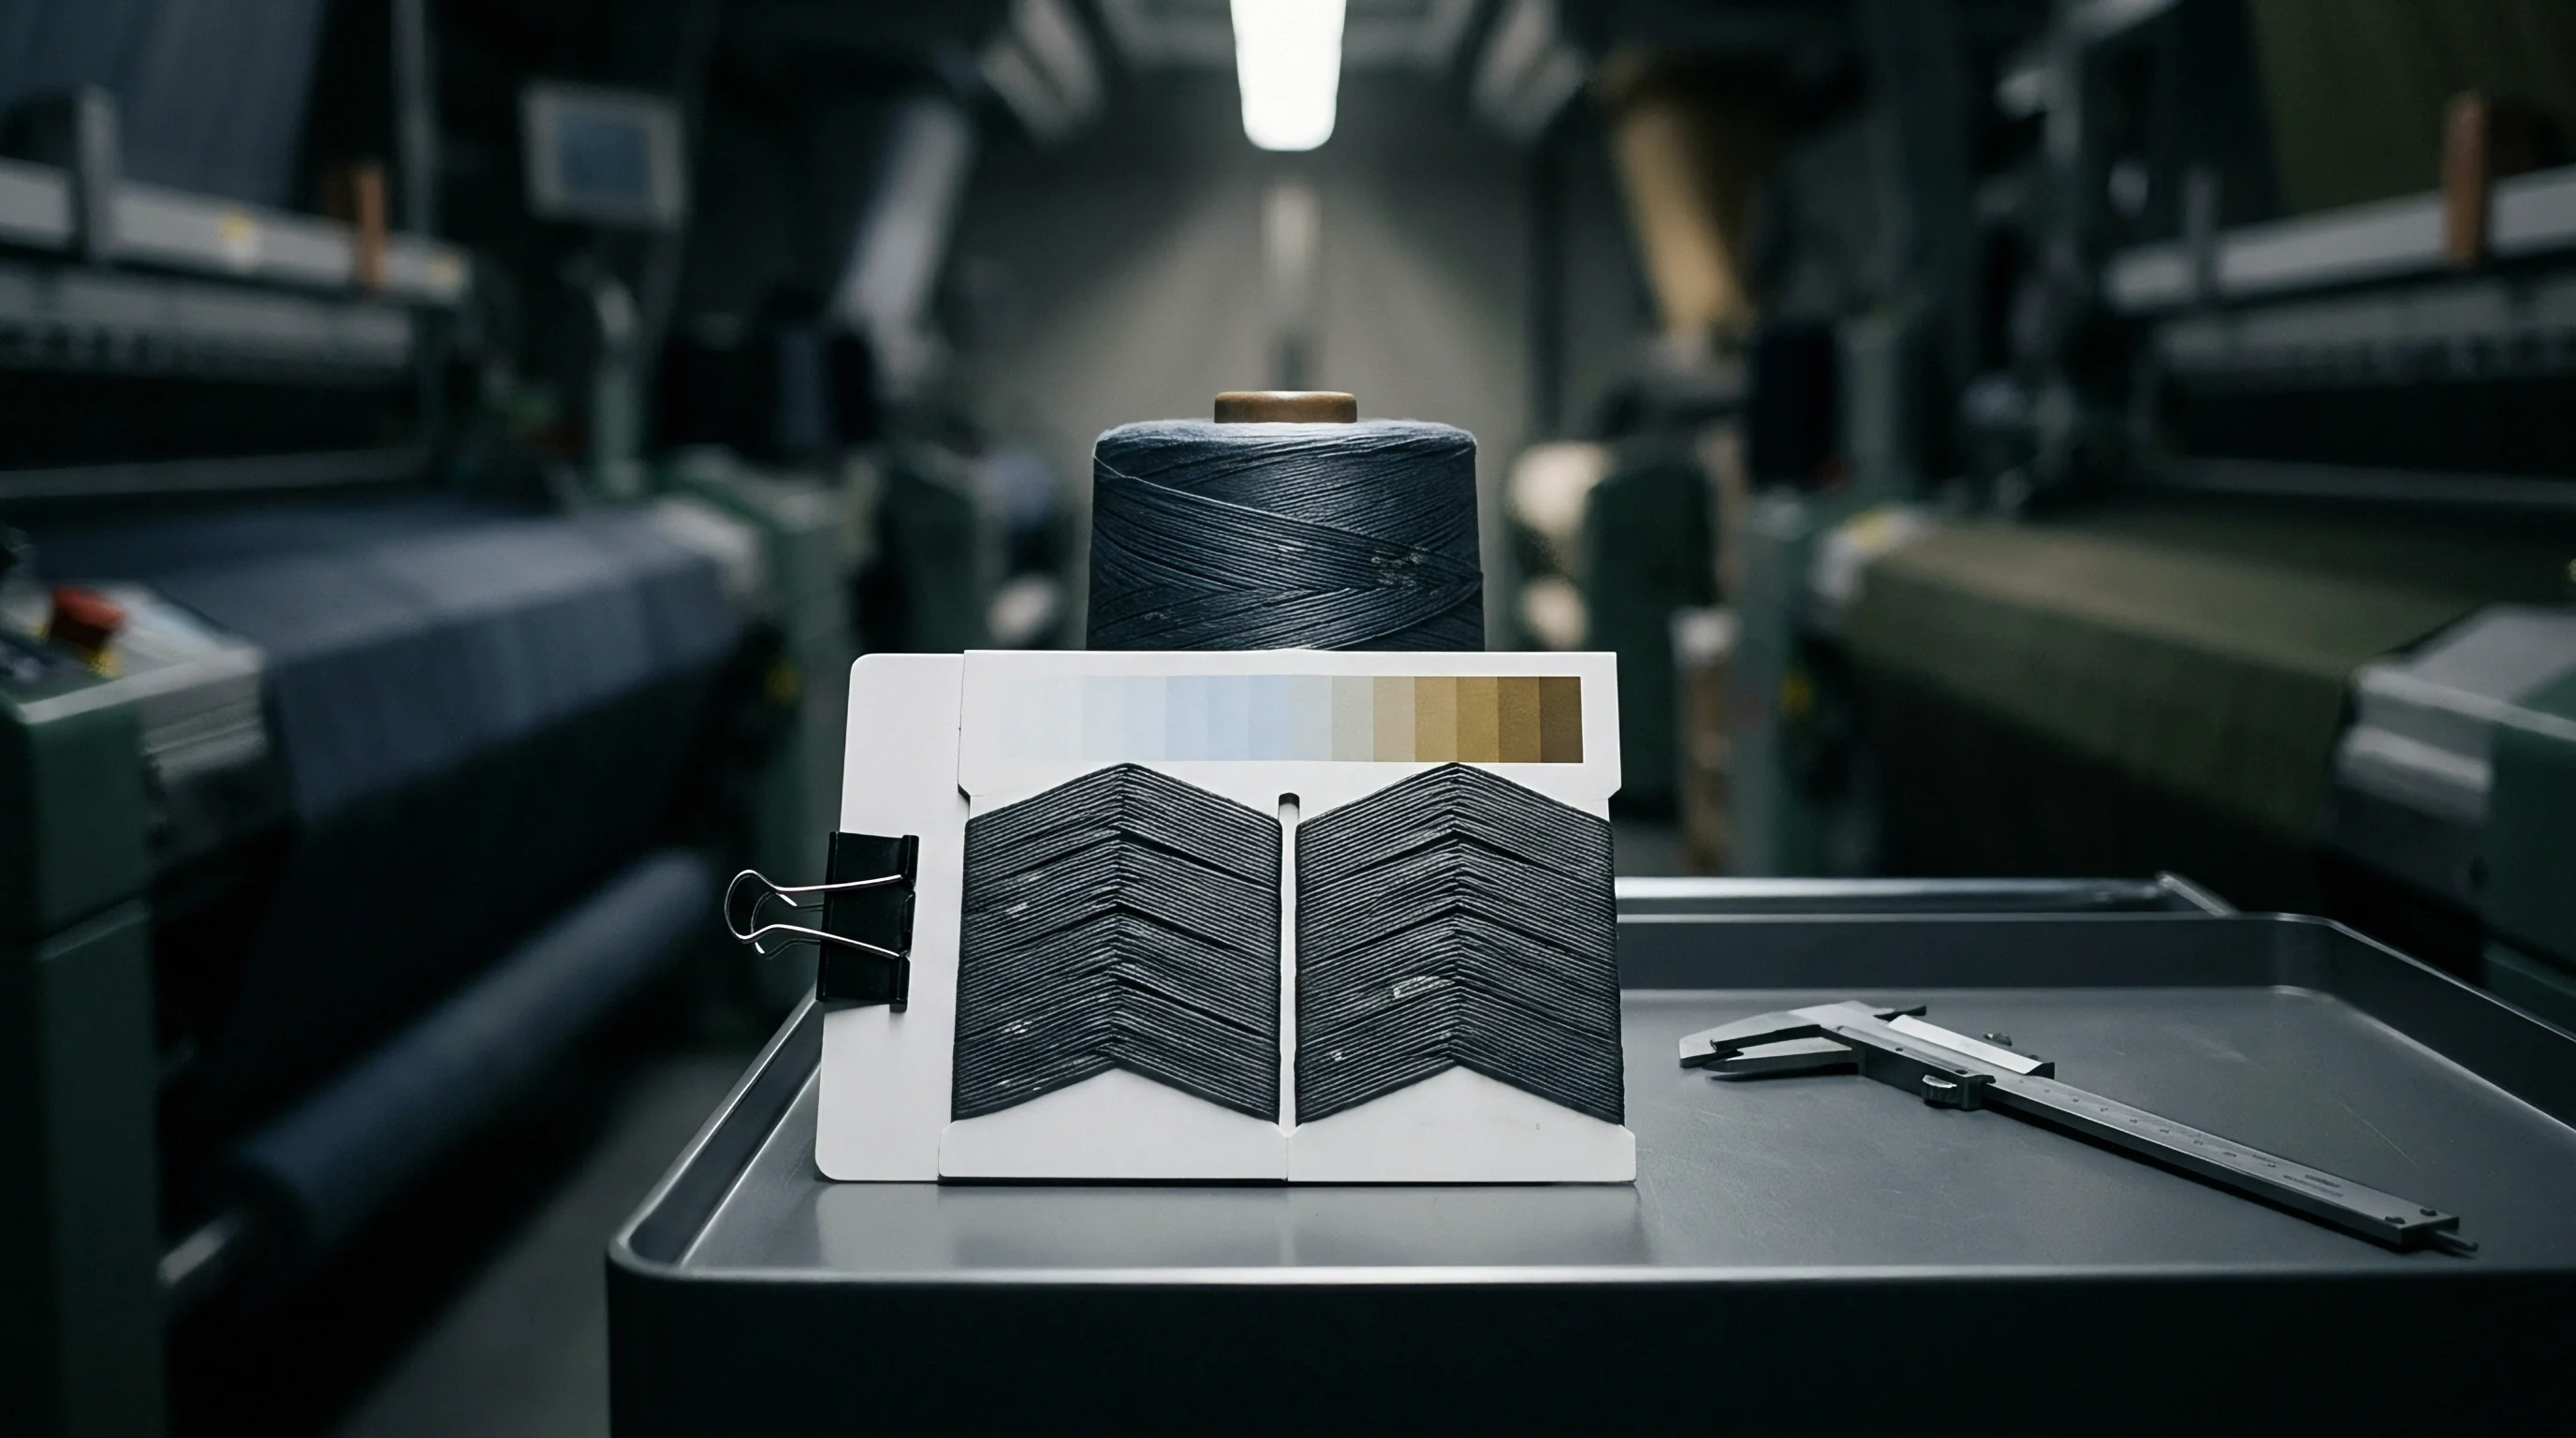
Bandwidth
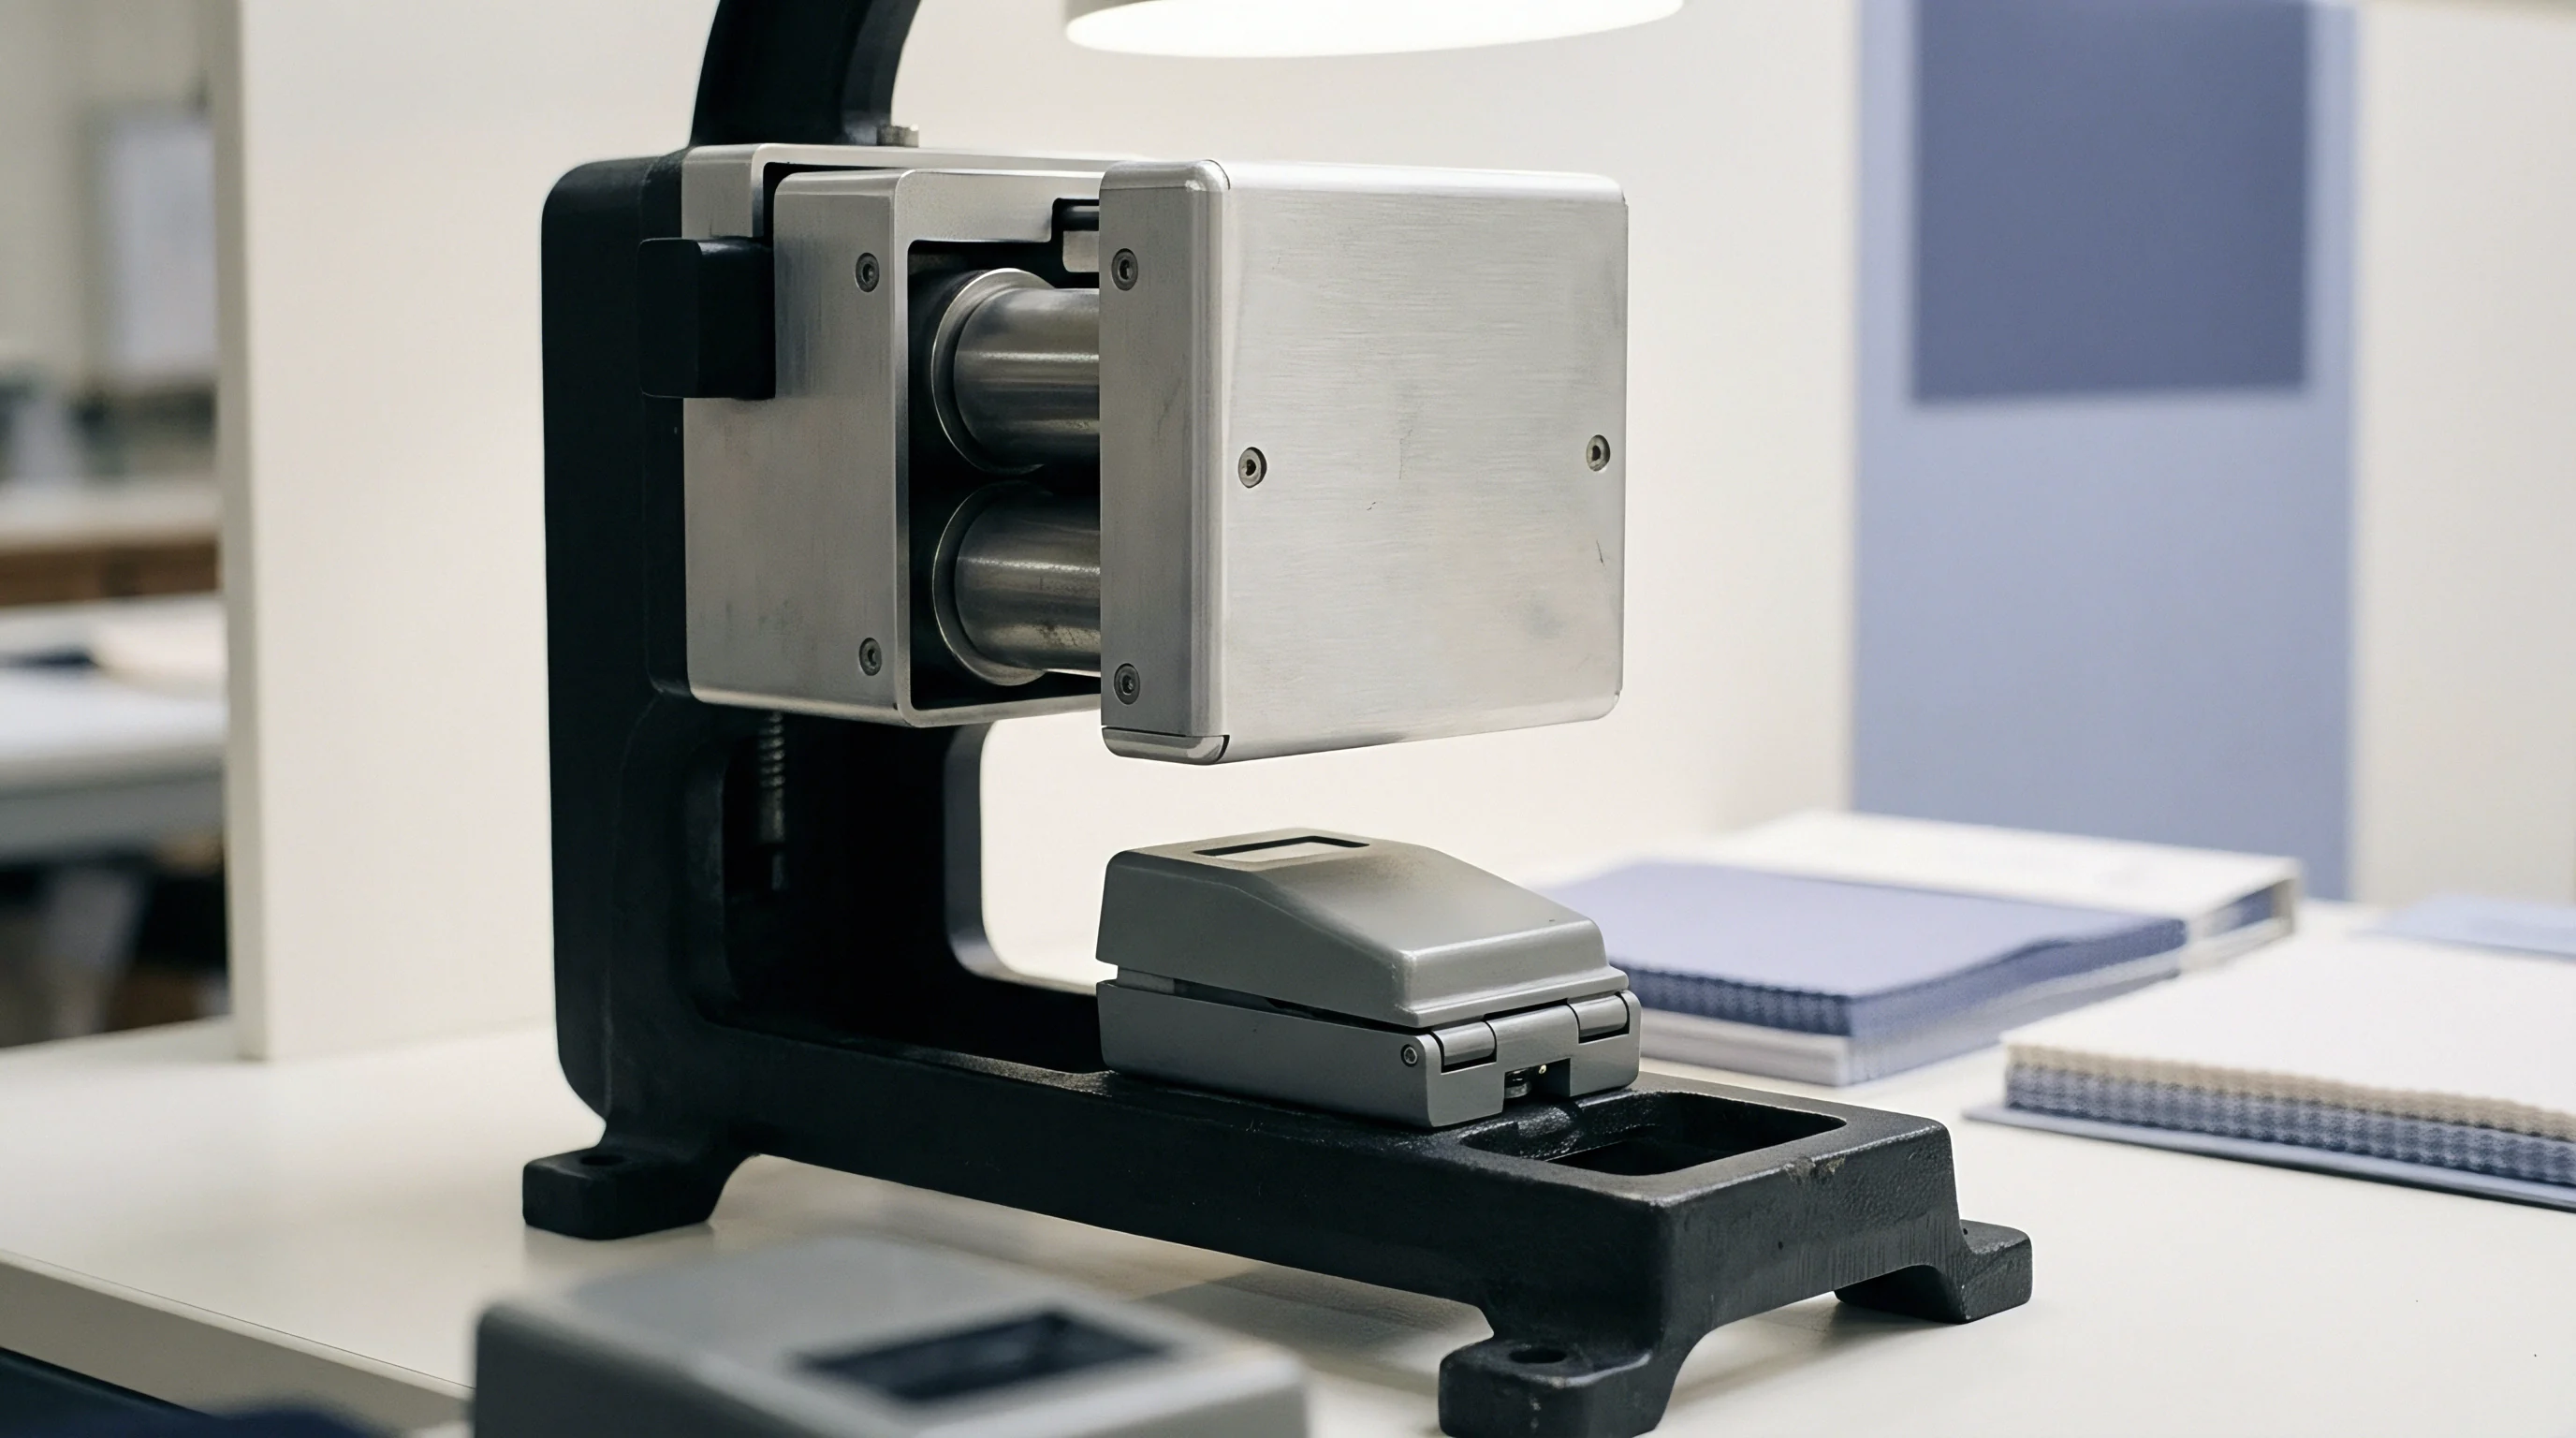
Laboratory spectrophotometers read spectral reflectance from 360 to 750 nanometres at ten-nanometre intervals, employing integrating spheres conforming to ISO 7724 or ASTM E1164. In contrast, line-scan hyperspectral sensors capture radiance between 400 and 700 nanometres with spectral sampling intervals ranging between two and five nanometres. The optical path differences between diffuse d:8° geometry with specular component included or excluded and the directional 45°:0° geometry native to most inline line-lighting arrays create systematic colour offsets on textured or structured surfaces.
| Parameter | Laboratory Benchtop d:8° | Laboratory Benchtop 45°:0° | Inline Spectral Line-Scan |
|---|---|---|---|
| Illumination Geometry | Diffuse integrating sphere | Directional 45° circumferential | Linear directional beams (30° to 45°) |
| Viewing Geometry | 8° from surface normal | 0° normal to surface | 0° normal to surface |
| Spectral Resolution | 10 nm optical bandpass | 10 nm optical bandpass | 2.5 nm to 6 nm sensor sampling |
| Measurement Field | 10 mm to 30 mm aperture | 12 mm to 25 mm aperture | 0.5 mm spatial pixel array |
| Measurement Speed | 1.5 to 3.0 seconds per point | 1.0 to 2.5 seconds per point | 15,000 to 40,000 lines per second |
| Sample Presentation | Conditioned flat, backed plate | Conditioned flat, backed plate | Dynamic moving web under tension |
Surface texture, yarn orientation, and twill angle scatter directional inline light differently than a diffuse laboratory sphere. A 3/1 right-hand twill weave examined under directional inline lighting reflects specular highlights that skew chroma measurements unless mathematical bandpass convolution and spatial averaging are applied. Calculating colour coordinates requires downsampling the continuous spectral curve through standardized ASTM E308 weight tables to match the discrete ten-nanometre intervals of the target laboratory benchtop spectrophotometer.
Directional line lighting on structured weaves produces apparent lightness shifts up to 1.8 CIE L units when compared to integrating sphere measurements taken on conditioned swatches.
Spatial resolution in continuous cameras provides millions of discrete measurement points per running metre. A benchtop instrument averages optical signals across a circular twenty-five millimetre aperture. Emulating benchtop readings requires the inline software to execute spatial binning algorithms, aggregating pixel grids across equivalent circular areas while eliminating false edge signals caused by hairiness, lint, or structural voids in open knits.
- Specular Scattering Variation occurs when raised loops in terry fabrics or slub yarns cast micro-shadows under linear illumination arrays.
- Bandpass Integration Mismatch arises from triangular versus Gaussian slit-function differences between grating spectrometers and benchtop optical filter wheels.
- Polarization Bias develops from synthetic filament orientation under line-scan sensor prisms, introducing artificial hue shifts along yarn axes.
- Edge Aperture Losses appear in translucent lightweight plain weaves where incident light bleeds laterally through the structure outside the detector pixel footprint.
Mill technicians routinely claim that surface luster variations between spinning lots make perfect agreement between inline and laboratory instruments impossible during continuous long-run production.
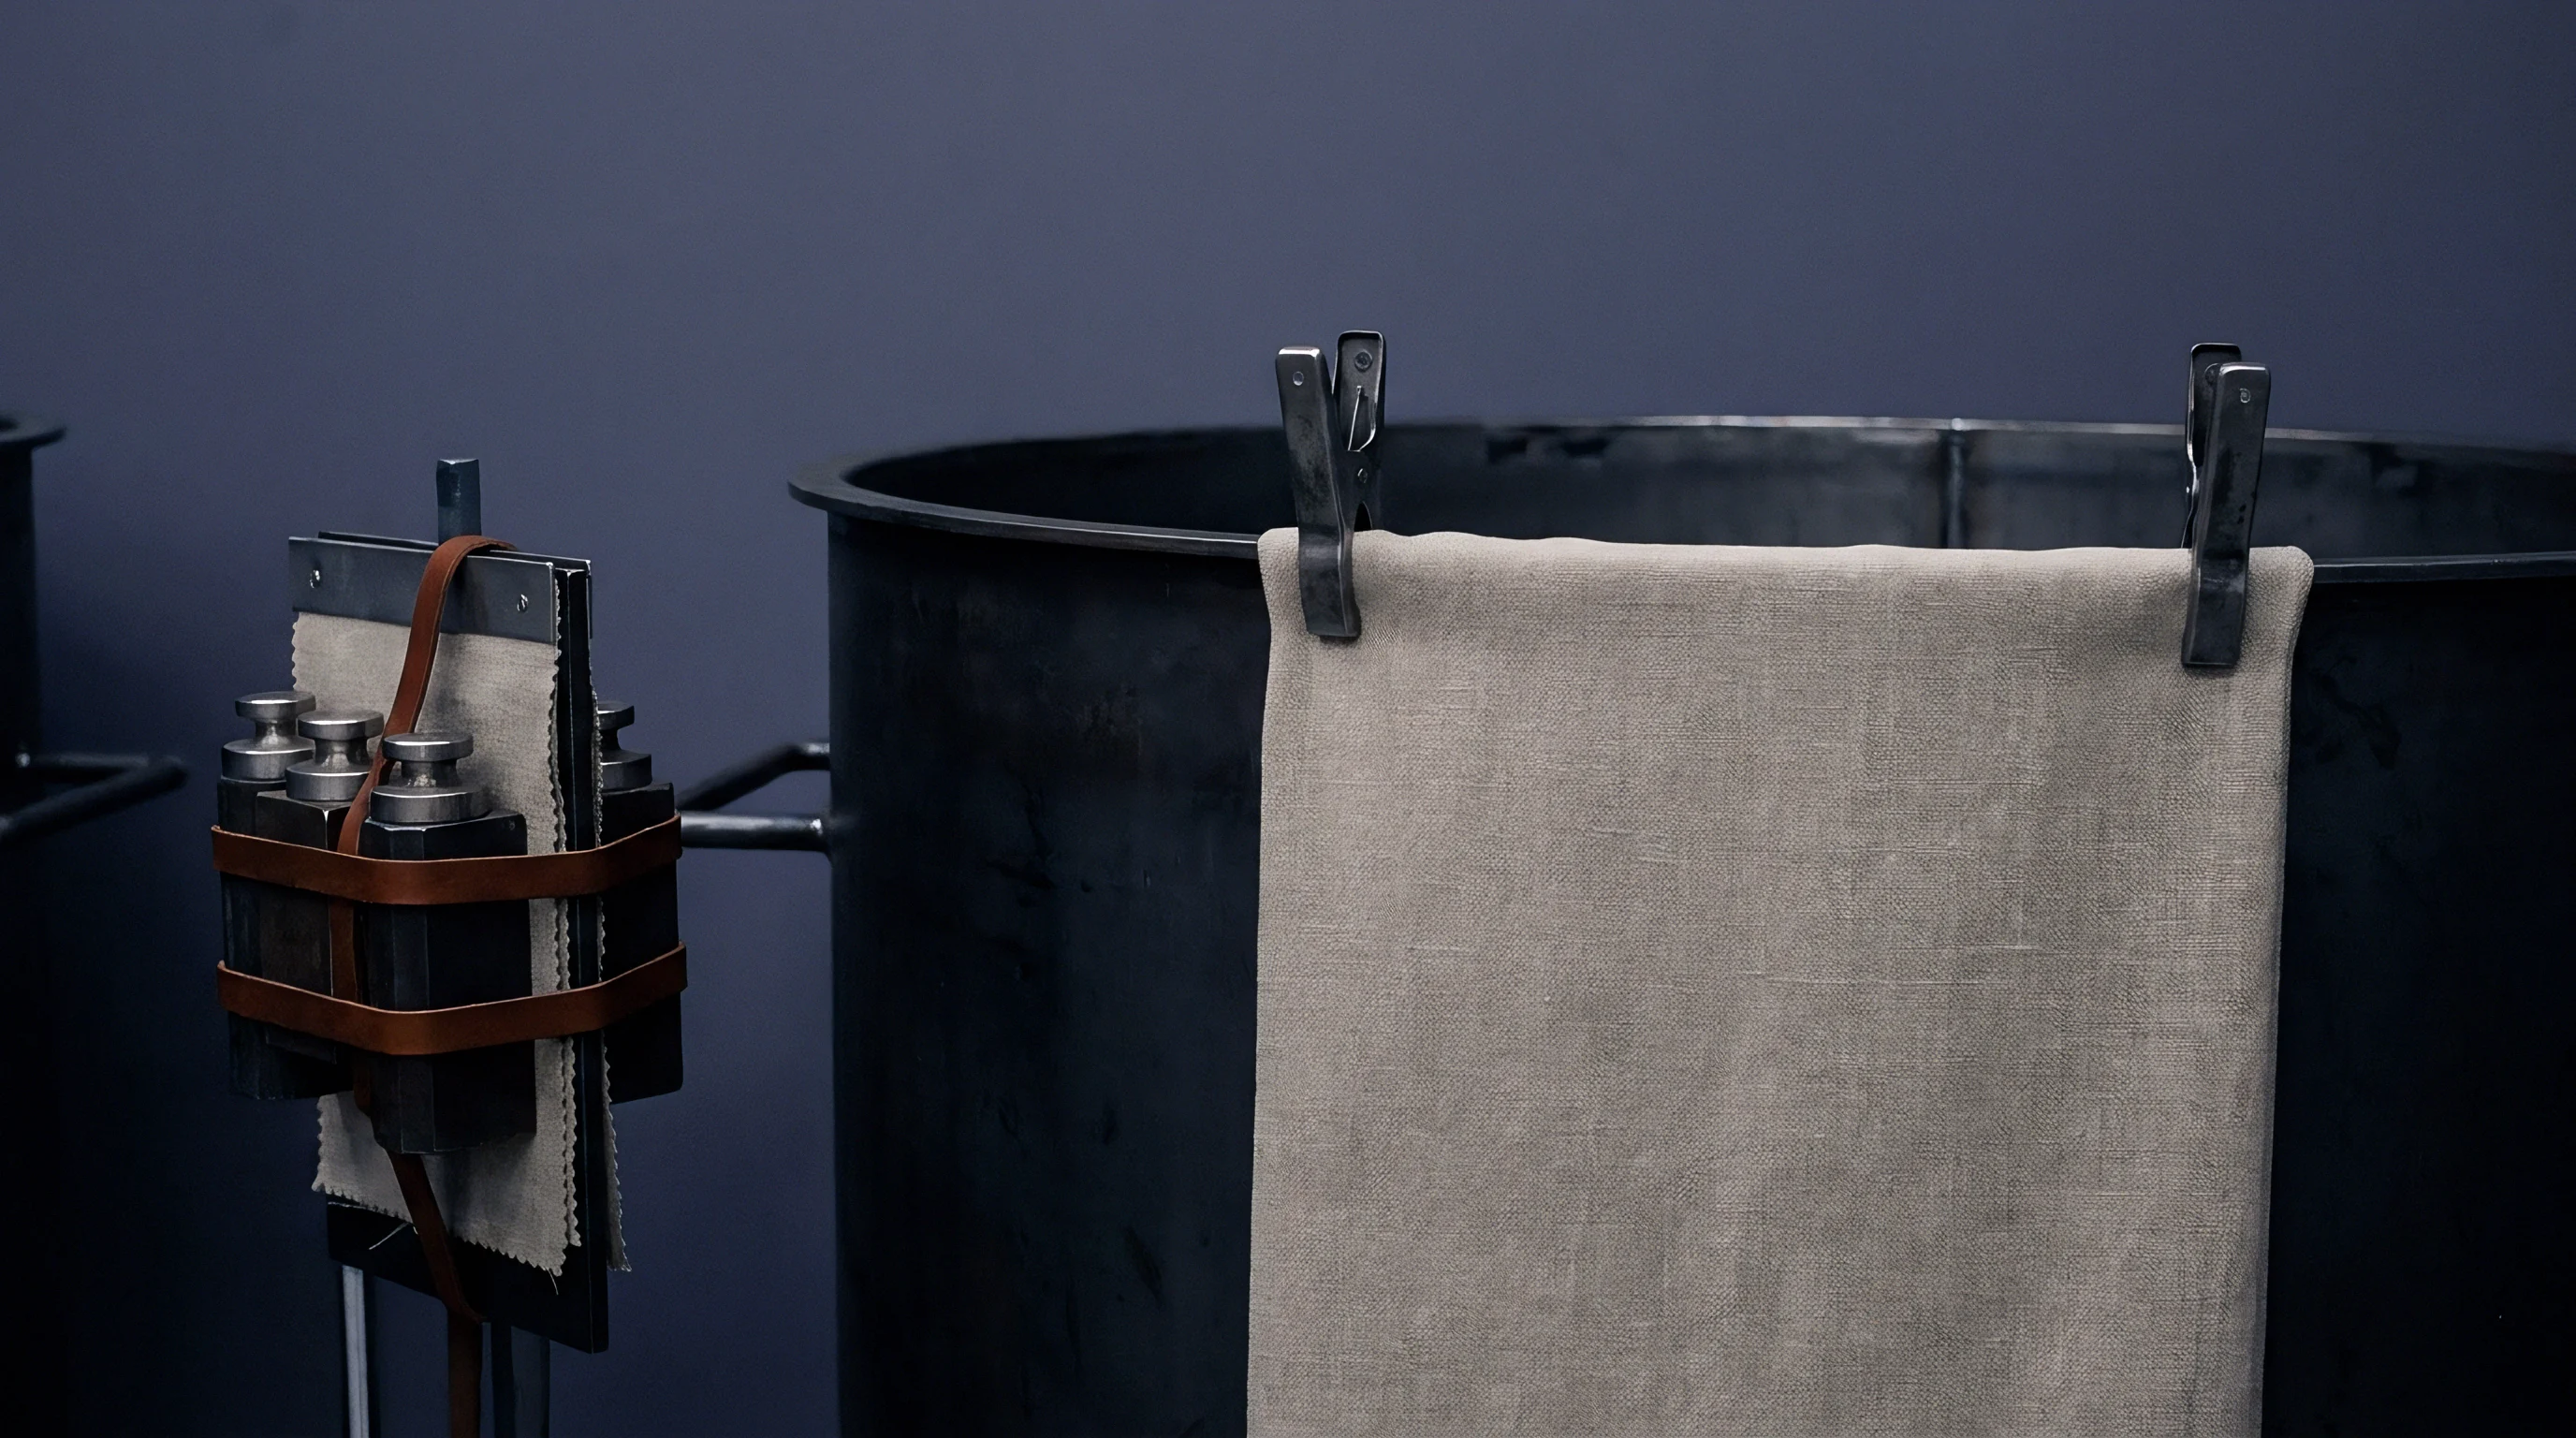
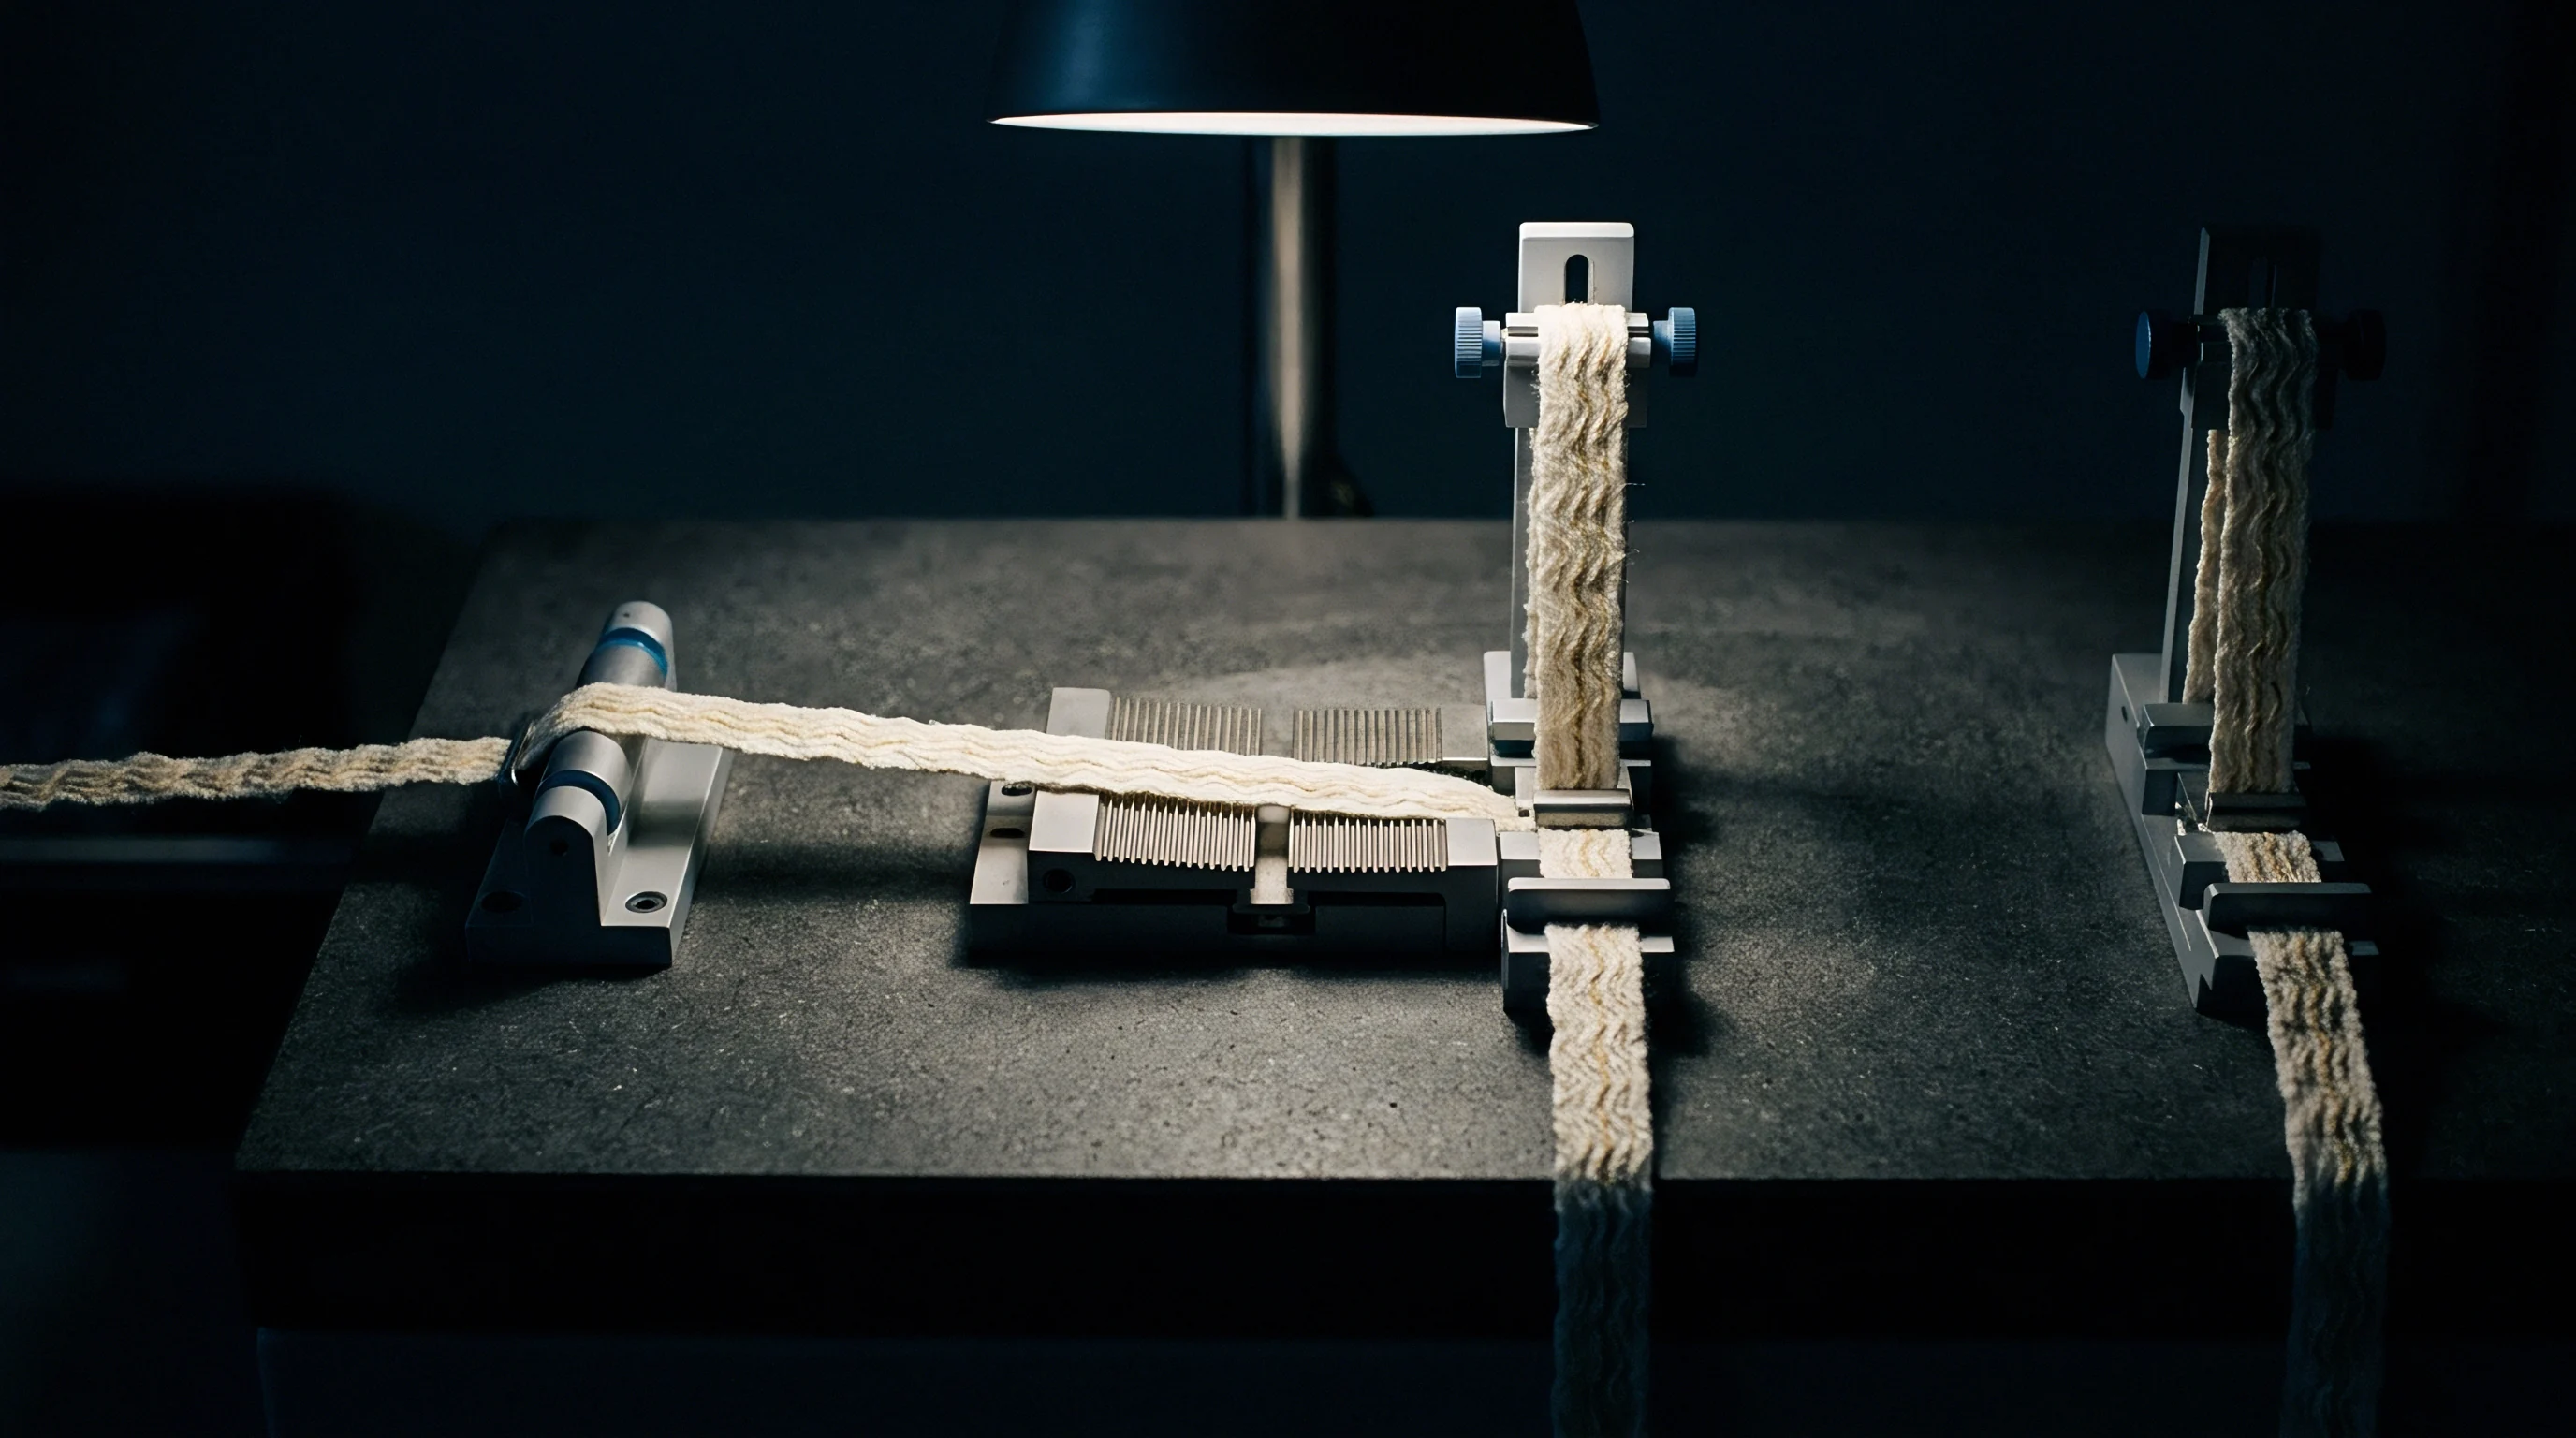
Transform
Raw digital counts from charge-coupled pixels convert to spectral reflectance factors through multidimensional calibration matrices. The transformation algorithm links camera-measured spectral radiance values to reference reflectance values measured on physical calibration standards with an accredited laboratory spectrophotometer. Direct linear regression, principal component analysis, and polynomial transfer functions model the optical transfer bridge between platforms.
Does Mathematical Regression Eliminate Metameric Errors?
Empirical transformation matrices trained on single-dye recipes break down when exposed to metameric dye formulations or varied fiber blends. A matrix trained purely on reactive-dyed cotton poplin yields significant color errors when applied to disperse-dyed polyester micro-twill. Transfer algorithms implement Wiener estimation or regularized least-squares regression across diverse dye libraries to establish robust cross-instrument agreements.
Transfer matrices calibrated without fiber-specific reflectance baselines fail when production shifts between dye classes.
The mathematical conversion workflow maps raw inline spectral vectors into corrected laboratory-equivalent vectors. Let matrix R represent the benchtop spectral reflectance across thirty-one ten-nanometre bins from 400 to 700 nanometres. The inline camera measures an N-channel radiance vector C.
The transformation matrix M minimizes the root-mean-square spectral error across a standardized library of target fabrics.
Color difference equations calculate tolerance boundaries from the transformed spectral data. The supply chain standardizes on CMC(2:1) or CIE DE2000 calculations under D65 10-degree standard observer conditions, per ISO 105-J03. Transforming spectral curves rather than direct L a b coordinates preserves the integrity of colour coordinates under secondary illuminants such as Illuminant A or Illuminant F11, exposing batch metamerism during continuous running.
The exact mathematical formulation that reconciles high-speed spectral radiance with static diffuse laboratory standards across wide fiber blends remains an open subject of industrial development.
Stenter
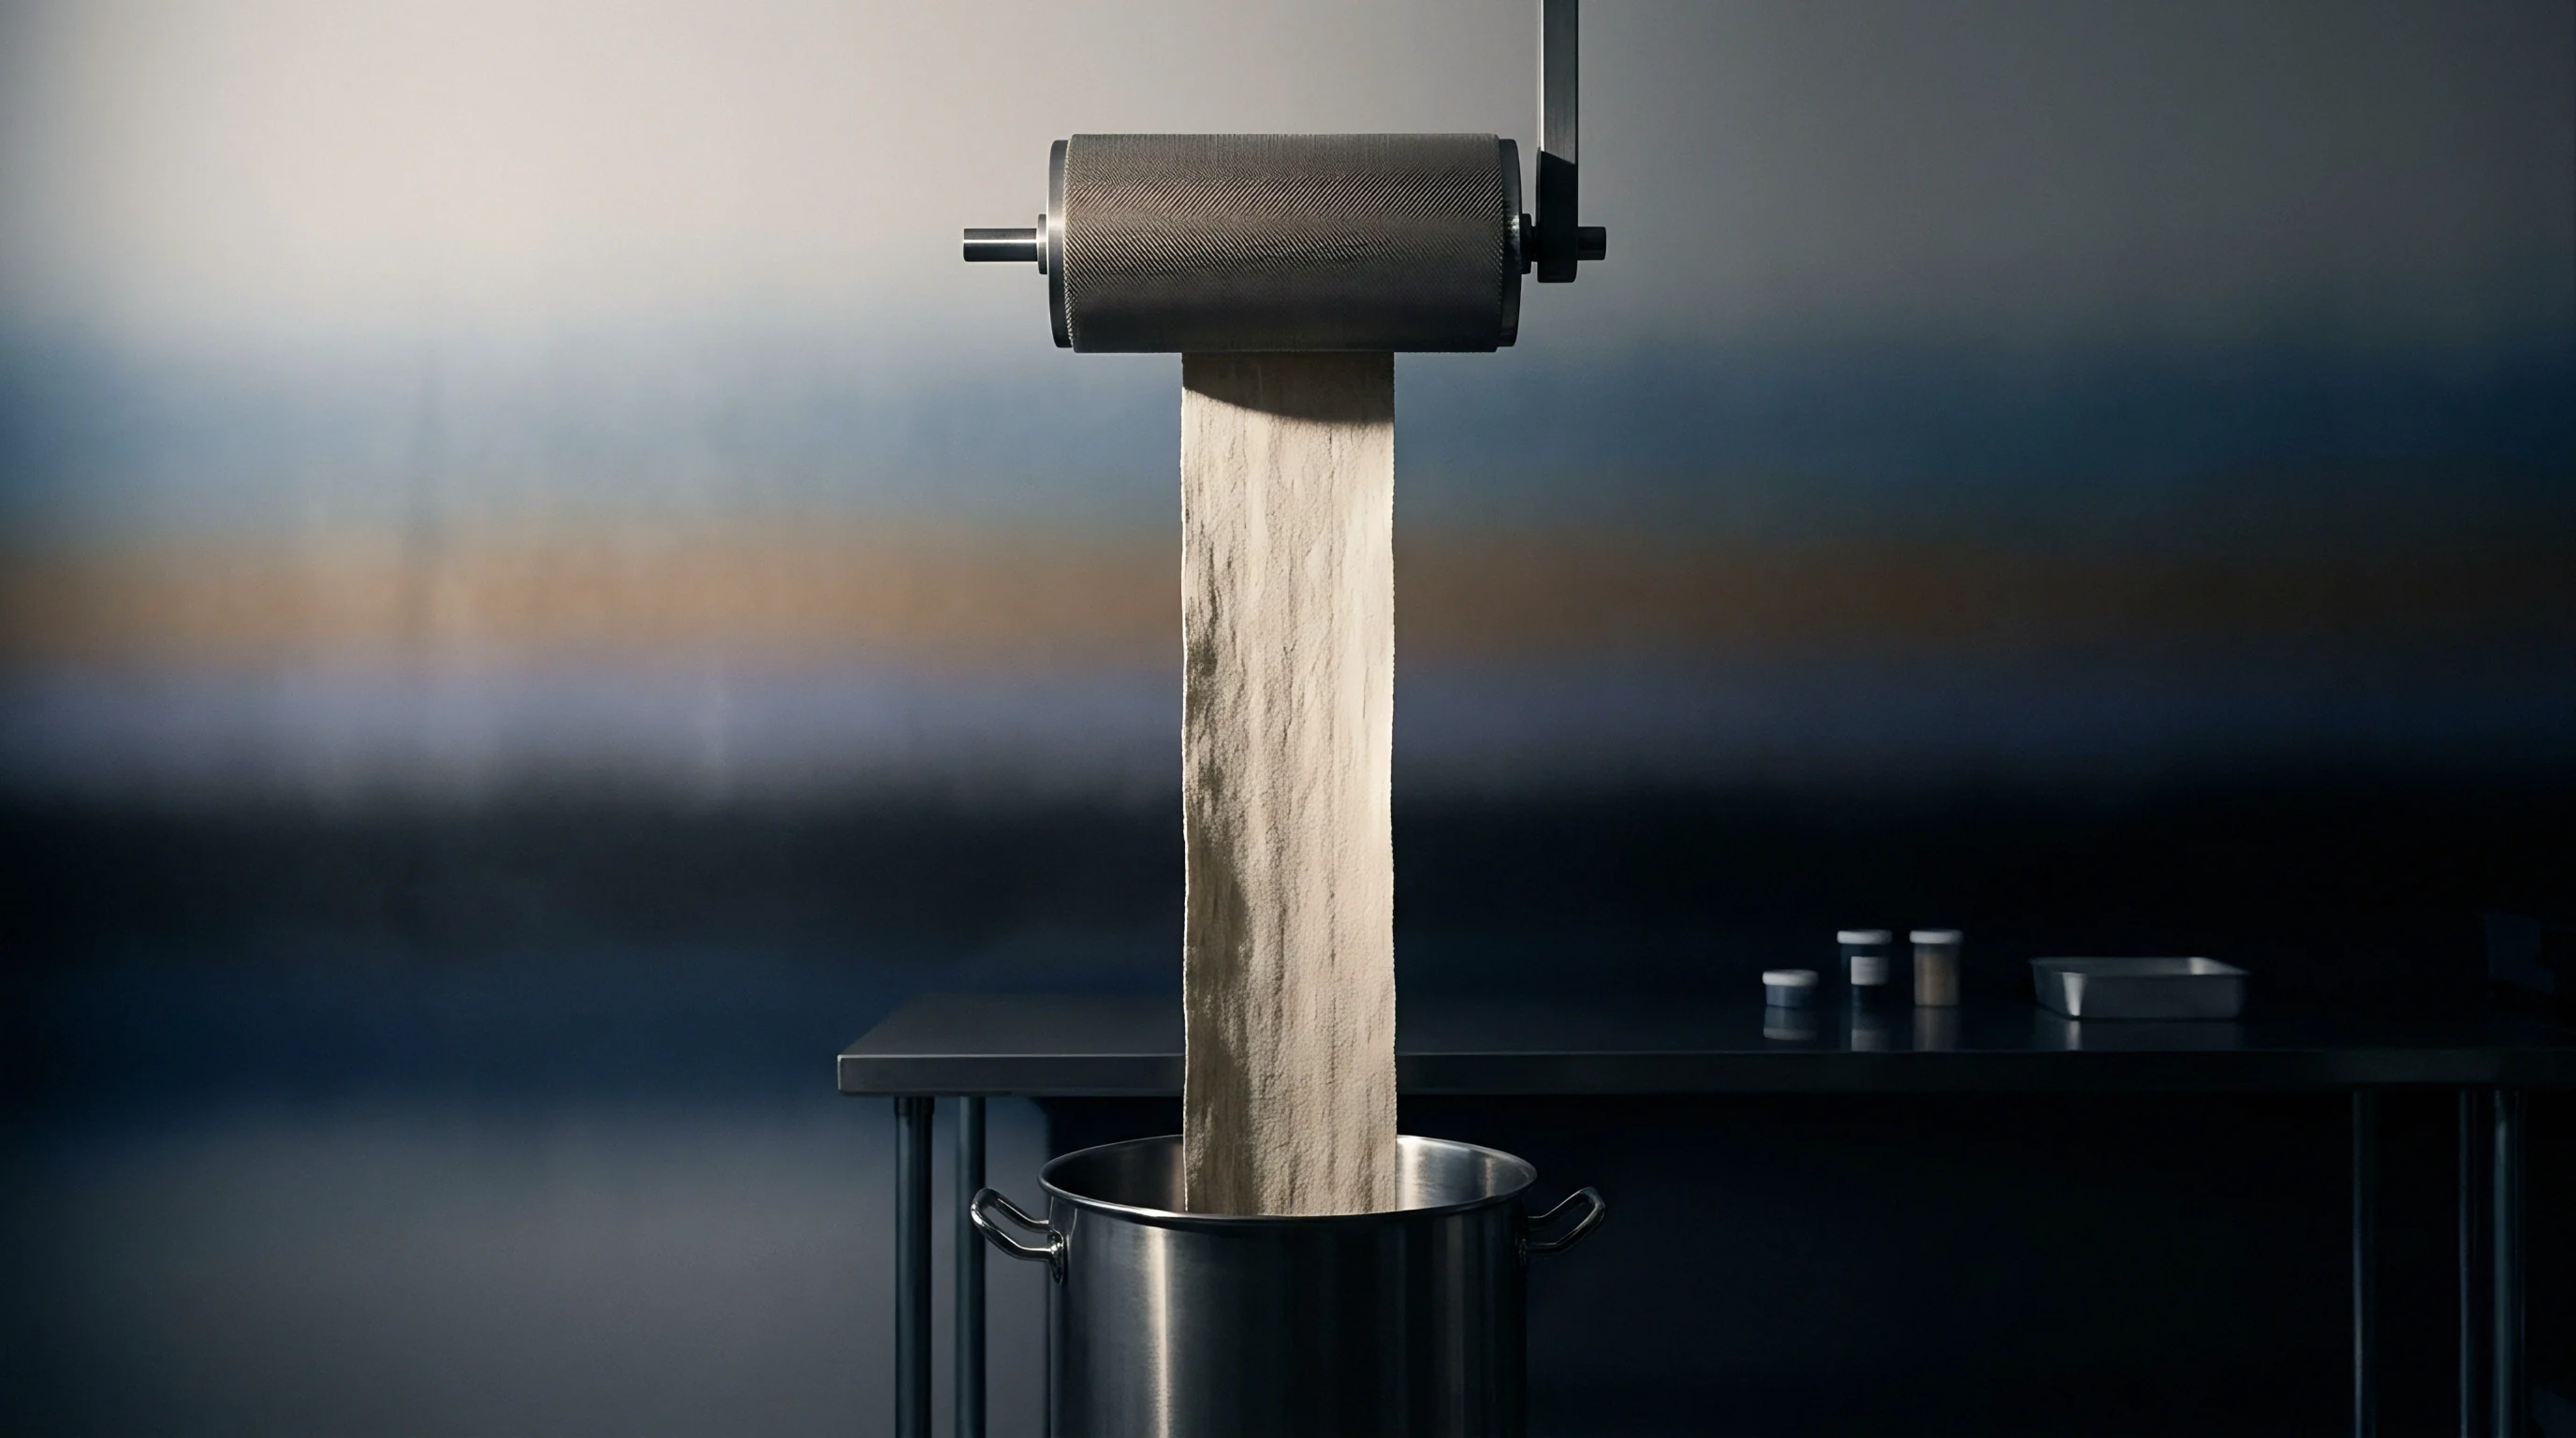
Fabric exiting the heat-setting stenter carries residual thermal energy and depressed moisture regain values that distort immediate spectral readings. Temperature shifts directly induce reversible thermochromic colour shifts in specific dye classes, particularly direct, disperse, and vat dyes. Reactive yellow and blue trichromatic recipes display measurable red and yellow shifts while cooling from eighty degrees Celsius to ambient laboratory temperature.
Do Moisture and Heat Invalidate Inline Readings?
Online measurements recorded directly on hot cloth fail standard laboratory tolerance tests unless dynamic compensation models are embedded into the processing loop. Standard laboratory conditioning under ISO 139 dictates twenty degrees Celsius and sixty-five percent relative humidity for a minimum of four hours. Continuous processing requires mathematical compensation curves that adjust measured spectral reflectance in real time based on inline contact pyrometers and microwave moisture sensors positioned adjacent to the camera gantry.
| Substrate | Dye Class | Temperature Delta (+40°C) | Moisture Loss Delta (-4% Regain) | Net Uncorrected DE2000 |
|---|---|---|---|---|
| 100% Cotton Plain Weave | Reactive Trichromatic | +0.45 DL , -0.62 Da , +0.38 Db | +0.30 DL , +0.15 Da , -0.10 Db | 0.82 |
| 100% Cotton Twill | Vat Olive/Brown | -0.20 DL , +0.85 Da , +1.10 Db | +0.25 DL , +0.05 Da , +0.20 Db | 1.42 |
| Polyester Interlock Knit | Disperse High-Energy | -0.10 DL , +0.35 Da , +0.55 Db | 0.00 DL , 0.00 Da , 0.00 Db | 0.68 |
| Nylon 6,6 Ripstop Weave | Acid Premetalized | +0.15 DL , -0.40 Da , +0.25 Db | +0.18 DL , +0.08 Da , -0.05 Db | 0.54 |
Fabric construction variables alter the rate of thermal dissipation and moisture absorption across the moving bolt. Dense 300 gsm drill fabrics retain core thermal mass longer than 90 gsm plain weaves, generating a variable temperature gradient from selvedge to center if cooling air bars malfunction. Uneven cooling produces artificial side-to-side shade taper readings on inline displays.
Standard ISO 105-J03 color difference determinations require verification against conditioned specimens whenever inline thermal drift exceeds 0.3 DE2000 units.
Tension variations on the delivery rolls change yarn packing density per unit area. Excessive longitudinal tension elongates knit loops and increases warp yarn sett in wovens, altering optical penetration depth and perceived color strength. Maintaining calibrated load-cell tension isolation ensures the camera reads a structural geometry matching the relaxed state evaluated on laboratory inspection tables.
Thermal stability on the finishing frame determines optical consistency across the whole bolt.
Covenant
Commercial shade acceptance contracts require precise definitions of how inline spectral data relates to laboratory batch release. Brands and supply chain managers define master digital color standards using QTX or CxF3 data files established on master laboratory benchtop instruments. Production dyehouses utilize inline continuous spectral cameras to map spatial roll homogeneity, side-center-side variation, and end-to-end drift, linking the inline rolling average directly to the approved digital master.
| Inspection Metric | Test Protocol Standard | Commercial Pass Limit (DE2000) | Action on Exceedance |
|---|---|---|---|
| Batch Mean vs Digital Master | ISO 105-J03 / D65 10° | DE2000 ≤ 0.60 | Lot hold; re-dyeing or shade sorting required |
| Continuous End-to-End Drift | 50-metre moving average | DE2000 ≤ 0.40 | Speed reduction; dosing pump adjustment |
| Cross-Roll Side-Center-Side | Left, center, right spatial bins | DE2000 ≤ 0.35 | Stenter padder roll pressure recalibration |
| Inline-to-Benchtop Delta | Conditioned swatch check | DE2000 ≤ 0.30 | Camera transfer matrix recalibration |
Execution of continuous shade approval relies on clear legal allocation of risk in the fabric supply agreement. Technical purchase specifications define whether an inline rolling average overrides a single destructive laboratory cutout swatch when settling commercial disputes. Clear language establishes whether shipments clear customs based on digital continuous roll pass certificates or accredited third-party benchtop lab dip audits.
The standard technical purchasing agreement stipulates that digital continuous roll records containing full-width spectral scans validated within a 0.30 DE2000 benchtop offset constitute final quality clearance, superseding destructive point swatches for shipment authorization.