Reconciling Transboundary Cashmere DNA Barcoding Variance against Accredited Electron Microscopy Standards
Reconciling cashmere DNA barcoding with electron microscopy requires binding contracts that use microscopy for mass ratios and genomics for trace screening.


Friction
A testing house issues a scanning electron microscopy certificate declaring a raw top consignment ninety-nine percent virgin cashmere. Three weeks later, an import authority or retail client runs targeted quantitative polymerase chain reaction assays and returns an eight percent sheep wool contamination call. The shipment stops at customs.
Capital sits frozen while demurrage accumulates daily on maritime containers.
This conflict between quantitative electron microscopy and genomic assays recurs across transboundary textile supply chains. Optical morphology and genomic sequencing measure fundamentally distinct physical attributes. Scanning electron microscopy evaluates outer cuticular patterns, scale frequency, and fibre diameter profiles.
Deoxyribonucleic acid barcoding targets mitochondrial or nuclear gene fragments. When two accredited testing houses pull subsamples from the same consignment, their reports regularly diverge past acceptable commercial tolerances.
A laboratory report stating ninety-nine percent cashmere under electron microscopy provides zero guarantee against genetic contamination calls on the same lot.
Reconciling these discrepancies requires tracing the boundary where physical fibre geometry decouples from extracted nucleotide integrity. Processing chemistry, mechanical dehairing, cross-species genomic overlap, and statistical subsampling errors corrupt cross-border testing alignment. Resolving disputes demands strict operational protocols before purchase orders are signed.
A purchasing team that treats test methods as equivalent certificates invites commercial vulnerability. Every test method carries systemic biases. Scanning electron microscopy depends on visual scale height and scale distance.
Operators visually categorize fibres based on phenotypic parameters that overlap between fine cashmere and de-scaled Merino wool. Real-time quantitative PCR targets genetic differences directly, yet it falters when industrial scouring or oxidative bleaching strips the extractable mitochondrial genome. A purchase contract needs to establish primary authority between physical and molecular verification methods.

Morphology

Optical Separation Principles under Accredited Guidelines
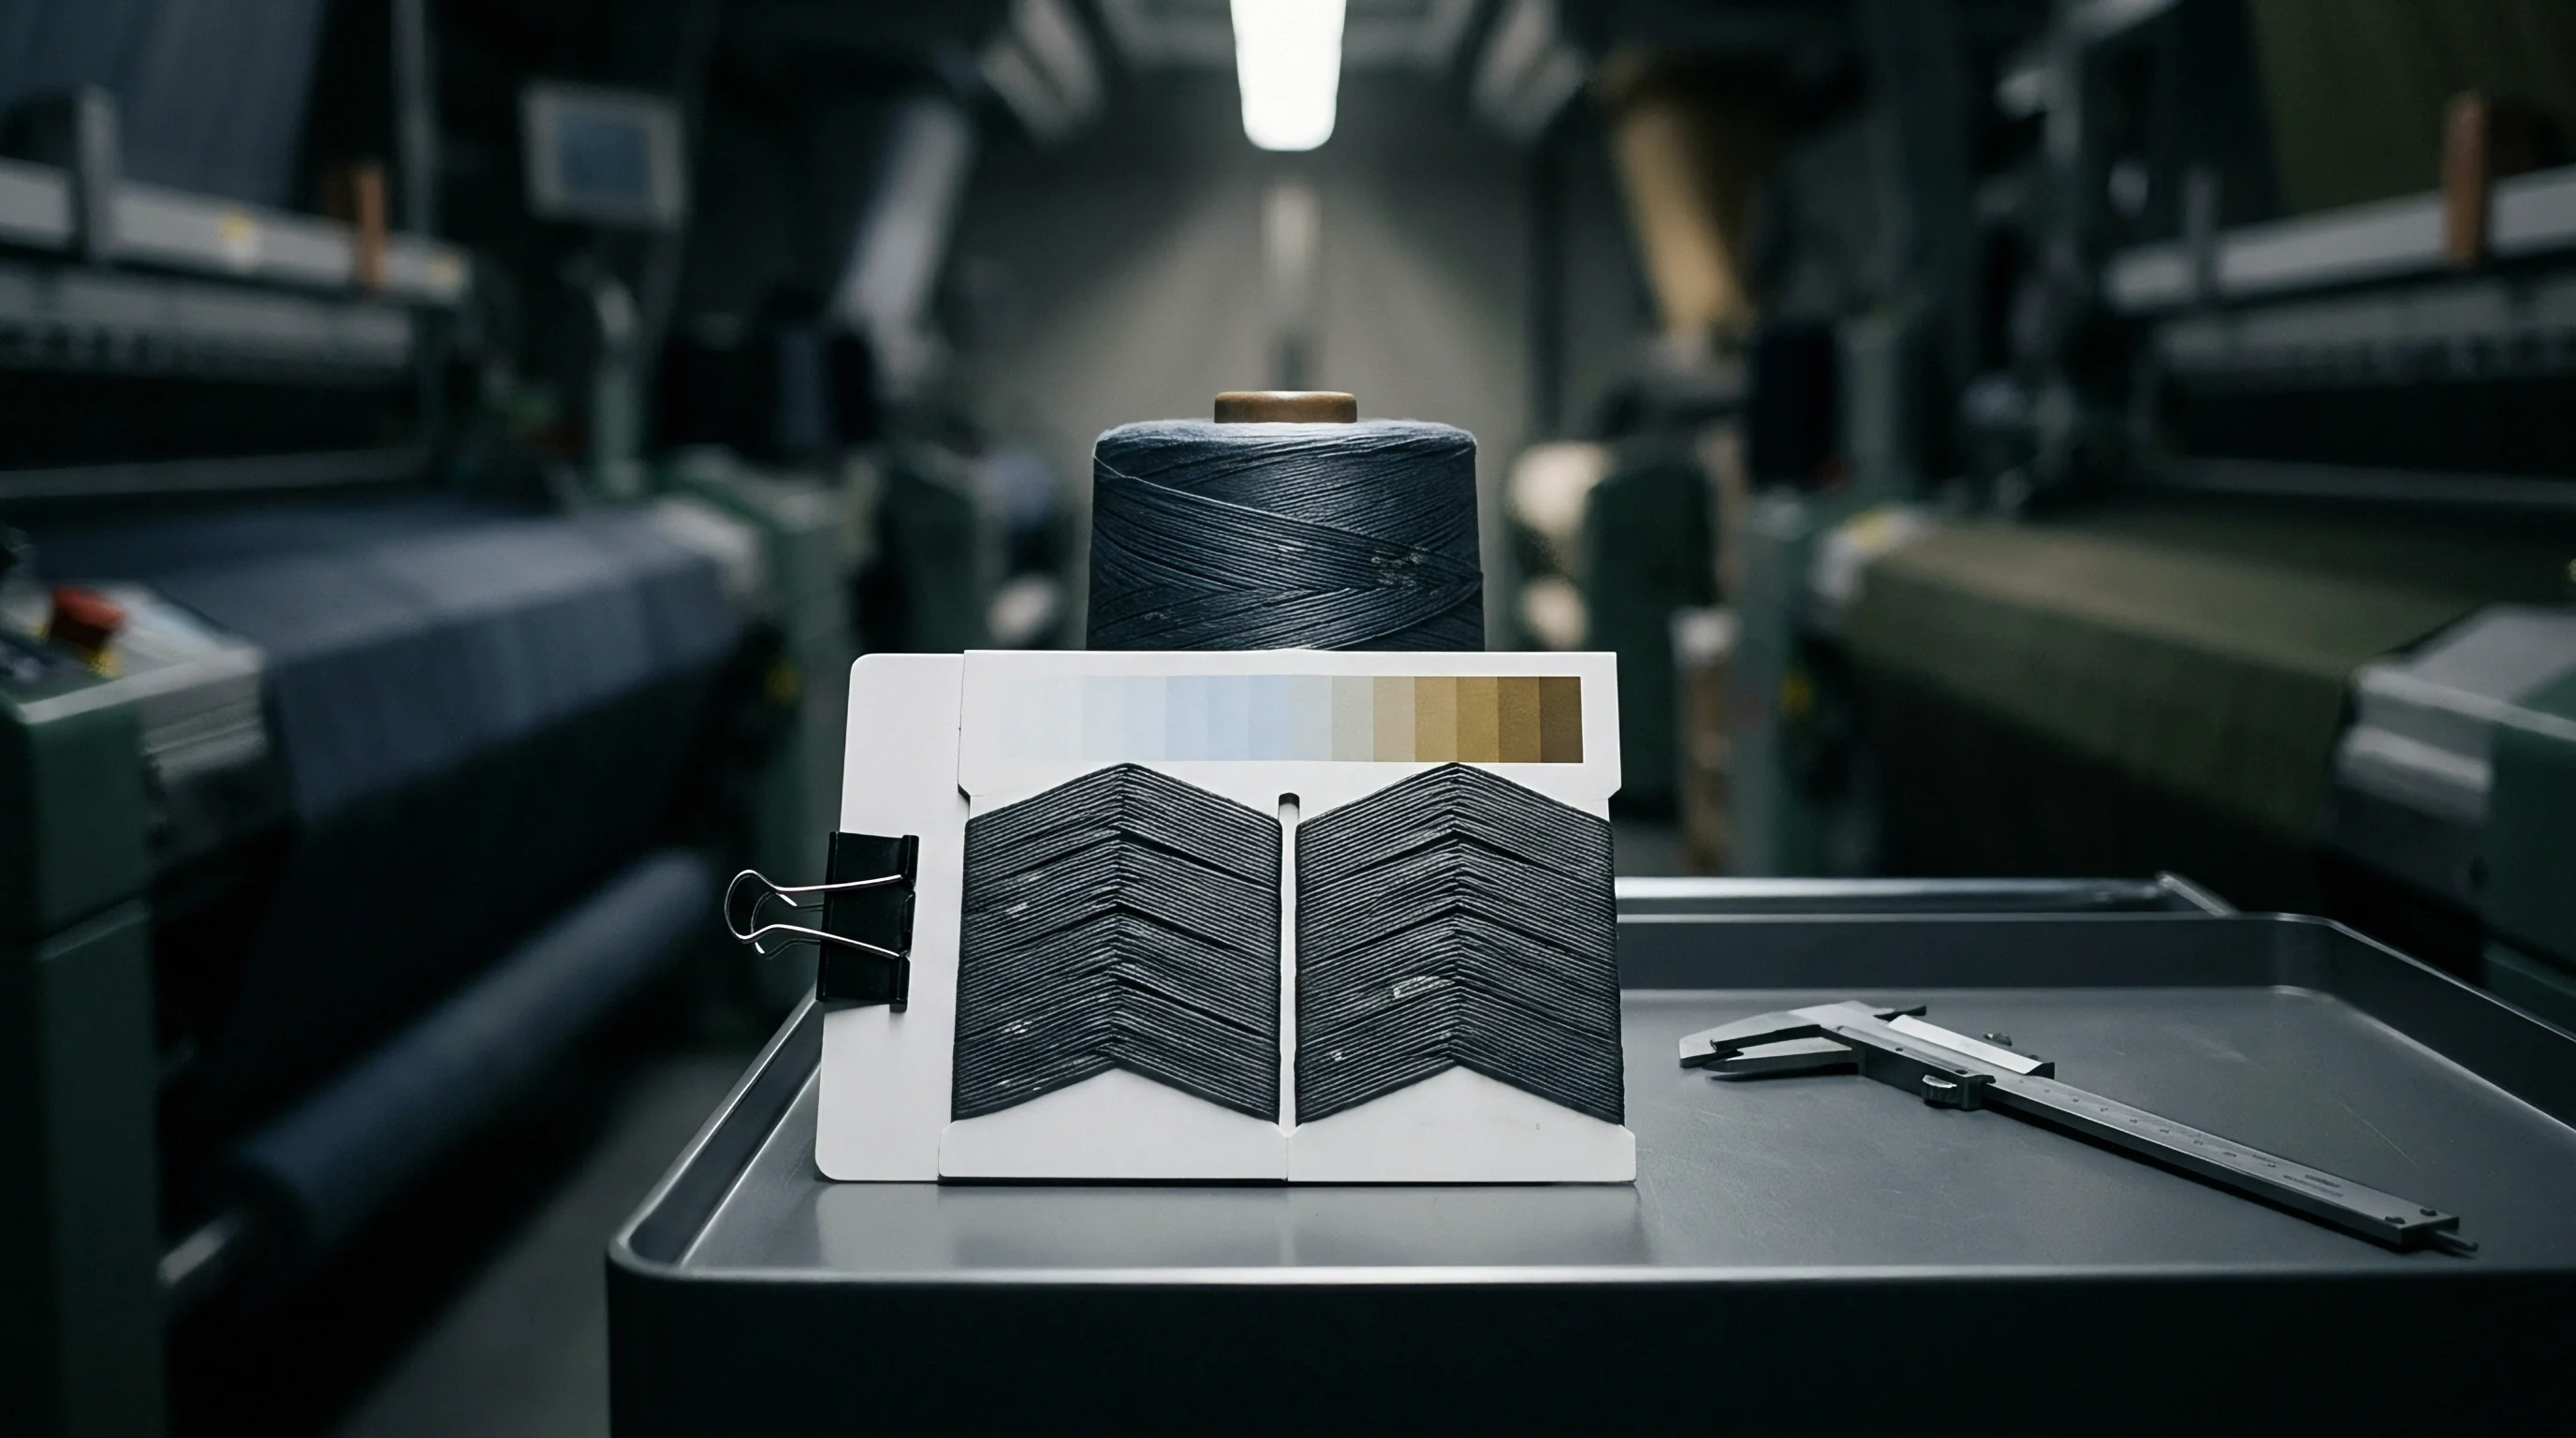
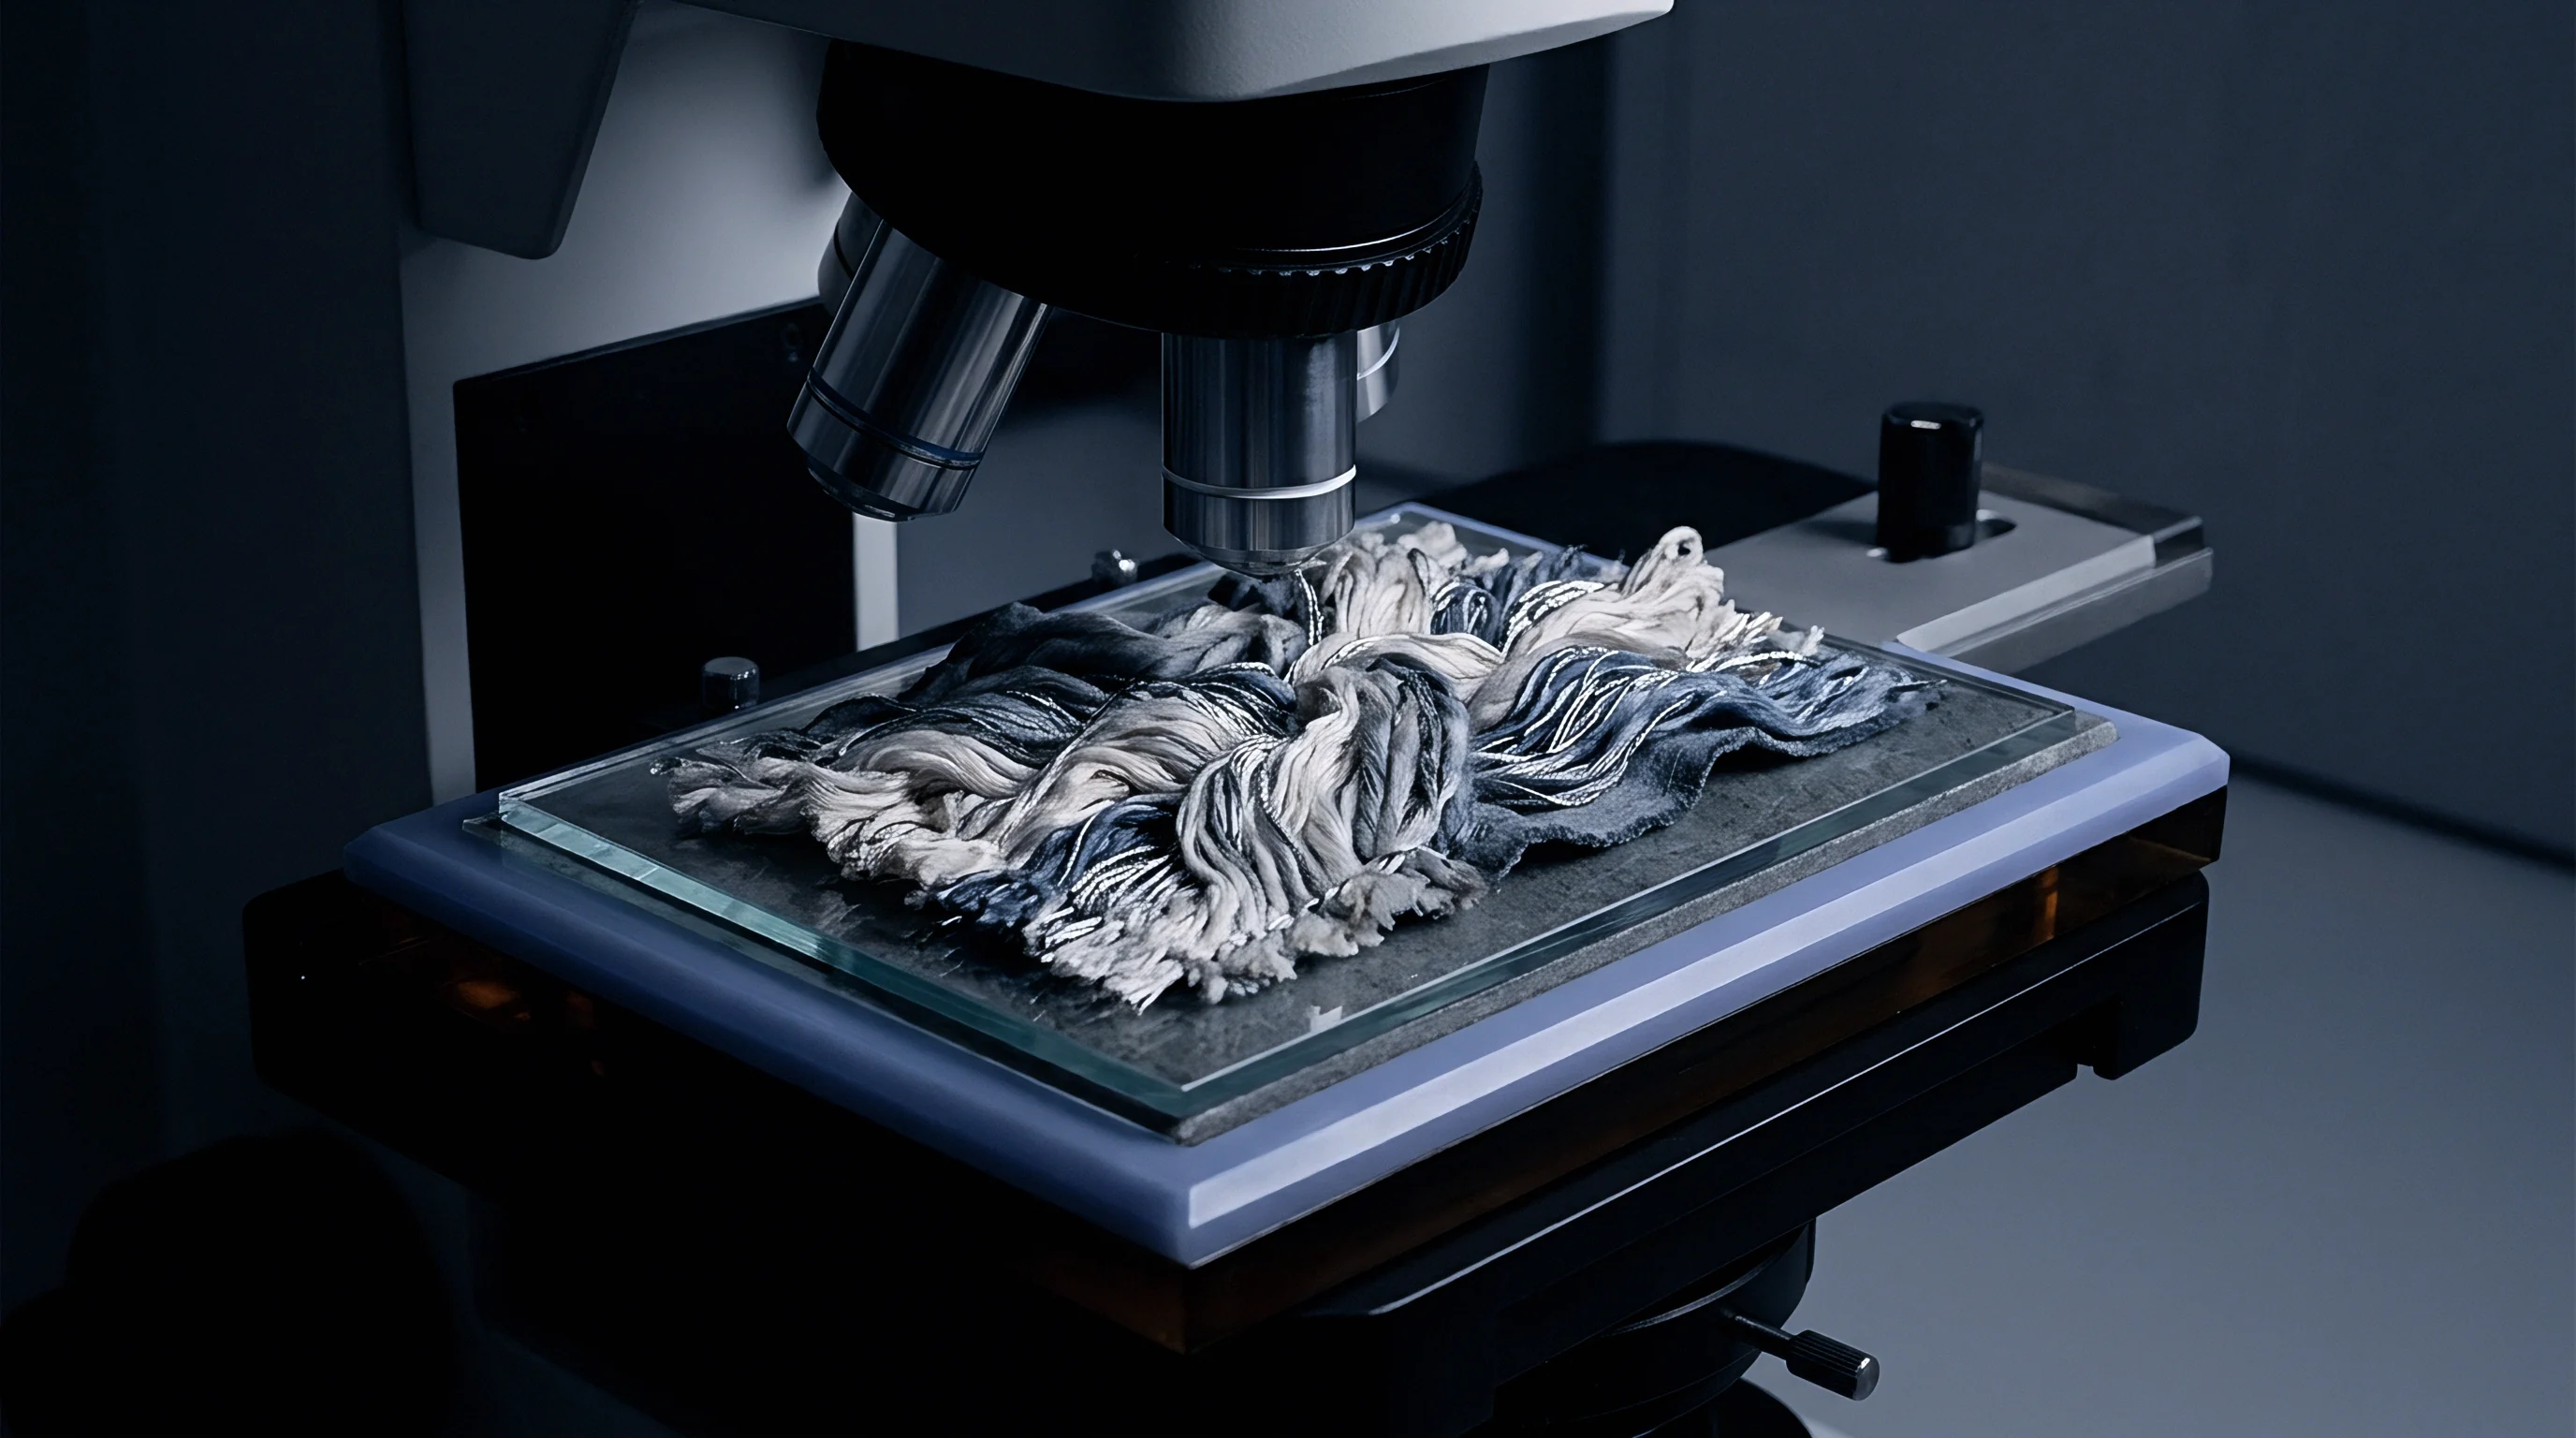
Microscopic differentiation of animal fibres relies on internationally recognized standards. ISO 17751 establishes the accepted procedural guidelines for distinguishing cashmere from sheep wool, yak, and camel hair via scanning electron microscopy and light microscopy. Under secondary electron imaging, genuine cashmere exhibits characteristic surface morphology.
The cuticle scales show an average thickness below 0.55 micrometers. Scale frequency typically ranges between 6 and 8 scales per 100 micrometers of fibre length.
Sheep wool exhibits distinctly thicker cuticular scales, usually measuring above 0.65 micrometers. Wool cuticle edges present a prominent, serrated profile compared to the smooth, mosaic, wrap-around scales characteristic of fine Capra hircus laniger. Scanning electron microscopy operators measure scale thickness at stepped working distances under high magnification, examining hundreds of individual fibres across randomly cut cross-sections.
Physical traits remain continuous across animal populations. Selective breeding in Inner Mongolia, Xinjiang, and Australia has produced super-fine Merino wools with average diameters dipping below 14.5 micrometers. These diameters match or undercut standard raw cashmere grades.
When fine wool fibres undergo mild chemical de-scaling or enzyme treatments, their cuticular margins smooth out. Under an electron beam, these modified wool scales mimic genuine cashmere morphology.
Mechanical Dehairing Distortions and Operator Bias
Mechanical dehairing creates measurable morphological distortions. High-speed carding rollers strip coarse guard hair from the down fibre under aggressive mechanical shear. This physical stress breaks tip ends and strips cuticular scales along fragile shaft segments.
When operators encounter damaged or partially stripped fibres under electron microscopy, classification relies on individual visual judgment.
The human eye introduces systematic error during manual fibre tallying. Standard test methods specify counting between 500 and 1,000 fibres to establish a quantitative blend percentage by mass. The relation between numerical count and mass percentage requires calculating the volume and density of each detected fibre category.
Fiber mass scales with the square of its radius. An operator misclassifying three 19-micrometer wool fibres as cashmere skews the calculated mass distribution far more aggressively than misclassifying five 13-micrometer down fibres. This mathematical reality creates high variance between replicate slides prepared from the same sliver.
Scanning electron microscopy methods maintain an acknowledged statistical uncertainty band. The published inter-laboratory reproducibility tolerance for low-level adulteration under optical and electron microscopy hovers between two and four percentage points. Laboratories reporting ninety-nine percent cashmere frequently capture lots carrying four percent wool contamination due entirely to operator counting boundaries.
Suppliers exploit this morphological gray zone by introducing enzymatically polished fine wool into raw scouring bowls before carding. The modified wool passes standard electron microscopy inspection because its surface scales match cashmere reference templates. Physical inspection methods reach an absolute resolution limit when processing chemistry alters cuticular scale dimensions.


Genomics

Targeted Mitochondrial Loci and Sequence Divergence
Deoxyribonucleic acid barcoding bypasses superficial cuticle morphology by reading the species genome. Analytical protocols sequence short, highly conserved mitochondrial fragments. Cytochrome b and cytochrome c oxidase subunit I serve as standard molecular targets for distinguishing Capra hircus from Ovis aries.
Because cells contain hundreds of mitochondria, mitochondrial assays yield thousands more target templates per milligram of tissue than single-copy nuclear assays.
Polymerase chain reaction primers amplify species-specific single nucleotide polymorphisms located within these mitochondrial genes. Cashmere goat and sheep mitochondrial lineages diverged millions of years ago, providing dozens of stable diagnostic base-pair substitutions. Primers engineered to anneal strictly to goat mitochondrial DNA fail to amplify sheep fragments, enabling high-precision qualitative identification.
| Marker Target | Target Genome | Base Pair Length | Target Specificity | Limit of Detection |
|---|---|---|---|---|
| Cytochrome b | Mitochondrial | 140 to 180 bp | Capra vs Ovis distinction | 0.1 percent mass fraction |
| COI (Barcode Region) | Mitochondrial | 120 to 220 bp | Cross-species verification | 0.5 percent mass fraction |
| 16S Ribosomal RNA | Mitochondrial | 90 to 130 bp | Highly degraded samples | 1.0 percent mass fraction |
| KRTAP Nuclear Genes | Chromosomal | 250 to 400 bp | Phenotypic wool traits | 5.0 percent mass fraction |

Amplification Dynamics and Degradation Discrepancies
Industrial textile finishing alters extracted DNA integrity. Cashmere down undergoes rigorous chemical interventions before entering trade channels. Raw greasy fleece contains dirt, suint, and natural waxes.
Scouring plants wash the fibre in hot aqueous baths containing non-ionic surfactants and sodium carbonate at temperatures exceeding 60 degrees Celsius. Subsequent processing uses harsh oxidizers during hydrogen peroxide bleaching to remove dark pigmentation, followed by high-temperature acid dyeing at pH 3.5 to 4.5.
These industrial treatments break the phosphate backbone of exposed DNA molecules. Hydrolytic depurination and oxidative cleavage shred long genomic strands into tiny fragments below 100 base pairs. When a laboratory attempts to extract DNA from a finished worsted yarn or dyed sweater, molecular recovery drops exponentially.
Real-time quantitative PCR calculates target abundance through cycle threshold values. The cycle threshold marks the amplification cycle where fluorescent signal rises above background noise. Lower template copy numbers require more cycles to reach detection.
If sheep wool components in a blend underwent less chemical damage than the host cashmere, or if sheep wool follicles retained higher nucleated cell fractions, sheep mitochondrial DNA amplifies preferentially relative to the degraded cashmere target.
This dynamic skews quantitative calculations. A blend containing two percent wool by mass can produce amplification signals suggesting ten percent contamination if the cashmere fraction suffered severe hydrolytic cleavage while the adulterating wool remained chemically unstripped. Copy number ratios derived from raw cycle threshold data do not map directly to volumetric mass ratios.
Transboundary herds introduce further natural genomic variation. Domesticated goat populations across the Mongolian plateau, the Tibetan plateau, and Central Asia exhibit localized maternal haplotypes. Primer binding sites harboring unmapped single nucleotide mutations reduce primer annealing efficiency.
When a primer mismatches a regional cashmere haplotype, amplification stalls, artificially inflating the relative percentage of contaminating species.

Chemistry
The commercial extraction of DNA from animal fibres requires breaking the keratin barrier. Keratin proteins form a dense, crystalline cross-linked matrix reinforced by covalent disulfide bridges between cysteine amino acid residues. Standard lysis buffers fail to dissolve this outer cortex without strong chemical reducing agents.
Accredited laboratories deploy proteinase K combined with high concentrations of dithiothreitol to reduce disulfide bonds and release trapped nuclear material. Complete dissolution of the fibre shaft demands prolonged thermal incubation, typically running between 56 and 65 degrees Celsius for sixteen to twenty-four hours. During this digestion phase, trace quantities of co-extracted chemical impurities enter the lysate solution.
Industrial dyes act as potent polymerase chain reaction inhibitors. Metal-complex acid dyes containing chromium or cobalt ions bind directly to the DNA polymerase enzyme, blocking its catalytic activity during amplification cycles. Sulfonated reactive dyes co-purify alongside nucleic acids through silica spin columns, lowering overall reaction efficiencies.
A dark-dyed worsted cashmere yarn carries enough residual chromium to suppress polymerase activity during real-time amplification.
When enzyme inhibition slows the target reaction, cycle threshold curves flatten. Technicians reading inhibited amplification plots face ambiguous baseline determinations. A failed amplification run can conceal genuine sheep adulteration or falsely flag target presence due to late non-specific primer binding.
Organic extraction chemistries introduce their own processing artifacts. Residual phenol or chloroform traces left over from phase separation inhibit Taq polymerase at concentrations as low as 0.5 percent by volume. High-throughput commercial laboratories frequently replace organic phase extraction with magnetic bead separation to standardize recovery.
Magnetic silica beads exhibit variable binding affinities based on DNA fragment length, systematically under-recovering degraded fragments shorter than eighty base pairs.
These biochemical realities explain why pure fibre lots yield wildly inconsistent quantitative molecular readings across different commercial finishing stages. Greasy raw cashmere yields robust DNA with minimal chemical inhibition. Bleached white down tops yield degraded, fragmented DNA.
Dark-dyed stock presents high levels of chemical inhibition. The testing method changes performance profiles across every processing stage.

Drift
Commercial lots travel across long geographic distances before final testing occurs. A raw cashmere consignment bought in Ulaanbaatar moves through scouring in Hebei, dehairing in Ningxia, and spinning in Biella or Hawick. Along this transit route, testing discrepancies between origin and destination laboratories create high legal friction.
The mathematical conversion of fibre counts to commercial mass introduces systematic drift. Scanning electron microscopy reports mass percentages calculated from optical measurements using established mathematical equations. The calculated mass percentage of Cashmere, designated as Mc, derives from the counted fibre numbers, the squares of their individual mean diameters, and their volumetric densities:
Mc = / 100
In this equation, N represents the total fibre count, d represents the mean diameter in micrometers, and ρ represents the fibre density in grams per cubic centimeter. Standard testing protocols assume constant physical densities: 1.30 grams per cubic centimeter for raw cashmere down, and 1.31 grams per cubic centimeter for sheep wool.
Assume an analyst inspects a slide containing 1,000 fibres. The analyst measures 970 cashmere fibres with a mean diameter of 15.2 micrometers, and 30 sheep wool fibres with a mean diameter of 18.5 micrometers. Inserting these values into the standard mass equation yields an exact mass distribution:
Cashmere volume component: 970 (15.2)2 1.30 = 970 231.04 1.30 = 291,348.6
Wool volume component: 30 (18.5)2 1.31 = 30 342.25 1.31 = 13,450.4
Total mass component: 291,348.6 + 13,450.4 = 304,799.0
Calculated cashmere mass percentage: (291,348.6 / 304,799.0) 100 = 95.59 percent.
Under this calculation, thirty wool fibres representing only 3.0 percent of the visual count produce a 4.41 percent wool mass fraction due entirely to the squared diameter term. A subtle shift in the measured diameter of the contaminating fibres moves the commercial mass percentage significantly.
| Wool Count Fraction | Cashmere Mean Micron | Assumed Wool Micron | Calculated Wool Mass | Commercial Declaration Status |
|---|---|---|---|---|
| 2.0 percent (20 / 1000) | 15.0 μm | 16.0 μm | 2.27 percent | Tolerated blending threshold |
| 2.0 percent (20 / 1000) | 15.0 μm | 19.0 μm | 3.17 percent | Borderline rejection boundary |
| 2.0 percent (20 / 1000) | 15.0 μm | 22.0 μm | 4.21 percent | Mandatory customs reclassification |
| 3.0 percent (30 / 1000) | 15.0 μm | 17.0 μm | 3.81 percent | Exceeds FTC pure cashmere rule |
| 3.0 percent (30 / 1000) | 15.0 μm | 21.0 μm | 5.73 percent | Contractual default breach |
Subsampling protocol differences accelerate this variance. Scoured cashmere exhibits high spatial heterogeneity inside the bale. Guard hairs, dander, and foreign fibres settle unevenly across bale cores during mechanical packing.
If origin inspectors pull grab samples strictly from outer bale layers while destination laboratories use pneumatic core boring across twenty distinct points, their subsample composition diverges before chemical testing begins.
International trading houses exploit these analytical spreads. A trader armed with an electron microscopy certificate showing ninety-eight percent pure down ships the container to a jurisdiction where customs authorities rely exclusively on DNA testing. When customs inspectors return an eight percent wool finding via real-time PCR, the trader claims process-induced nucleotide degradation at the destination lab.
The shipment sits on the wharf while legal fees and demurrage surcharges erode commercial margins.
Reconciling this drift requires treating morphological and genomic datasets as complementary checkpoints rather than interchangeable metrics. When DNA analysis returns a high wool copy number, the result flags an authentic biological presence. It does not prove that wool constitutes that exact percentage of the physical lot by mass.
Scanning electron microscopy establishes the physical volumetric mass ratio, provided the operator inspects enough individual fibres to overcome standard Poisson sampling error.

Audit
Core Sampling Protocols across Commercial Consignments
Defensible verification begins in the raw bale warehouse. Reliance on vendor-supplied hand swatches or single-point grab samples guarantees testing discrepancies at destination ports. Technicians draw representative cross-sections using calibrated mechanical equipment under formal chain-of-custody rules.
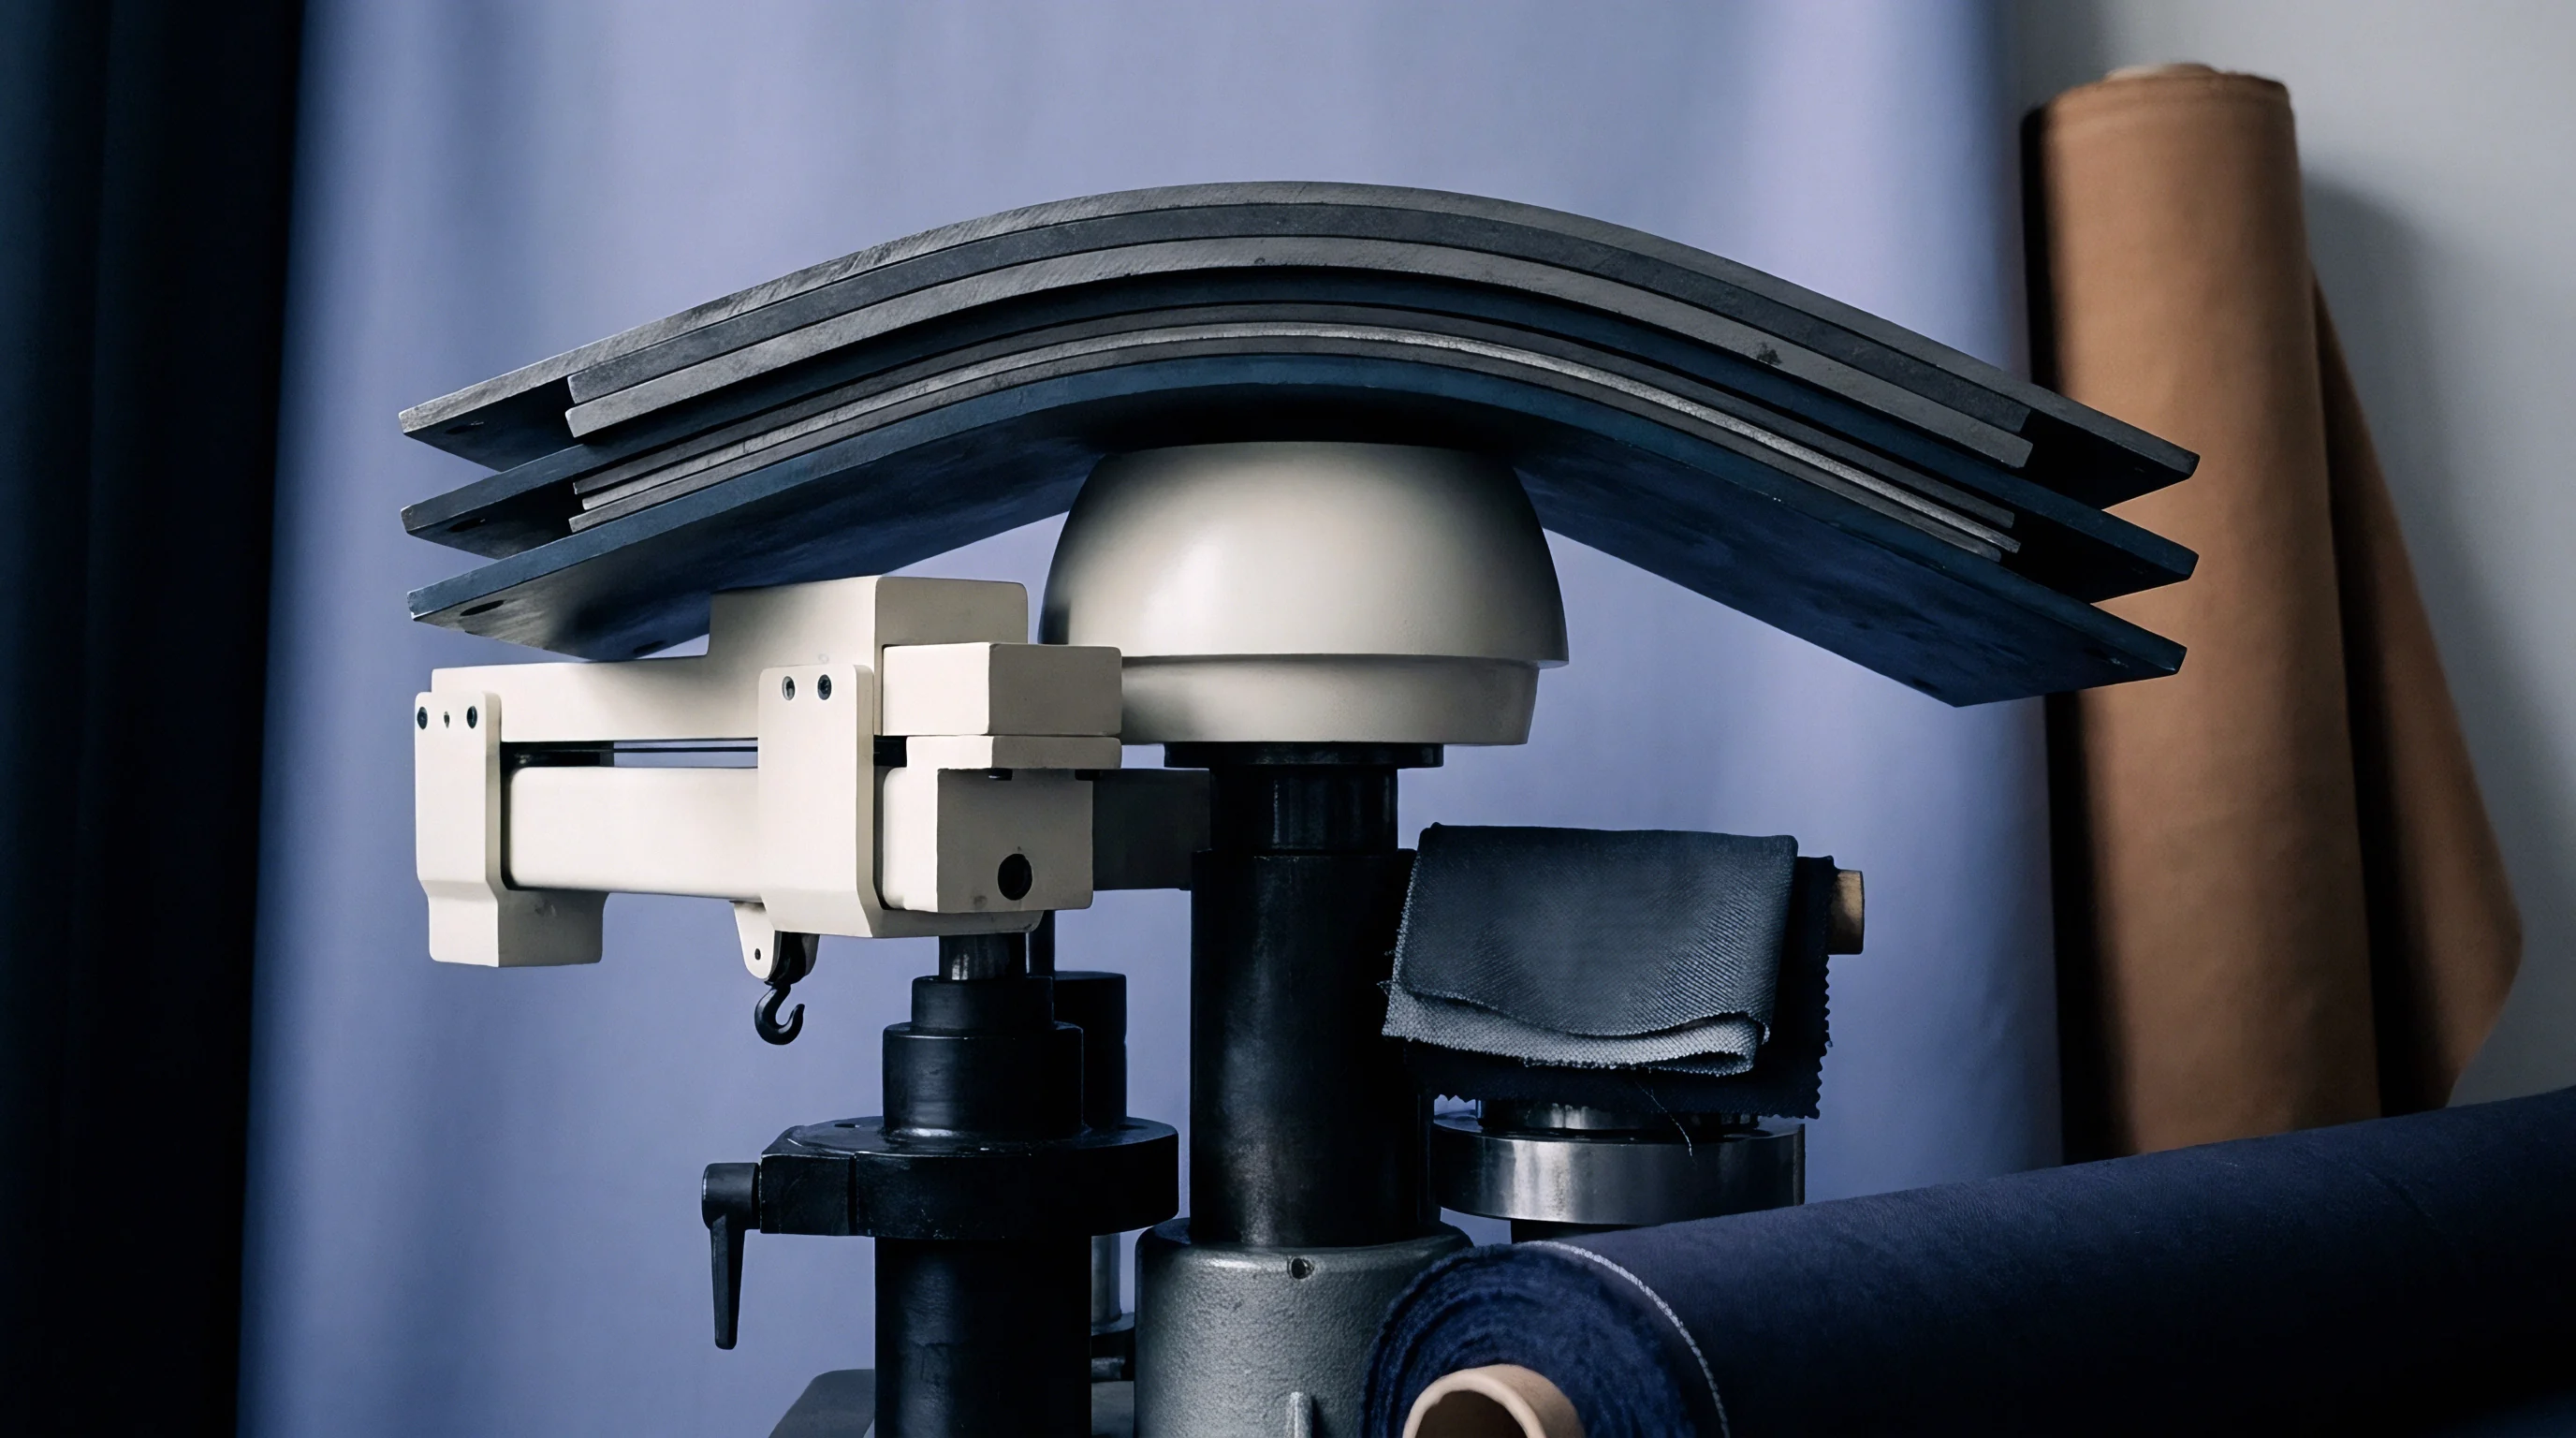
Standard core sampling requires twenty-four core penetrations distributed across a lot according to square-root lot sizing rules. For a consignment of one hundred compressed bales, inspectors select at least ten bales at random. A motor-driven coring tube fitted with a razor-sharp scalloped tip penetrating to a depth of at least fifty centimeters extracts core slivers from each quadrant of the bale.
The tool cuts through layers perpendicular to the compression face, gathering inner down alongside peripheral fleece.
Inspectors combine the extracted core slivers into a composite sample weighing not less than one kilogram. Technicians process this bulk composite through a laboratory mechanical mini-card or rotary blender to achieve uniform fibre dispersion. The blender homogenizes the lot, breaking up localized wool clusters before dividing the sliver into identical subsamples using mechanical zoning methods.
Only thoroughly homogenized slivers yield reproducible results across independent laboratories.

Dual-Track Verification Workflows for High-Value Shipments
High-value cashmere procurement operations enforce an integrated, dual-track testing protocol. Relying on a single test method creates unquantifiable financial exposure. Procurement contracts must mandate that testing laboratories execute both physical and molecular procedures on matched subsamples drawn from the same homogenized core batch.
The dual-track workflow splits each homogenized composite into three hermetically sealed aliquots. The first aliquot undergoes morphological screening via scanning electron microscopy under ISO 17751. The second aliquot heads to an accredited genomics facility for mitochondrial DNA amplification via real-time quantitative PCR.
The third aliquot remains sealed under bonded climate-controlled storage to serve as an arbitration sample in the event of cross-method disputes.
- Mechanical Homogenization ensures that all individual fleece locks, stray coarse hairs, and potential adulterant pockets distribute evenly across the analytical composite batch before subsampling occurs.
- Direct Morphological Screening under scanning electron microscopy evaluates cuticle scale thickness, scale spacing, and fibre diameter distributions across a minimum count of one thousand individual fibres.
- Genomic Marker Detection via real-time quantitative PCR isolates species-specific cytochrome b or COI mitochondrial gene fragments to establish qualitative biological presence or absence.
- Secondary Cross-Validation resolves discrepancies whenever PCR detects foreign DNA above a one percent threshold while electron microscopy reports a nominally pure cashmere profile.
The procedural response to these analytical steps must be unambiguous. When qualitative PCR returns negative for sheep and yak markers, the lot clears molecular inspection. The buyer reviews the scanning electron microscopy report purely to confirm mean fiber diameter, coefficient of variation, and the coarse hair count fraction.
When qualitative PCR detects sheep DNA, the laboratory reviews the cycle threshold values alongside the electron microscopy mass calculations. If electron microscopy indicates a wool content exceeding two percent by mass, the lot fails purity specifications. The buyer rejects the container under standard supply contract non-conformance clauses.
Disputes intensify when PCR indicates sheep DNA amplification while electron microscopy reports less than one percent wool by mass. This pattern indicates one of two conditions: minute, sub-percent trace contamination common in shared dehairing facilities, or the presence of chemically de-scaled fine wool that slipped past the visual microscopy count. Resolving this discrepancy requires testing the sealed arbitration sample through digital droplet PCR or liquid chromatography-tandem mass spectrometry targeting species-specific keratin peptide markers.


Arbitration

Can Analytical Discrepancies Be Legally Settled?
Standard commercial supply contracts fail when testing methods collide. Purchase orders frequently contain vague specifications demanding 100 percent pure cashmere down certified by an accredited laboratory. When the seller submits an ISO 17751 scanning electron microscopy certificate showing purity and the buyer re-tests via quantitative PCR at a national customs port, legal gridlock follows.
The contract contains no contractual mechanism to resolve conflicting analytical methodologies.
Enforceable supply contracts establish clear testing hierarchies before wire transfers clear. Legal teams must draft explicit technical annexes specifying primary, secondary, and arbitral testing methods. The contract must declare which standard holds final legal authority over customs clearance, invoice payment, and rejection rights.
A structured commercial reconciliation hierarchy uses three defined steps:
- Primary Acceptance Method designates accredited scanning electron microscopy under ISO 17751 as the binding baseline for calculating commercial mass percentages and invoice settlement balances.
- Genetic Adulteration Threshold establishes that real-time PCR testing operates solely as a secondary qualitative screen for systematic, deliberate species substitution exceeding contractually tolerated thresholds.
- Independent Arbitral Laboratory assigns a pre-selected third-party testing facility operating under ISO/IEC 17025 accreditation to analyze the bonded composite sample using matrix-assisted laser desorption mass spectrometry.
Tolerances must reflect empirical testing realities. Commercial contracts that allow zero tolerance for foreign DNA invite automatic rejection of genuine lots. Shearing sheds, transport trucks, scouring bowls, and dehairing machinery handle sheep wool alongside cashmere down.
Dust, wool dander, and airborne fiber fragments create trace environmental contamination that sensitive PCR assays flag at fractional cycle thresholds.
Purchasers protect balance sheets by writing an explicit commercial contamination allowance into supply contracts. Defining a tolerance band of up to 1.0 percent accidental contamination by mass provides operational latitude while preserving clear rights of rejection against systematic commercial adulteration.
| Electron Microscopy (ISO 17751) | Quantitative PCR (Mtdna) | Lot Classification | Commercial Action |
|---|---|---|---|
| > 99.0 percent Cashmere | Negative (No Amplification) | Fully Compliant | Full payment cleared, goods accepted |
| > 99.0 percent Cashmere | Positive (Ct > 32 cycles) | Trace Environmental Cross-Contact | Accepted under standard tolerance rules |
| > 99.0 percent Cashmere | Positive (Ct < 26 cycles) | Suspected De-scaled Wool Adulteration | Freeze payment, dispatch arbitration sample |
| 95.0 to 98.9 percent Cashmere | Positive (Ct < 26 cycles) | Definite Commercial Adulteration | Immediate rejection, supplier absorbs demurrage |
| < 95.0 percent Cashmere | Negative (Inhibited Run) | Method Failure / Severe Bleaching | Halt release, re-test using mass spectrometry |
Customs tariff declarations demand equal contractual rigor. Under international Harmonized System nomenclature, consignments classified under subheading 5102.11 enter as fine animal hair, commanding preferential duty rates or specific quota allocations compared to carded wool under heading 5105. When customs authorities reclassify a container from fine cashmere to blended wool based on molecular tests, duty rates escalate, and import penalties apply.
Importers mitigate misdeclaration risks by including defensive tariff clauses in overseas purchase agreements. The contract must mandate that the seller provide complete batch scouring records, chemical treatment logs, and accredited morphological testing files before the vessel departs origin ports. If customs testing reclassifies the goods based on foreign DNA findings, the seller assumes direct liability for landed duty differentials and bonded storage charges.
The contract line states: Laboratory determinations of fiber composition performed under ISO 17751 scanning electron microscopy govern commercial settlement, unless qualitative genomic amplification reveals non-caprine mitochondrial sequences at cycle threshold values below 28.0, at which point matrix-assisted laser desorption peptide mass fingerprinting shall serve as the final, binding arbitral authority.