Standardizing Spectroscopic Subtraction Scaling Factors in Fiber Analysis
Standardizing spectroscopic subtraction scaling factors requires constrained non-negative minimization to prevent false fiber declarations and tariff penalties.


Matrix
A commercial declaration certifying ninety-five percent recycled polyethylene terephthalate and five percent elastane faces immediate rejection when infrared absorption bands overlap across the 1720 inverse centimeter carbonyl region. Customs authorities in target ports pull swatches directly from container centers, running attenuated total reflection Fourier transform infrared spectroscopy to verify composition before granting entry. The laboratory operator subtracts the polyester reference spectrum from the composite yarn trace to isolate the polyurethane cross-linker.
When that operator nudges the subtraction scaling factor manually until the composite spectrum looks clean to the eye, the elastane concentration swings between two percent and eight percent on the final test certificate.
The mathematical operation underlying spectroscopic subtraction appears elementary: an analytical software routine takes a composite absorption spectrum and deducts a scaled reference spectrum across a common wavenumber array. Fiber analysis complicates this calculation through severe optical scattering, additive finishes, spin finishes, and phase variations within extruded polymers. Pure components rarely exist unplasticized.
The resulting baseline distortions and band shifts render uncalibrated subtractions commercially volatile.
Baseline correction preceding spectral subtraction stabilizes the zero line only when anchor points sit entirely outside the envelope of secondary finish absorptions.
Standardizing the scaling factor removes human discretion from composite identification. When an automated algorithm computes the scaling multiplier through target spectral windows rather than full-spectrum visual evaluation, analytical reproducibility moves into legal tolerance bands. The standardizing step protects mill test dossiers from immediate disqualification during brand quality audits.
Commercial failure modes emerge directly from subjective scaling decisions across testing laboratories:
- False negative elastane identification occurs when an excessive subtraction factor wipes out the weak amide II absorption band near 1530 inverse centimeters, causing customs inspectors to seize goods under misdeclaration penalties.
- Overestimated recycled nylon fractions arise when baseline tilt from carbon black pigments forces an operator to overscale virgin polyamide reference traces, falsely inflating residual additive absorption peaks.
- Topical finish misattribution develops when spin finish ester oils absorb along the ester carbonyl vibration of polyester substrates, creating phantom coating readings if the scaling coefficient relies on peak height rather than integrated peak area.
- Cellulosic bicomponent miscalculation takes place during lyocell and viscose ratio checks where slight crystalline polymorphism alters hydroxyl stretch profiles between 3300 and 3400 inverse centimeters.
The detector records net transmission. When an analyst scales reference spectra by eyeball to eliminate negative peaks, mathematical distortion enters the analytical record. The subtraction factor governs whether an expensive specialty fiber exists on paper or vanishes into background noise.
Operator bias increases as fiber diameter decreases.

Crystal
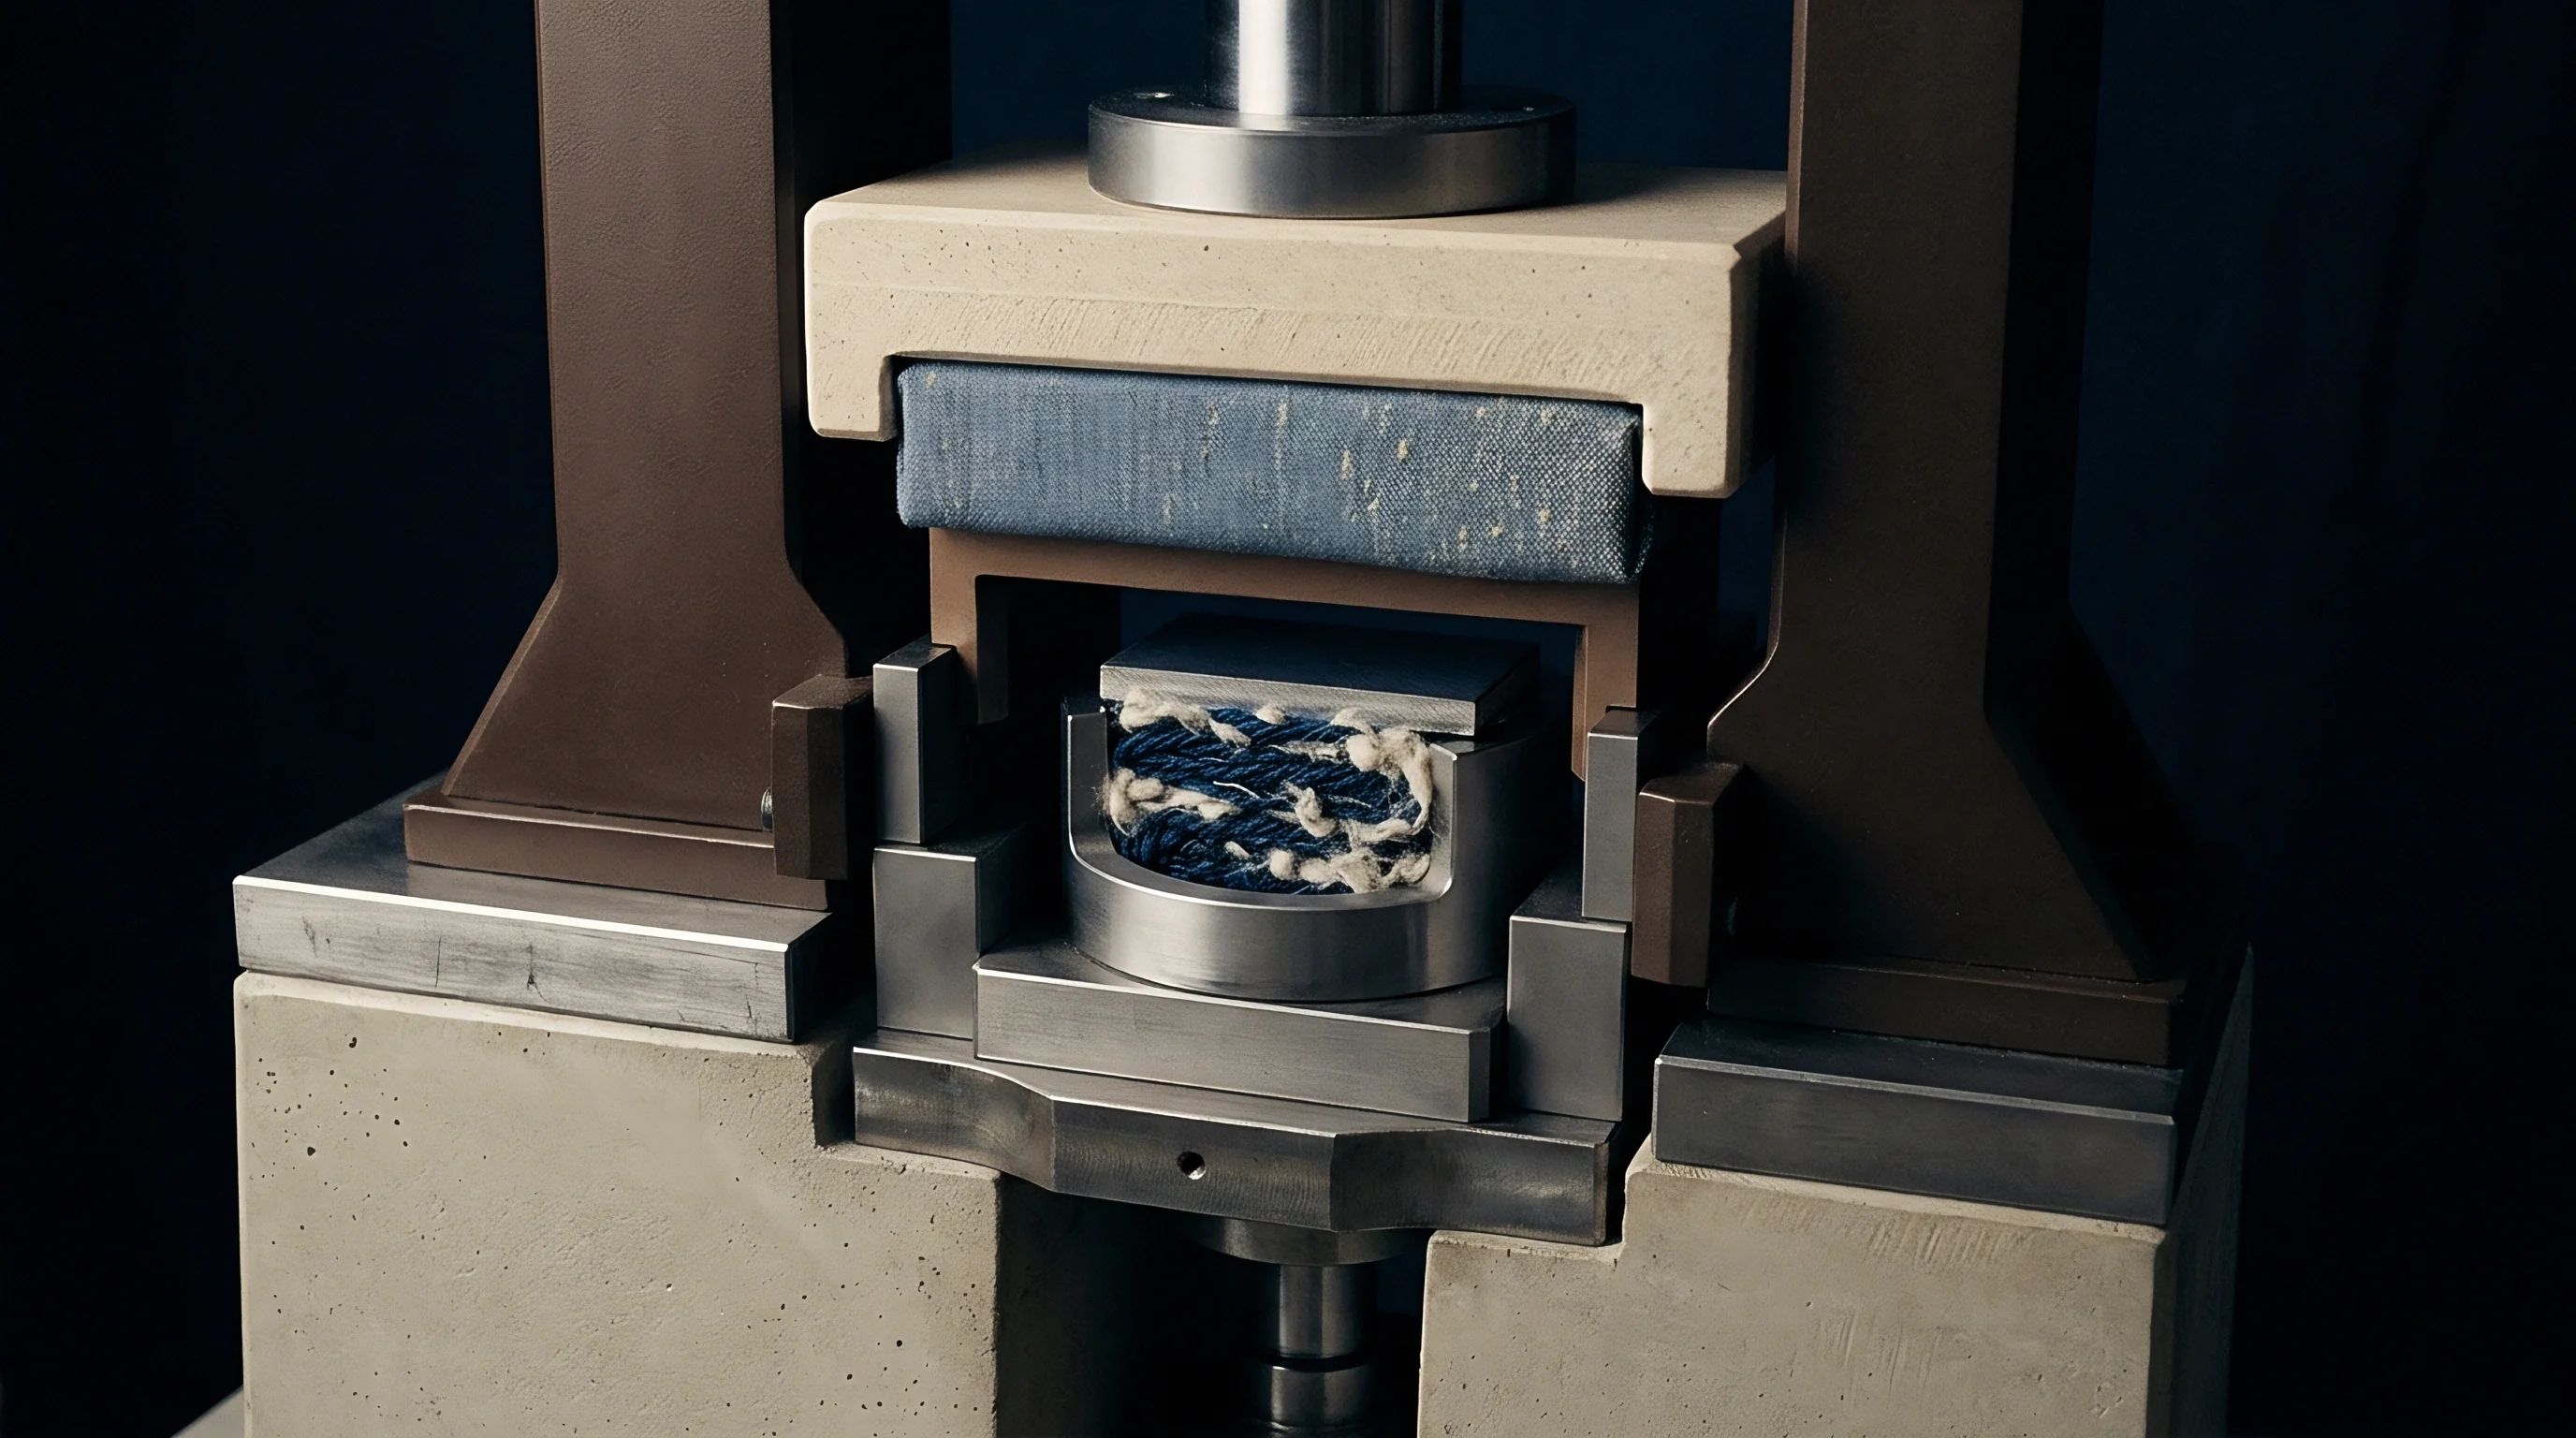
Internal reflection elements dictate the true penetration of infrared light into oriented synthetic filaments and natural fiber lumens. An attenuated total reflection element pressed against a drawn yarn does not interrogate bulk volume evenly. Evanescent wave decay restricts the sampling zone to a shallow surface horizon governed by the refractive indices of both the optic and the specimen.
The effective depth of penetration changes across the infrared spectrum in direct proportion to wavelength. Longer wavelengths penetrate deeper into the fiber sheath than shorter wavelengths. A subtraction factor calibrated against a high-frequency carbon-hydrogen stretch at 2920 inverse centimeters systematically miscalculates absorption bands located within the fingerprint region below 1200 inverse centimeters.
Germanium elements at a forty-five degree angle of incidence limit evanescent penetration to 0.65 micrometers at 1000 inverse centimeters on drawn polyester filaments.
Contact pressure alters peak ratios. Synthetic filaments possess anisotropic molecular alignments induced by mechanical draw stages during extrusion. Compressing a rigid polyamide filament against a diamond optic flattens the cylindrical boundary unevenly, creating refractive index gradients across the contact spot that alter relative band intensities.

Does Optical Dispersion Invalidate Linear Subtraction?
Optical dispersion drives severe derivative-like distortions into subtracted spectral profiles whenever a high-refractive-index polymer interacts with a low-index internal reflection element. Near intense absorption bands, the refractive index of the fiber undergoes anomalous dispersion, shifting sharply across a narrow wavenumber interval. This rapid variation alters the reflection coefficient at the interface, generating asymmetric, distorted peak profiles that linear subtraction factors cannot resolve without prior dispersion correction.
Signals distort across absorption bands. Diamond and zinc selenide elements share a refractive index near 2.4, making them vulnerable to dispersion artifacts when testing high-tenacity fibers loaded with titanium dioxide delusterants. Germanium, carrying a refractive index of 4.0, suppresses anomalous dispersion swings by maintaining a large optical contrast against the organic fiber core.
| Fiber Classification | Mean Refractive Index | Penetration at 3000 cm⁻¹ (μm) | Penetration at 1700 cm⁻¹ (μm) | Penetration at 1000 cm⁻¹ (μm) |
|---|---|---|---|---|
| Polyethylene Terephthalate | 1.58 | 0.89 | 1.57 | 2.67 |
| Polyamide 6,6 | 1.53 | 0.83 | 1.47 | 2.50 |
| Polyacrylonitrile | 1.52 | 0.82 | 1.45 | 2.47 |
| Natural Cellulose Cotton | 1.54 | 0.84 | 1.49 | 2.53 |
| Segmented Polyurethane Elastane | 1.51 | 0.81 | 1.43 | 2.44 |
Fiber boundaries scatter incident radiation. When testing rough spun yarn bundles, air gaps between adjacent filaments produce baseline offsets that masquerade as concentration variances. Analysts attempting to compensate for contact loss often dial the subtraction scaling multiplier upward, which carves artificial negative valleys into primary polymer absorption profiles.
The dyehouse manager stated that uneven infrared readings reflected normal dye lot variation rather than uncalibrated pressure against the diamond anvil.


Minima
Algorithmic calculation of the subtraction factor replaces subjective visual scaling with constrained numerical optimization across isolated spectral zones. The linear combination model assumes the measured composite absorbance represents the direct sum of individual component absorptions scaled by path length and fractional volume. Because absolute sample path length fluctuates under variable anvil clamping forces, standardized subtraction solves for a coefficient that drives residual spectral noise toward an objective minimum.
The calculation breaks here without proper boundary limits. Unconstrained optimization algorithms frequently yield physically impossible negative absorbance values in regions where neither polymer absorbs. Standardized protocols restrict the subtraction factor through non-negative least squares routines operating strictly over diagnostic wavenumber intervals rather than across the raw 4000 to 400 inverse centimeter span.
Consider a constructed laboratory analysis of an intimate bicomponent yarn containing polyester and cotton. The analyst isolates the secondary cellulosic component by deducting a standardized polyethylene terephthalate reference trace. The primary polyester diagnostic band sits at 1715 inverse centimeters, reflecting the ester carbonyl stretch, while cellulose features a broad glucose ring vibration centered near 1030 inverse centimeters.

Algorithmic Formulations for Factor Determination
Mathematical standardization relies on three distinct computational routines to extract the scaling coefficient:
The point-ratio routine divides composite absorbance by reference absorbance at a single wavenumber where only the reference component demonstrates optical activity. This approach runs fast but transfers instrument noise directly into the calculated multiplier. A transient detector spike at the chosen wavenumber distorts the resulting subtraction across the entire spectrum.
Vector normalization across a defined diagnostic window scales both composite and reference spectra to unit length prior to least-squares subtraction. This method neutralizes differences in raw contact pressure against the sampling crystal. It stabilizes the calculation against overall baseline elevation caused by particulate yarn contamination or dark acid dyes.
Second-derivative zero-crossing alignment calculates the second derivative of both spectra to eliminate linear baseline drift before optimization. The algorithm minimizes the residual sum of squares of the second-derivative trace exclusively within the reference polymer diagnostic envelope. This process locks the scaling factor to true molecular vibrational modes rather than broad baseline tilts.
| Mathematical Method | Target Spectral Window (cm⁻¹) | Processing Speed | Baseline Sensitivity | Standard Deviation (k) |
|---|---|---|---|---|
| Single Point Ratio | 1715 Fixed | Instantaneous | Severe | ±0.082 |
| Constrained Non-Negative Least Squares | 1780 to 1680 | Moderate | Low | ±0.014 |
| Vector Normalized Residual Minima | 1800 to 1650 | Moderate | Negligible | ±0.009 |
| Second Derivative Least Squares | 1760 to 1700 | High Computational Load | Zero | ±0.005 |
| Data generated across twenty repetitive mountings of an intimate drawn yarn mixture under eighty Newtons clamping force. | ||||
Solvent extraction strips topical lubricants. Before applying mathematical minima algorithms, the analytical sequence removes commercial spin finishes with petroleum ether or dichloromethane. Silicone fluids and ethoxylated fatty acids present in coning oils generate aliphatic C-H absorptions between 2850 and 2960 inverse centimeters.
These surface oils alter the composite area ratios, which pushes automated optimization routines toward an artificially depressed reference factor.
A second mathematical constraint involves enforcing non-negativity across the entire residual spectrum. If the subtraction coefficient generates an inverted peak exceeding three times the baseline root-mean-square noise floor in any reference-free window, the algorithm flags the operation for parameter recalculation. This guard rail halts the creation of phantom peaks that auditors frequently mistake for hazardous chemical residues or unlisted co-polymers.
The standardized subtraction coefficient derived from non-negative minimization feeds directly into quantitative calibration curves. When plotting the standardized scaling coefficient against known gravimetric standards prepared under standard textile conditioning atmospheres of sixty-five percent relative humidity and twenty degrees Celsius, the resulting correlation coefficient regularly surpasses 0.998. The numerical residual remaining after automated subtraction isolates trace components with sufficient clarity for automated library searches against certified spectral databases.


Bench
Testing laboratories operate under strict international analytical procedures that define when spectroscopic subtraction replaces wet chemical dissolution. ASTM E168 outlines quantitative infrared procedures, establishing baseline criteria and pathlength corrections for transmission and internal reflection modes. ISO 1833 details chemical dissolution routines for fiber mixtures, serving as the legal reference arbiter when spectroscopic quantification triggers commercial disputes.
Chemical stripping destroys delicate fractions. Dissolving a polyamide sheath with formic acid to isolate an elastane core frequently degrades polyurethane chains or leaves insoluble oligomers that distort final mass calculations. Automated infrared subtraction provides a non-destructive alternative, preserving physical fiber morphology for subsequent scanning electron microscopy or tensile verification.
ASTM E1252 mandates that spectral subtraction routines record the exact mathematical algorithm, baseline points, and subtraction factor directly within the analytical dossier.
Accredited laboratories working under ISO/IEC 17025 must demonstrate that their subtraction algorithms achieve quantitative reproducibility across different instrument benches. Transferring a standardized subtraction factor from a benchtop Fourier transform spectrometer equipped with a deuterated triglycine sulfate detector to a portable unit utilizing a thermoelectrically cooled mercury-cadmium-telluride sensor creates calibration errors unless resolution parameters and apodization functions match precisely.
What Resolves Binary Mixture Spectral Overlap?
Resolving severe spectral overlap between polymers with similar chemical structures demands secondary chemometric routines operating alongside baseline subtraction. In intimate assemblies of nylon 6 and nylon 6,6, both polymers share identical amide I and amide II vibrational frequencies. Standard subtraction cannot separate these materials through simple peak deletion.
The laboratory resolves this challenge by executing a sequence of standardized operational stages:
- Dry the yarn specimen to constant mass at one hundred five degrees Celsius to eliminate absorbed moisture bands at 3300 and 1640 inverse centimeters.
- Extract surface finishes and spin lubricants using Soxhlet extraction with analytical grade petroleum ether for four hours followed by ambient desiccation.
- Acquire one hundred twenty-eight interferograms at four inverse centimeter resolution under controlled eighty Newton clamping force on a monolithic diamond internal reflection element.
- Apply advanced phase correction and Norton-Beer medium apodization to ensure sharp band definition without sidelobe ringing artifacts.
- Execute vector normalization over the fingerprint envelope between 1500 and 900 inverse centimeters against a gold mirror reference background.
- Compute the subtraction coefficient using non-negative least squares restricted to the crystalline-sensitive 935 inverse centimeter band of the reference nylon.
Commercial tolerances permit no ambiguity. When laboratories follow disparate calibration routines, inter-laboratory round-robin studies show quantitative variations exceeding twelve percent on identical fiber lots. This spread invalidates testing certificates presented for customs clearance in high-tariff jurisdictions.
Whether secondary deconvolution techniques can completely replace physical chemical separation across complex ternary fiber assemblies without introducing unquantifiable baseline noise remains unsettled across international standards committees.

Customs
Tariff classifications turn on percentages. International customs schedules separate pure synthetic textiles from mixed fiber goods, attaching divergent duty rates based on small composition differences. A woven fabric containing eighty-five percent or more synthetic filament by weight clears under specific Harmonized System tariff codes, while goods falling below that threshold attract elevated tariffs or trigger restrictive trade quotas.
The penalty falls on importers. Under United States Federal Trade Commission regulations and European Union Textile Regulation 1007/2011, textile goods must carry composition labels accurate to within three percent of actual dry fiber mass. When an unstandardized spectroscopic subtraction miscalculates an elastane or specialty fiber fraction by four percent, the shipment violates federal truth-in-advertising laws, exposing the importer of record to border seizures, mandatory relabeling, and punitive civil fines.
| Declared Composition | Statutory Tolerance | Analytical Drift from Manual Subtraction | Customs Classification Consequence |
|---|---|---|---|
| 100% Recycled Polyethylene Terephthalate | 0% Allowance for Undeclared Fibers | +1.8% Phantom Polyurethane Residue | Immediate Border Rejection and Relabeling Order |
| 85% Cotton / 15% Polyester | ±3.0% Commercial Allowance | ±4.2% Variance on 1030 cm⁻¹ Band | Reclassification from Cotton-Dominant to Mixed Tariff |
| 92% Polyamide 6,6 / 8% Elastane | ±3.0% Commercial Allowance | -3.5% Loss of Amide II Band Area | Duty Differential Assessment and Penalty Audit |
| 60% Lyocell / 40% Viscose | ±3.0% Blended Tolerance | ±5.1% Shift from Crystalline Overlap | Revocation of Specialty Cellulosic Tariff Concession |
Every commercial supply agreement requires concrete analytical parameters written into purchase orders. Importers avoiding costly tariff disputes mandate that suppliers submit testing dossiers containing raw spectra, derivative processing curves, and explicit algorithmic subtraction coefficients generated by accredited third-party laboratories. An unverified certificate of analysis stating fiber composition without instrument parameters offers zero legal shelter during a formal customs audit.
Customs inspectors reject manual adjustments. Border testing facilities run automated spectral deconvolution software that flags irregular negative peaks and distorted baselines instantly. When an importer submits a laboratory report derived from subjective visual subtraction to counter a customs laboratory seizure, the regulatory authority dismisses the private dossier as unstandardized, maintaining the trade suspension until full chemical dissolution testing completes at the importer expense.
Miscalculating fiber composition through arbitrary spectral manipulation leads directly to shipment forfeiture, revised backward tariff assessments across prior entries, and cancellation of brand import privileges across destination markets.