Statistical Operating Characteristic Curves for Composite Chemical Testing in Textiles
Composite testing dilutes chemical contaminants; operating characteristic curves map true detection probabilities against regulatory action limits.


Aliquot

Composite Mechanics under Strict Regulatory Limits
Analytical laboratories serving international apparel brands frequently composite physical textile specimens to control chemical testing overhead. Combining three individual swatches into a single solvent extraction cuts bench runs by two thirds. This cost containment changes the statistical mechanics of the test report.
When three fabric specimens combine into one composite run, an individual specimen carrying a high concentration of an outlawed chemical is diluted by the two compliant specimens alongside it.
Regulatory authorities and major certification frameworks set statutory thresholds on a per-material basis. Under Annex XVII of the European REACH Regulation, entry 43 sets the maximum allowable limit for carcinogenic aromatic amines derived from azo colorants at 30 milligrams per kilogram in any individual dyed component. Under the Consumer Product Safety Improvement Act, the allowable limit for total lead in accessible textile substrates stands at 100 milligrams per kilogram.
When an analytical instrument measures an extract from a three-to-one composite, an observed concentration of 12 milligrams per kilogram of 4-aminobiphenyl passes the 30 milligram per kilogram threshold on the face of the testing report. That composite result conceals a single specimen containing 36 milligrams per kilogram alongside two clean swatches yielding zero. The composite run returns a false-compliant result for the lot.
A composite concentration of ten milligrams per kilogram hides an individual sub-sample carrying thirty milligrams per kilogram when two companions carry zero.
Mitigating this dilution effect forces testing laboratories to adopt adjusted action thresholds, often called composite reporting limits or internal screening action levels. For a composite size of k units, the laboratory flags any composite showing an analyte concentration above the statutory threshold divided by k. In a three-to-one composite under the European Union REACH azo amine restriction, the laboratory triggers an unbundling protocol and individual specimen re-testing whenever the composite concentration reaches 10 milligrams per kilogram.
Lowering this screening cut-off prevents dilution-induced consumer risk. It simultaneously shifts false-positive burdens back onto the dyer when laboratory measurement variance clusters near the analytical limit of quantitation.
The statistical operating characteristic curve describes the mathematical performance of this physical sampling rule. An operating characteristic curve plots the probability of lot acceptance across a spectrum of incoming lot defect rates or underlying chemical contaminant concentrations. For single-specimen testing, the curve follows classical hypergeometric or binomial distributions driven solely by the sample count and the analytical test variance.
For composite chemical testing, the operating characteristic curve integrates sample selection probability, physical mass compositing dilution, and the secondary unbundling decision tree into a multi-tiered mathematical function. Buyers relying on composite test certificates without modeling this operating characteristic curve miscalculate their regulatory liability at import customs.
Contractual agreements specifying raw lot release upon clean composite test results transfer latent regulatory exposure entirely to the importer of record.


Geometry

Mathematical Derivation of the Operating Curve
Evaluating an incoming batch of dyed fabric rolls involves acceptance sampling parameters that reflect both physical chemistry and binomial probabilities. Let N represent total discrete rolls in an inspection lot. From this batch, an inspector draws n independent sample specimens.
The laboratory groups these n specimens into m composite samples, each containing exactly k distinct sub-specimens, such that the total sample size n equals m multiplied by k. Let p represent the true, unobserved proportion of rolls in the batch that carry a chemical concentration exceeding the legal limit L.
The primary acceptance variable depends on whether a composite yields a detected signal above the modified action threshold, defined as L divided by k. In a single-stage composite sampling plan without secondary testing, the entire lot faces rejection if any composite sample shows a concentration exceeding this threshold. Assuming lot size N is substantially larger than sample size n, the probability Y of an individual composite containing zero non-compliant specimens follows the binomial expansion:
Y = (1 – p)k
The overall probability of lot acceptance, denoted as P_a, represents the probability that all m composite samples test clean:
P_a = m = m = (1 – p)n
The gross sample size n dictates batch clearance probability when testing identifies contamination down to an infinitely sensitive detection threshold. Chemical testing operates under real-world instrument limits where chromatography systems exhibit analytical variability, matrix suppression, and finite limits of quantification. The operating characteristic curve departs from the ideal binomial equation as analyte concentrations approach baseline noise.
| Defect Fraction (p) | Individual Runs (n=12, k=1) | Composite (m=4, k=3, n=12) | Composite (m=2, k=6, n=12) | Screening Composite (m=6, k=2, n=12) |
|---|---|---|---|---|
| 0.01 | 0.8864 | 0.8864 | 0.8864 | 0.8864 |
| 0.02 | 0.7847 | 0.7847 | 0.7847 | 0.7847 |
| 0.05 | 0.5404 | 0.5404 | 0.5404 | 0.5404 |
| 0.10 | 0.2824 | 0.2824 | 0.2824 | 0.2824 |
| 0.15 | 0.1422 | 0.1422 | 0.1422 | 0.1422 |
| 0.20 | 0.0687 | 0.0687 | 0.0687 | 0.0687 |
| 0.30 | 0.0138 | 0.0138 | 0.0138 | 0.0138 |
Identical sample sizes produce identical mathematical acceptance curves under idealized assumptions. This symmetry breaks down when analytical measurement error enters the calculation. In gas chromatography with mass spectrometry analysis under EN 14362-1, testing variability exhibits a relative standard deviation between 10 and 25 percent depending on textile substrate complexity.
Let C_i denote the actual concentration of an analyte in specimen i. The measured composite concentration C_comp is represented by the physical average alongside an additive measurement error epsilon:
C_comp = (1 / k) (Sum from i=1 to k of C_i) + epsilon
Measurement error epsilon distributes normally with a mean of zero and variance sigma squared. When one specimen carries a concentration slightly above statutory limits while companions contain trace levels below reporting thresholds, physical dilution pushes C_comp into the uncertainty zone of the instrument. The composite operating characteristic curve shifts outward, flattening the discrimination slope between an acceptable quality limit and an unacceptable lot quality.
Failure to integrate the analytical standard deviation into the composite operating characteristic curve produces systematic underestimation of consumer risk for borderline contamination levels.


Swatch
Specimen Heterogeneity and Mill Extraction Dynamics
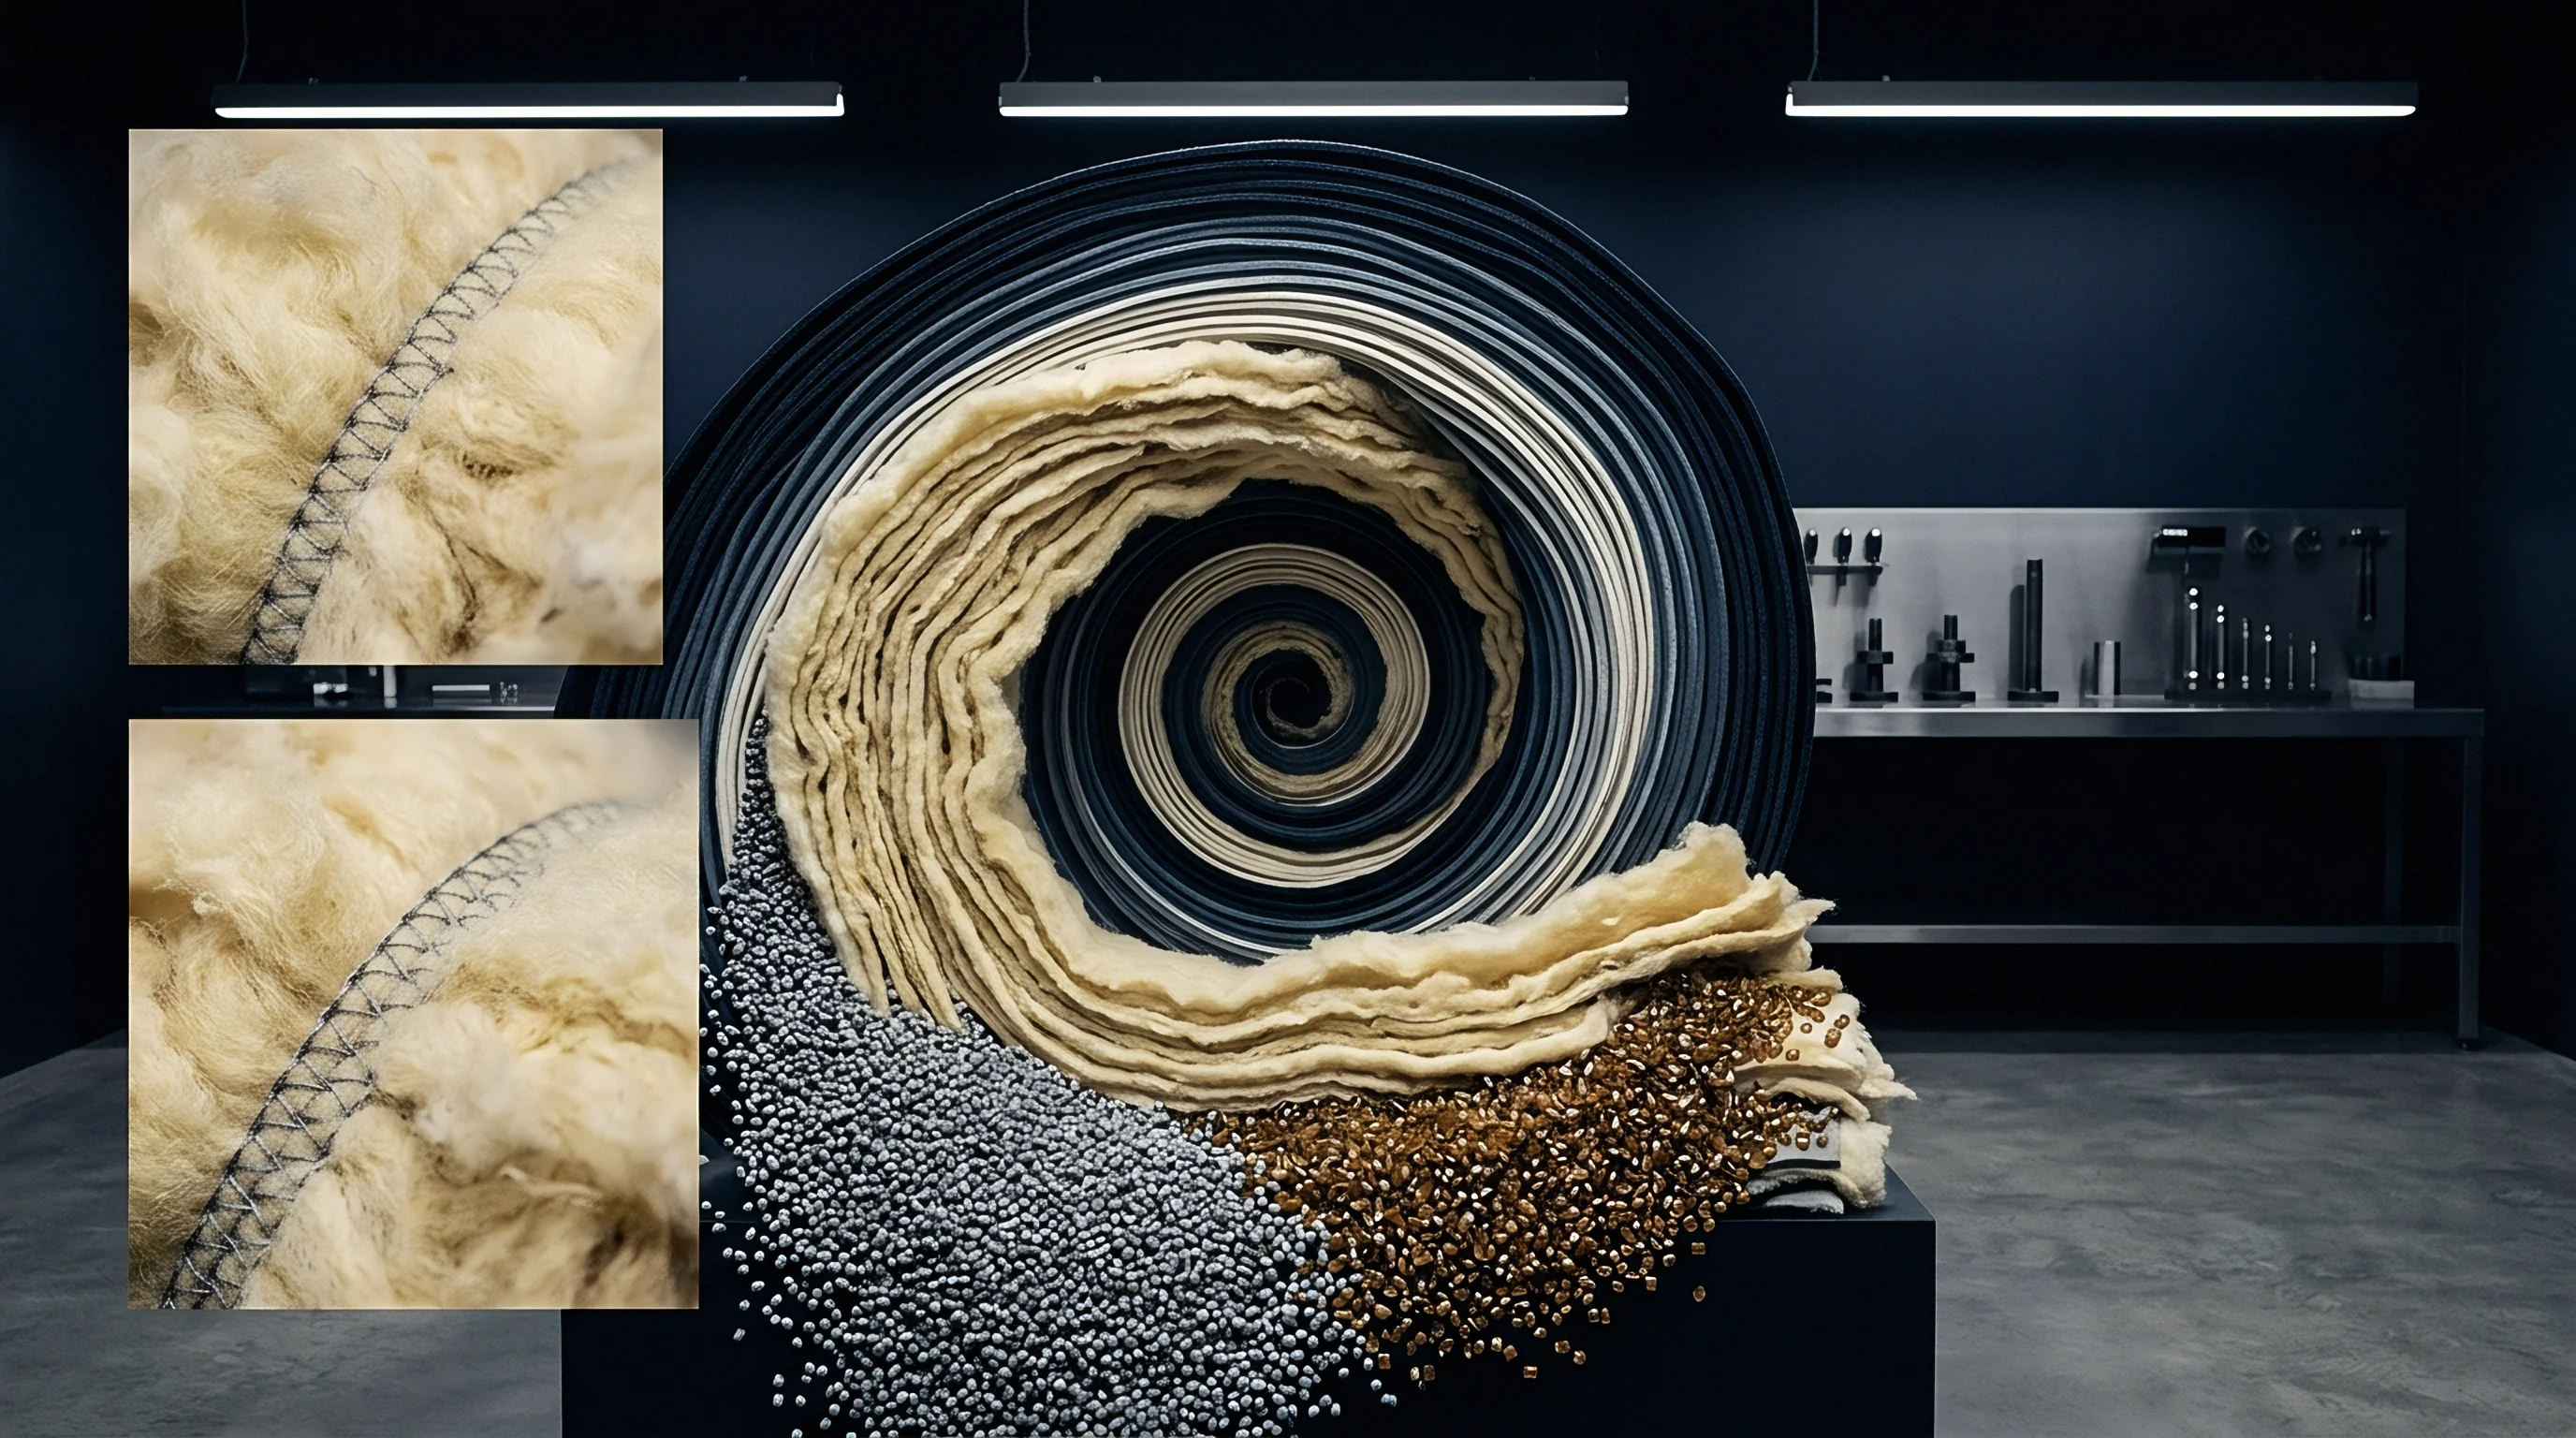
Textile chemical compliance assumes homogeneous distribution of finishes across a production lot. Mill production realities contradict this assumption across every wet processing stage. In a continuous dyeing range, pad-bath concentration fluctuates as dye fixatives deplete or thermal variations across drying cans alter migration patterns.
In package yarn dyeing, the inner layers of a yarn package absorb distinct auxiliary ratios relative to the outer perimeter. A single roll of polyester-cotton blend twill often contains significant cross-roll and end-to-end variance in chemical residue.
When an auditor cuts a swatch from the exterior tail of a finished fabric bolt, that specimen reflects only a localized coordinate in the chemical distribution landscape of the mill. Extracting physical fibers for composite analysis requires specific laboratory sample reduction protocols. Under ISO 5089, commercial textile testing mandates cutting multiple sub-samples across the width of the fabric while discarding the selvedge edges.
In composite testing workflows, technicians snip equivalent masses from three or five swatches, combining them into one extraction vessel.
- Gravimetric Discrepancy alters extraction solvent volume ratios, introducing systematic quantification skew during ultrasonic agitation or Soxhlet reflux.
- Matrix Interferences occur when specialized finishes like fluorinated stain repellents alter the solvent recovery rate of aromatic amines extracted from adjacent un-treated specimens in the same vessel.
- Solvent Depletion takes place during accelerated extraction procedures if excess mass saturates the active partitioning phase within the extraction cell.
- Chromophore Cross-Reactions emerge during chemical cleavage protocols, where auxiliary chemicals present in one swatch react with cleaved amines originating from a different swatch.
Standard testing methods establish extraction conditions tailored for isolated samples. For azo dyes, EN 14362-1 dictates reducing specimen mass to 1.0 gram, followed by reduction with sodium dithionite in a buffered aqueous medium at 70 degrees Celsius. In a three-to-one composite workflow, technicians reduce individual specimens to approximately 0.33 grams each to preserve the 1.0 gram total sample mass specified by standard glassware and reagent volumes.
Individual fiber types within a multi-fiber composite react at divergent rates to this chemical digestion.
A composite containing both wool and cotton components compromises cleavage efficiency because protein fibers consume sodium dithionite at different rates than cellulose.
When digestive reagent consumption varies across fibers, the concentration of cleaving agent available to split azo bonds drops. The yield of target aromatic amines falls below standard calibration recovery rates. The analytical chemist detects a clean trace on the chromatogram, not because the restricted dye is absent, but because the composite extraction chemistry failed to complete the cleaving reaction.
The resulting operating characteristic curve shifts rightward, creating high lot acceptance rates despite persistent chemical non-compliance on the mill floor.
Ignoring substrate chemistry during composite extraction transforms statistical quality assurance into uncalibrated commercial lottery.

Unbundling

Secondary Deconvolution Protocols and Retesting Economics
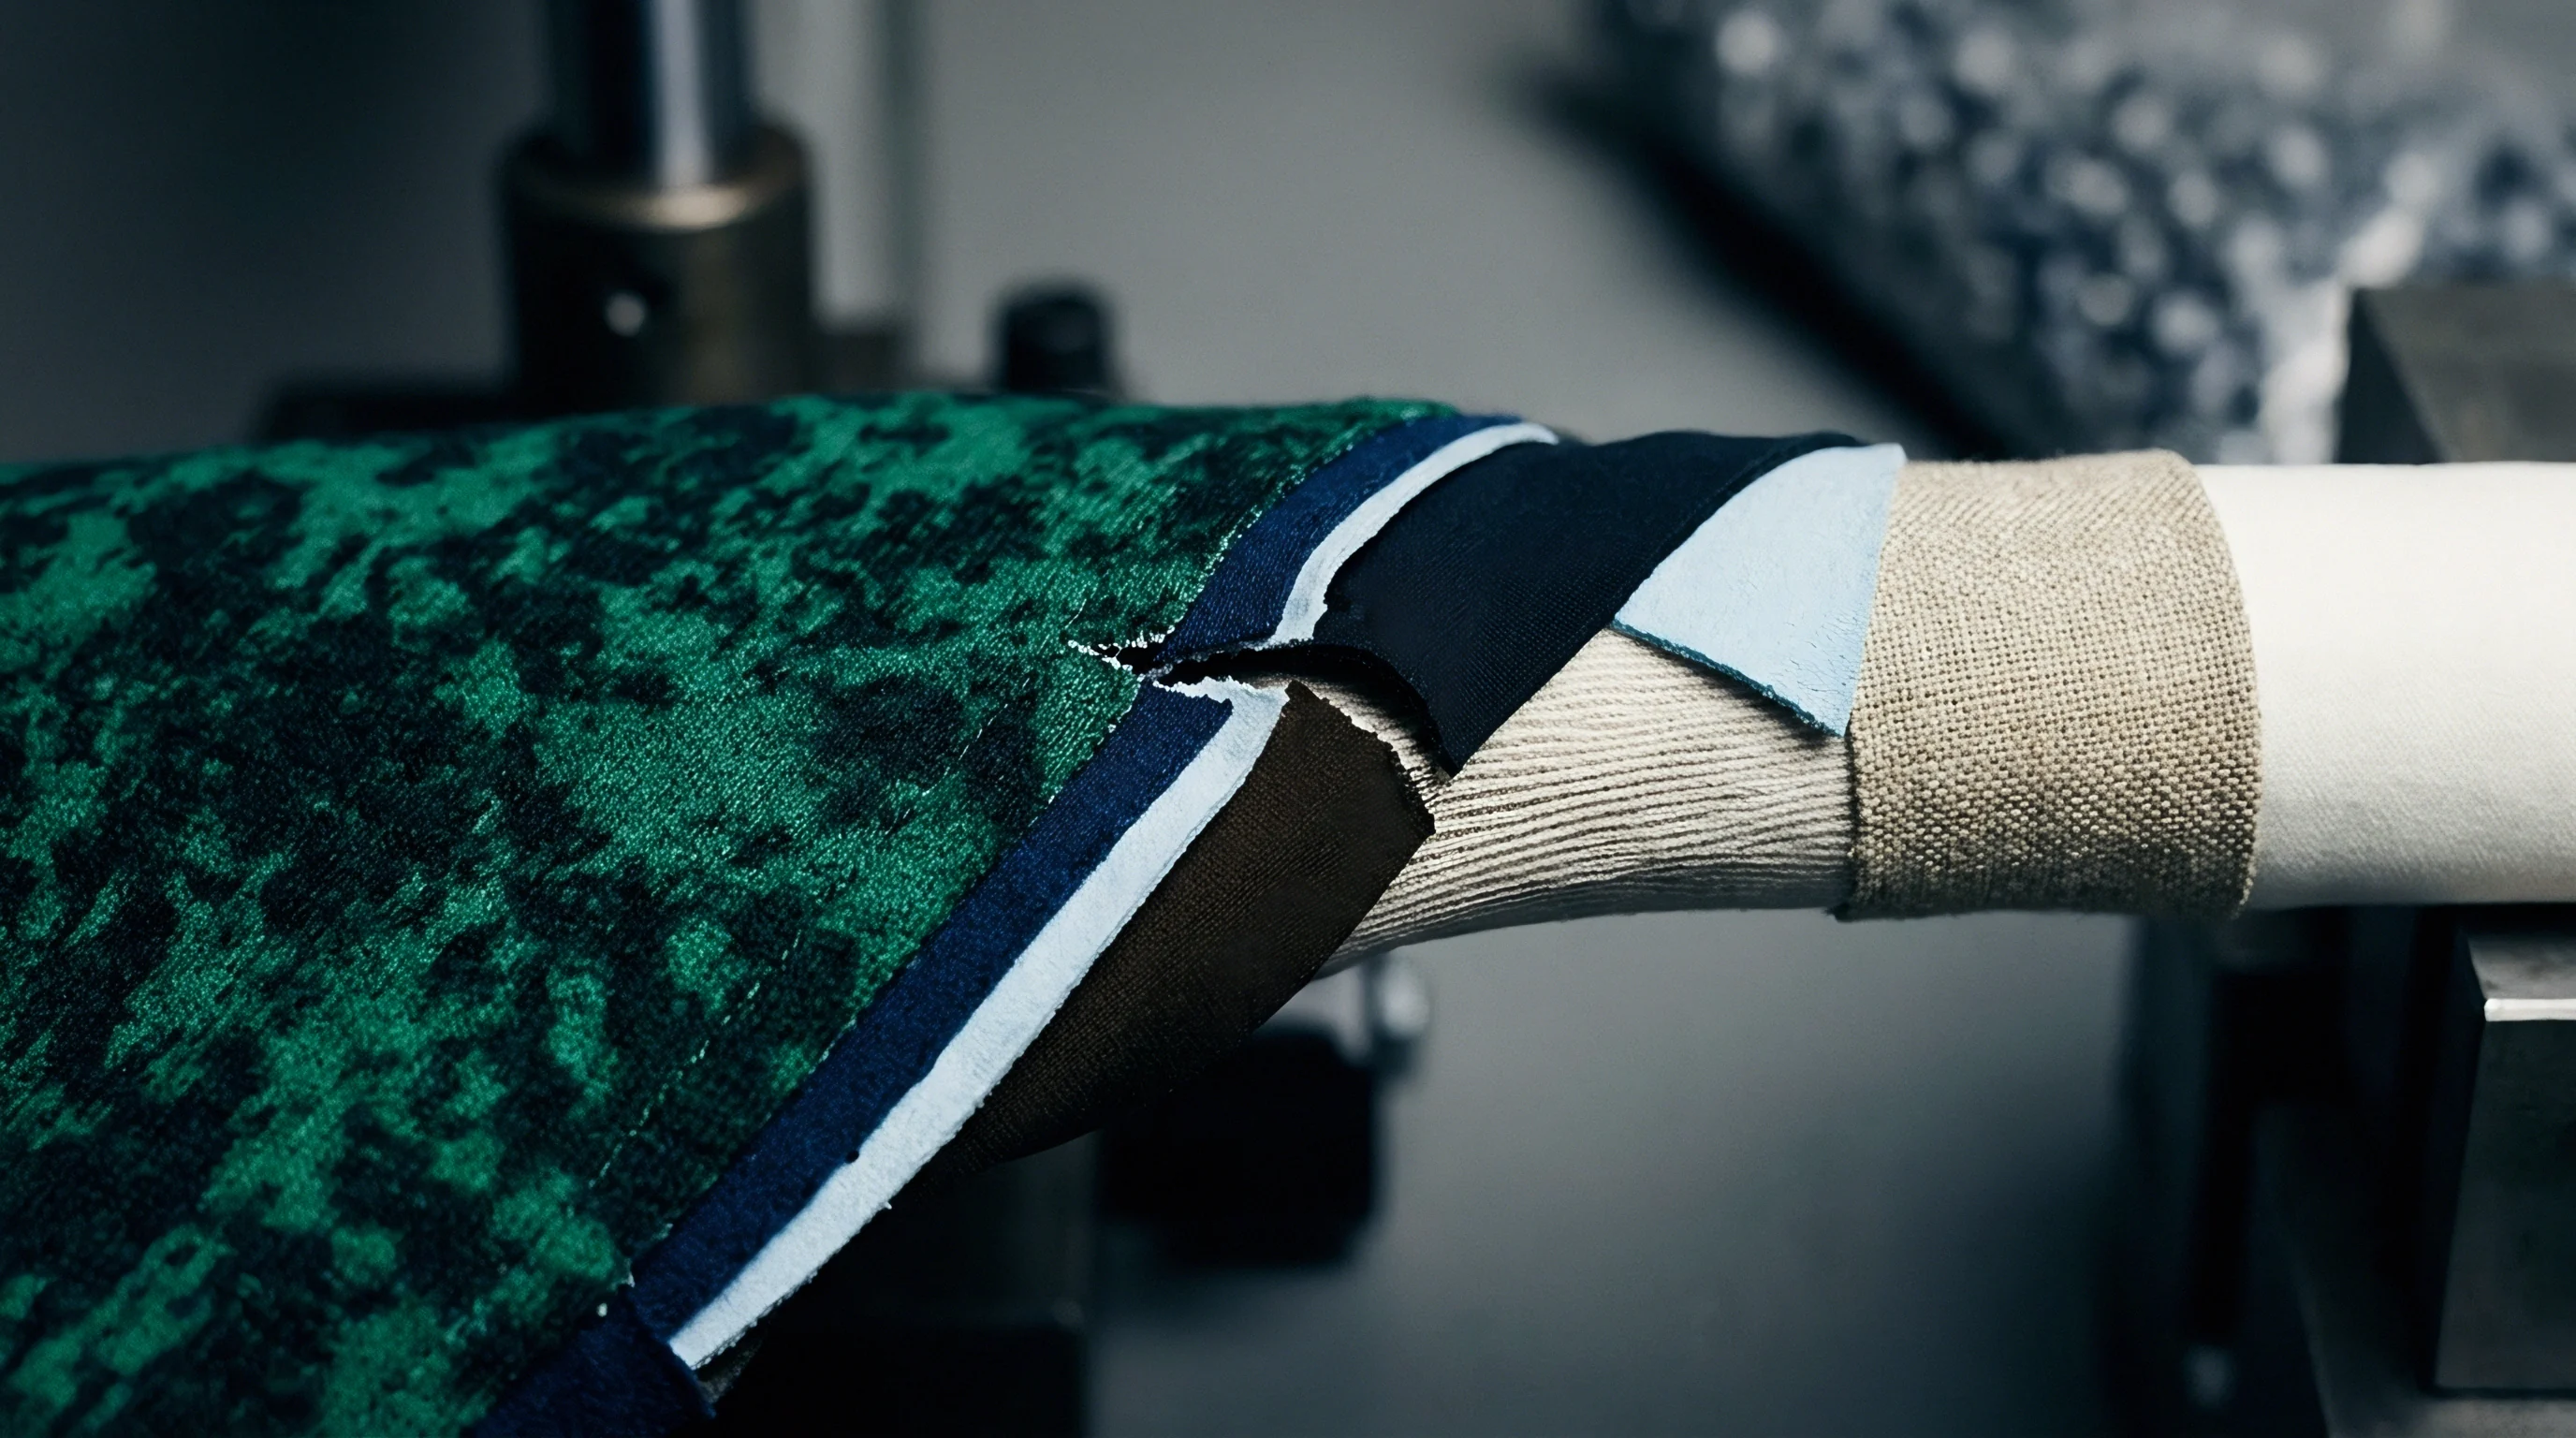
Laboratories that identify an anomalous signal during composite screening deploy an unbundling protocol. Under standard operational guidelines, if a composite pool of size k registers an analyte concentration exceeding the screening limit of L divided by k, the initial result cannot confirm an individual failure. The laboratory retrieves the original individual retained swatches and executes k distinct extraction runs.
This two-stage testing architecture creates a compound operating characteristic curve.
Let Stage 1 represent the composite screening run and Stage 2 represent the individual unbundling stage. The probability of final lot acceptance P_final requires passing Stage 1 directly or resolving Stage 1 screening flags through clean Stage 2 results. If a composite shows a concentration below L divided by k, the composite passes without Stage 2 intervention.
If the composite exceeds L divided by k, Stage 2 testing determines lot disposition. The entire batch is rejected if any individual specimen tests above the statutory limit L during Stage 2.
| Plan Architecture | Total Sample Count (n) | Screening Group Size (k) | Initial Test Runs | Retest Trigger Frequency (at p=0.03) | Expected Total Invoiced Tests |
|---|---|---|---|---|---|
| Individual Verification | 15 | 1 | 15 | 0.00 | 15.0 |
| Standard Composite | 15 | 3 | 5 | 0.087 | 6.3 |
| Aggressive Composite | 15 | 5 | 3 | 0.141 | 5.1 |
| Two-Tier Variable | 24 | 3 | 8 | 0.087 | 10.1 |
| Large Group Screen | 20 | 10 | 2 | 0.263 | 7.3 |
| Data calculated using baseline commercial testing fees of 180 USD per gas chromatography run at ISO 17025 accredited facilities. | |||||
Unbundling introduces complex cost-risk tradeoffs. At low incoming defect levels (p less than 0.01), composite testing saves brands substantial analytical expenditure. As the defect rate climbs toward 0.05, the frequency of Stage 1 false triggers expands rapidly.
When multiple composite tubes breach the conservative screening threshold of L divided by k due to benign background chemical noise, the laboratory unbundles numerous specimens. At that point, the cumulative turnaround time expands from three days to nine days, and the testing invoices exceed the cost of running individual tests from the start.
Commercial dyehouses frequently contest Stage 1 composite failures, claiming the collective background matrix created artificial spikes on the detector. When individual re-testing takes place, the delay allows volatile residual solvents or hydrolysable finishing agents to evaporate or degrade in storage. The individual retests may yield compliant results solely due to specimen aging on the laboratory bench.
The operating characteristic curve for this delayed protocol records acceptance, yet the consumer receives fabric containing chemical breakdown products.
A supplier who disputes composite screening action limits usually leverages specimen degradation windows to secure commercial clearance.


Detention

Customs Verification Realities and Border Enforcement Actions
Border authorities and consumer safety regulators do not evaluate textiles using composite screening logic. Market surveillance authorities in the European Union, enforcing RAPEX recalls under the Safety Gate mechanism, pull discrete garment units from retail distribution channels or port warehouses. When custom agents from the United States Consumer Product Safety Commission select apparel shipments for phthalate or lead determination, their laboratories conduct individual specimen testing according to strict government standard operating procedures.
This operational divergence introduces structural regulatory vulnerability for apparel importers. A commercial brand testing four composite samples of three units each (n=12, k=3) accepts a production lot under an operating characteristic curve that assumes an acceptable quality level of 1.5 percent defect rate. When the container arrives at the port of entry, customs inspectors pull three individual garments (n=3, k=1).
If the lot contains a true chemical defect rate of 10 percent, the commercial importer had an acceptance probability of roughly 28 percent during pre-shipment qualification.
The customs agency tests those three garments against the statutory threshold L without applying dilution screening calculations. The probability of the border inspector detecting at least one non-compliant garment is given by:
P_detention = 1 – (1 – p)3
At a 10 percent underlying defect rate, P_detention equals 27.1 percent. If the lot defect rate sits at 25 percent, the probability of border detention rises to 57.8 percent. A composite certificate in the buyer’s compliance dossier provides no legal defense against physical specimens seized and failed under individual customs laboratory audits.
A certificate showing composite compliance protects against factory invoices rather than border seizures.
Detention costs compound rapidly beyond the physical value of the detained textile merchandise. Storage demurrage charges at major seaports accumulate while customs laboratories conduct confirmatory testing. If customs confirms an entry breach, the agency issues a formal redelivery demand, orders the destruction of the goods under officer supervision, or mandates bonded re-exportation.
The importer of record forfeits customs bonds and faces civil penalties under statutory provisions such as Title 19 of the United States Code, Section 1592.
When regulatory enforcement actions trigger a public product recall, financial damages expand into distributor return charges and mandatory brand notifications across regional authorities. The operating characteristic curve governing composite screening creates an illusion of tight chemical oversight while exposing the business to catastrophic downstream supply disruptions.
Failure to align factory composite sampling sensitivity with customs surveillance testing rules results in regular port inventory confiscation.


Remedy

Contractual Operating Curve Alignment and Specification Clauses
Remediating structural deficiencies in textile chemical testing requires aligning statistical mechanics between brand procurement offices and contracted fabric mills. Purchase orders that state vague chemical compliance mandates fail to bind suppliers to statistical lot quality standards. Sourcing teams must formalize the operating characteristic curve parameters directly inside purchase contracts, raw material specifications, and vendor quality manuals.
- The sampling plan establishes that composite testing cannot exceed three individual specimens per analytical run, and forbids composite preparation across distinct fiber matrices or different dye lots.
- The screening limit definition establishes that any composite analytical result exceeding the statutory threshold divided by the composite group size automatically suspends batch shipping authorization and requires specimen unbundling.
- Financial liability assignment establishes that the fabric supplier absorbs all laboratory costs associated with Stage 2 unbundling whenever individual specimen re-testing confirms a chemical failure exceeding regulatory limits.
- The retaining protocol dictates that mills preserve vacuum-sealed, frozen reference swatches from every sampled fabric bolt for twelve months to provide admissible evidence during border audit disputes.
Procurement contracts must mandate operating characteristic curve performance metrics rather than simple test report submissions. The contract specifies an Acceptable Quality Limit (AQL) paired with a defined Limiting Quality (LQ) or Consumer Risk point. For toxic chemical testing, an acceptable contract specifies an AQL of 0.1 percent with an alpha risk of 5 percent, and an LQ of 2.0 percent with a beta risk of 10 percent.
Achieving these operating targets under composite testing requires expanding total specimen pulls (n) to compensate for composite dilution variability.
Legal teams drafting supply chain master service agreements must insert clear laboratory qualification language. The clause states: Analytical compliance verification conducted via composite specimen preparation must utilize ISO 17025 accredited facilities operating under calibrated reporting limits equal to or lower than the target regulatory threshold divided by the compositing factor k. Any composite report displaying target analyte concentrations above L/k shall be deemed non-conforming until individual specimen deconvolution verifies that every constituent component independently satisfies statutory thresholds.
This contractual clause prevents vendors from presenting passing composite certificates that mask individual non-compliant cuts. It aligns the financial and legal accountability of the raw material dyer directly with the analytical scrutiny applied by international customs authorities. Sourcing organizations that enforce this discipline secure genuine batch-level chemical compliance across every global manufacturing corridor.
How do procurement desks verify that mills maintain valid chain of custody for individual retain swatches during composite testing cycles?
A rigorous audit checks whether the laboratory swatch cut registers precise physical weight records and matching serial numbers against the uncut fabric rolls waiting on shipping pallets.