Spectrophotometric Tolerancing for Primary Illuminant D65 in Textile Dyehouses
Spectrophotometric tolerancing under primary illuminant D65 requires strict UV calibration, diffuse geometry, and CIEDE2000 metrics to ensure batch acceptability.
Emission
Spectrophotometers quantify reflected photon energy. Daylight varies across latitude. Standard Illuminant D65 represents an agreed phase of natural daylight with a correlated color temperature of approximately 6504 Kelvin, defined by the International Commission on Illumination (CIE) across the spectral range from 300 to 830 nanometers.
In industrial textile dyehouses, spectrophotometric shade matching depends on the physical realization of this mathematical construct within benchtop and portable spectrophotometers. Instrument manufacturers approximate the spectral power distribution of D65 using filtered continuous xenon arc lamps, pulsed xenon flash tubes, or solid-state light-emitting diode arrays. Because natural daylight contains continuous radiant power spanning the near-ultraviolet through the visible spectrum, physical simulators must reproduce both visible excitation and ultraviolet activation to evaluate modern dyed textiles accurately.

Spectral Power Characteristics of Standard Daylight
Artificial daylight sources frequently display sharp emission spikes and spectral deficiencies when evaluated against the theoretical CIE D65 relative spectral power distribution curve. Filtered xenon systems deliver a close match throughout the visible wavelengths between 400 and 700 nanometers, yet glass filter aging shifts the transmitted ultraviolet profile over operational cycles. Tungsten filaments lack ultraviolet energy.
High-intensity discharge lamps generate discontinuous emission lines that distort reflectance factors at specific dye absorption peaks. Solid-state light-emitting diode heads combine narrow-band emitters to construct an aggregate white distribution, but subtle spectral notches between emitter bands alter the excitation of sensitive trichromatic dye combinations, including olive drabs, neutral greys, and taupes.
| Wavelength (nm) | CIE D65 Benchmark | Pulsed Xenon Simulators | Multi-Channel LED Simulators | CIE Metamerism Index Category |
|---|---|---|---|---|
| 360 | 46.4 | 42.1 | 38.5 | Special UV Match Class B |
| 400 | 82.8 | 84.6 | 81.2 | Visible Match Class A |
| 460 | 117.8 | 116.5 | 118.0 | Visible Match Class A |
| 540 | 104.4 | 103.8 | 105.1 | Visible Match Class A |
| 580 | 96.6 | 95.9 | 96.2 | Visible Match Class A |
| 660 | 87.4 | 86.1 | 88.3 | Visible Match Class A |
| Values denote normalized relative spectral irradiance at standard 20-nanometer intervals under ISO 23603 / CIE S 012 specifications. | ||||

Ultraviolet Energy Control in Fluorescent Whitening
Optical brighteners complicate spectral assessment. Stilbene-derived fluorescent whitening agents and bright acid dyes absorb invisible radiation within the 340 to 390 nanometer range and re-emit visible light between 420 and 470 nanometers. An uncalibrated ultraviolet component in the spectrophotometer lamp causes catastrophic discrepancies in measured lightness (L ) and yellowness-blueness (b ).
Dyehouses align the source ultraviolet output by inserting calibrated optical filters or adjusting excitation pulse durations against plastic or textile calibration standards with known Ganz-Griesser whiteness ratings.
A spectral power shift exceeding two percent below four hundred nanometres invalidates fluorescent white tolerances under xenon illumination.
When daylight simulators decay, specific physical mechanisms disrupt the illumination chamber:
- Xenon arc envelope solarization reduces transmitted radiant energy below 380 nanometers through silica structure compaction.
- Filter plate deposition accumulates volatilized organic finishes from heated fabric specimens onto optical glass surfaces.
- Solid-state emitter degradation alters the phosphor balance in multi-die LED assemblies unevenly over operating hours.
Visual assessment under north sky light confirms what the spectrophotometer reports when both systems balance the ultraviolet band against the visible spectrum.


Jig
Fabric handling mechanics determine measurement accuracy before computation begins. The physical interface between the textile sample and the spectrophotometer measurement port introduces geometric errors that swamp algorithmic tolerances. Knitted structures compress under tension.
When a laboratory technician clamps an elastomeric circular knit over an open port, uneven stretching alters stitch density, lowers optical depth, and allows light rays to penetrate beyond the focal plane. Woven goods present directional grain lines, yarn twist reflections, and twill angles that scatter light unevenly across the integrating sphere, producing artificial hue shifts if the operator rotates the specimen between successive flashes.
Substrate Presentation at the Measuring Port
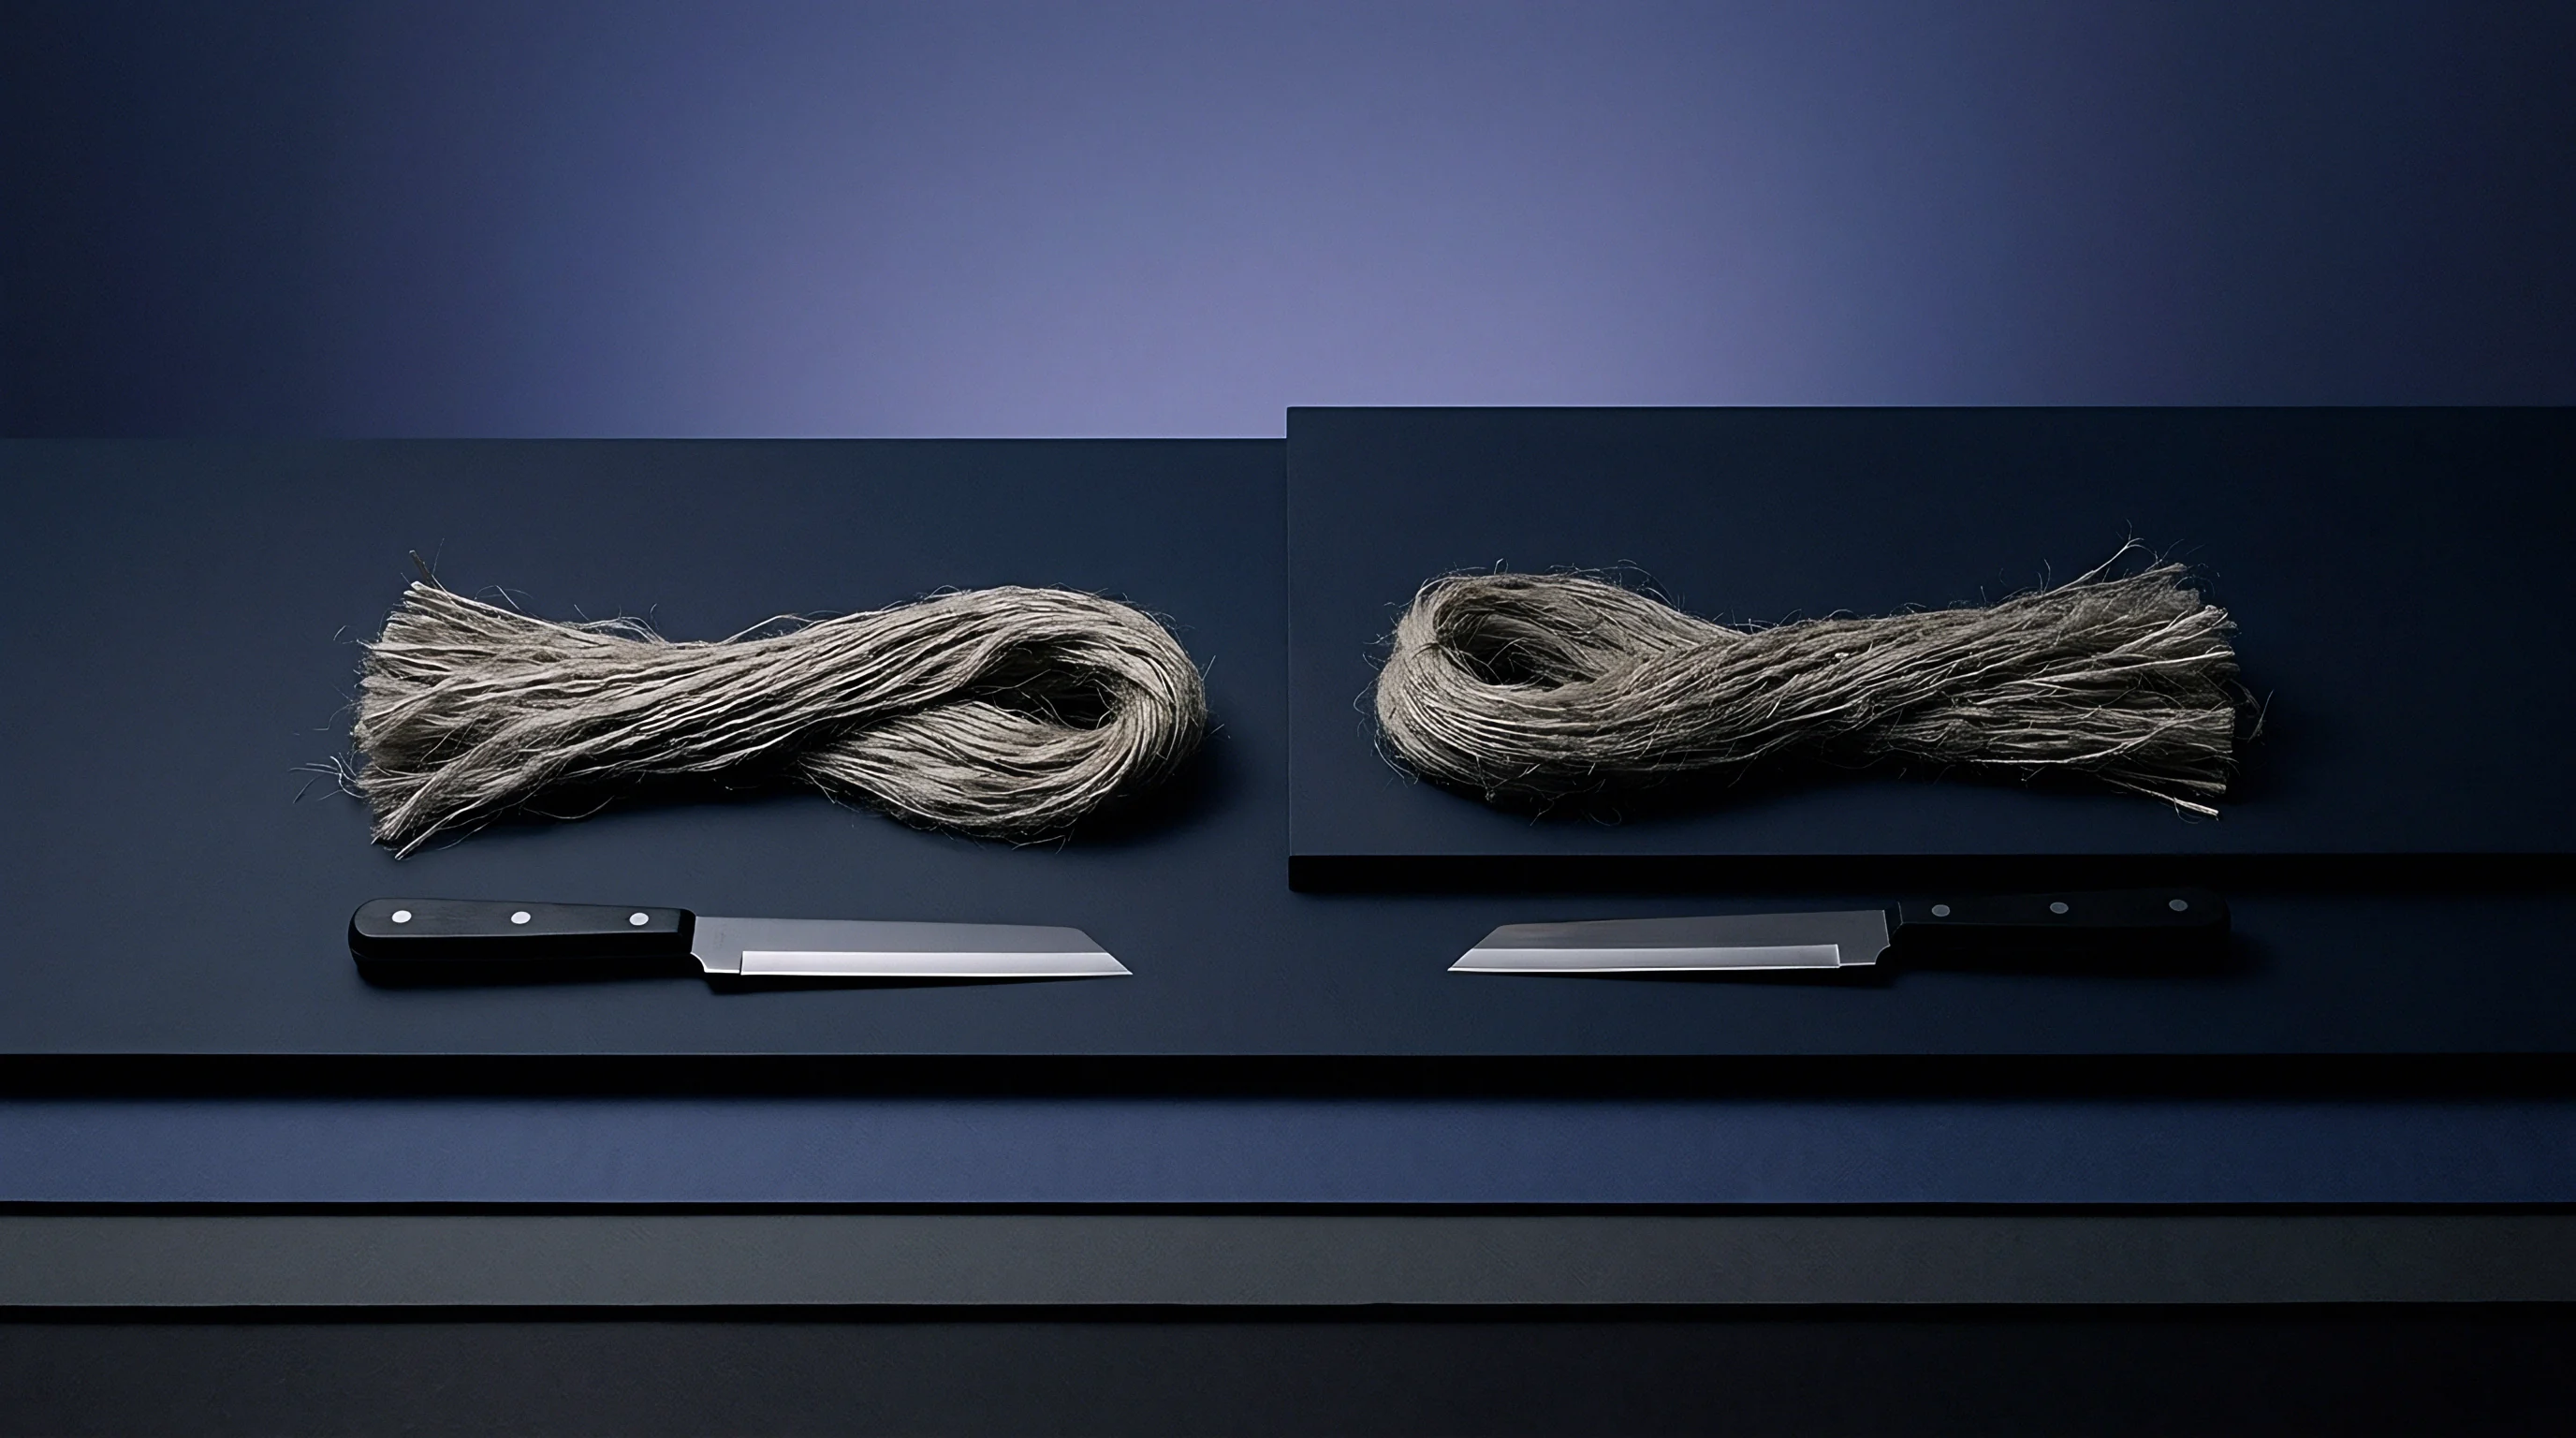
Repeatable spectrophotometric analysis demands strict specimen preparation parameters. Technicians fold lightweight fabrics to achieve infinite optical thickness, preventing the port backing material from contaminating reflectance readings. Two layers suffice for heavyweight bottom-weight twills exceeding 350 grams per square meter, whereas lightweight voile or 20-denier warp-knitted nylon requires eight or sixteen layers to extinguish light transmission.
Surface texture scatters incident beams. Raised surfaces, including corduroy ribs, terry towel loops, and brushed fleece, compress into the sphere aperture, altering internal geometry and corrupting diffuse reflectance factors.
- Fold the conditioned swatch until holding the sample against a 100-watt back-illumination lamp reveals no visible light transmission.
- Mount the folded specimen flat without stretching warp or weft threads across the spring-loaded aperture clamp.
- Position an opaque, calibrated black cavity or verified non-fluorescent white ceramic tile behind the specimen stack to standardise backing reflectance.
- Trigger four consecutive spectral flashes, rotating the specimen ninety degrees between each flash to average directional yarn luster effects.

Does Sample Translucency Compromise Reflectance Readings?
Light loss through sample edges generates false absorption signals. Semi-translucent textiles, such as silk chiffon or micro-denier polyester interlock, permit incident light rays to travel laterally through fibers before escaping outside the collection angle of the integrating sphere. This phenomenon, known as the edge-loss effect, depresses measured reflectance values across all wavelengths, causing the software to calculate an artificially dark and dirty shade.
Specifying a large-area view aperture with a 25.4-millimeter port diameter mitigates edge loss compared to small-area view apertures with 6-millimeter openings. Backing plates alter reflected flux. Measuring thin fabrics over a black tile records pigment absorption directly, whereas measuring over a white tile magnifies optical scattering paths through the yarn bundles.
Application of ISO 105-J03 compels the rejection of dye lots displaying total color difference exceeding zero point eight CMC units.
The finisher claimed that the tension bars on the tenter frame stretched the loop geometry beyond the optical density anticipated by the lab dip formulation.


Equation
Color difference computation translates raw reflectance into commercial acceptance decisions. The historic CIELAB (1976) color space assumes Euclidean distance across rectangular coordinates: L for lightness, a for the green-red axis, and b for the blue-yellow axis. Total color difference (Delta E ab) treats one unit of geometric distance as visually uniform across every coordinate sector.
Human visual perception violates this geometric assumption. CIELAB presumes uniform visual space. Human eyes exhibit extreme sensitivity to hue deviations in neutral, low-chroma shades while tolerating substantial chroma and lightness variance in brilliant orange, yellow, and turquoise shades.

Ellipsoidal Tolerancing across Modern Color Metrics
Industrial dyehouses use advanced non-Euclidean tolerancing equations to define visual acceptability boundaries. The CMC (l:c) equation, developed by the Society of Dyers and Colourists, introduces weighting functions based on starting chroma and lightness coordinates, distorting spherical tolerance zones into ellipsoids aligned with human perceptual thresholds. Setting the lightness-to-chroma ratio (l:c) to 2:1 accommodates the textile trade’s willingness to accept larger lightness variations than chroma or hue variations.
The CIEDE2000 formulation refines this approach by incorporating an interactive term between chroma and hue differences, modifying the neutral axis to resolve blue-purple hue discrepancies, and scaling coordinate lightness weights to eliminate boundary discontinuities.
| Evaluation Equation | Lightness Weighting (SL) | Chroma Weighting (SC) | Hue Weighting (SH) | Visual Correlation Index (%) |
|---|---|---|---|---|
| CIELAB (1976) | 1.00 (Fixed) | 1.00 (Fixed) | 1.00 (Fixed) | 68.4 |
| CMC (2:1) | Calculated from L | Calculated from C | Calculated from C and Hue Angle | 84.1 |
| CIE94 (2:1:1) | 1.00 (Fixed) | 1.00 + 0.045 C | 1.00 + 0.015 C | 81.7 |
| CIEDE2000 (1:1:1) | Modified polynomial L | Modified linear C | Modified parametric hue function | 92.6 |

Chroma and Hue Weighting in Saturated Shades
Chroma expands tolerance boundaries outward. In pale pastel shades where C sits below 10, human observers detect fractional shifts in tone, requiring strict elliptical boundaries where Delta E CMC cannot exceed 0.5 units under primary illuminant D65. In heavy sulfur blacks, disperse navies, and vat olives, tolerance ellipsoids expand along the chroma vector without prompting garment customer complaints.
Calculating color difference equations across diverse substrates involves explicit procedural distinctions:
- Disperse dyes on textured polyester filament demand CIEDE2000 (1:1:1) tolerancing to balance fiber cross-sectional luster variations against chemical dye uptake.
- Reactive dyes on combed cotton ring-spun single jersey perform reliably under CMC (2:1) formulations because finishing relaxation causes uniform yarn consolidation.
- Acid dyes on worsted wool twill necessitate modified lightness scaling to accommodate natural fiber yellowness fluctuations across sheep fleece origins.
Darker shades tolerate wider chromatic shifts before the human eye registers unacceptable garment panel mismatch.
Calculating color differences through CIEDE2000 aligns mathematical sorting thresholds with human retinal thresholds across both pastel and deep reactive dyeings.


Drift
Hardware stability governs long-term color data integrity. A spectrophotometer reading an identical textile swatch across twelve months experiences optical, thermal, and mechanical variances that cause numerical values to shift. Integrating spheres accumulate airborne lint, chemical vapors, and dust, degrading internal barium sulfate or sintered PTFE reflectance coatings.
Flash lamps lose spectral intensity unevenly across their arc gaps. Internal optical sensors suffer sensitivity decline from continuous thermal cycling on humid production dyehouse floors.

Inter-Instrument Agreement across Production Facilities
Brand buyers frequently measure master swatches at headquarters while offshore contract dyehouses measure bulk production rolls. Discrepancies between spectrophotometer models create commercial conflict even when both units read the same standard tile. Inter-instrument agreement defines the mathematical closeness between readings taken on identical specimens across different instruments.
High-performance benchtop spectrophotometers maintain inter-instrument agreement within 0.15 Delta E ab on BCRA ceramic tiles, but portable handheld units operating on dyehouse inspection frames often diverge by 0.60 Delta E ab. Calibration tiles degrade under abrasion. Scratched, contaminated, or improperly seated calibration tiles invalidate daily zero-point and white-point calibrations, transferring systemic errors into production batch measurements.
Specular component exclusion remains necessary when measuring high-twist yarns to isolate pigment absorption from surface sheen.
Thermochromism and moisture content induce direct physical shifts in dyed goods. Cotton loses moisture during measurement. Dried textiles emerging hot from a stenter frame display altered spectral absorption compared to cooled, conditioned fabrics.
Disperse dyes exhibit thermal shifts. The physical temperature of polyester dyed with disperse red or blue dyes alters molecular vibrational states, moving spectral reflectance curves several nanometers toward longer wavelengths until the fabric cools to standard laboratory ambient temperatures of 20 degrees Celsius and 65 percent relative humidity under ISO 139 parameters.

Are Ceramic Standards Sufficient for Long-Term Drift?
Inorganic ceramic tiles lack the structural and optical complexities of fibrous substrates. BCRA tiles maintain stable, non-porous surfaces with zero moisture absorption, meaning ceramic validation proves optical sensor linearity without testing specimen-port pressure mechanics or edge-loss behaviors. A spectrophotometer displaying green status on daily ceramic diagnostic tiles can report inaccurate values on porous, light-scattering loop-pile textiles.
Dyehouses counter this divergence by maintaining secondary working standards produced from dyed, resin-stabilized, high-twist polyester twills sealed in desiccated, dark storage containers.
Technicians continue to debate whether solid-state spectrophotometer light sources maintain absolute ultraviolet output across five years of daily factory shifts without factory recalibration.


Settlement
Converting spectrophotometric data into financial acceptance requires contractual clarity. Visual inspection under controlled lighting booths remains subjective, influenced by operator fatigue, retinal pigment variations, and ambient optical flare. Numerical pass/fail tolerancing under CIE Primary Illuminant D65, supplemented by Illuminants A and F02 (CWF) or F11 (TL84) to control metamerism, provides an empirical basis for commercial settlement.
Commercial contracts assign inspection liability. When a dyehouse finishes 50,000 meters of dyed woven twill, shade variance across piece beginnings, piece middles, piece ends, and roll-to-roll sequences dictates whether the shipment clears the receiving dock or triggers severe payment deductions.

Commercial Batch Tolerances in Buyer Contracts
Clear supply specifications define the exact color difference metric, illuminant observer conditions (typically D65 with the CIE 1964 10-degree standard observer), measurement geometry (diffuse/8-degree or 45/0-degree), specular component mode (specular excluded), and mathematical acceptance thresholds. Setting an unyielding Delta E threshold of 0.5 CMC units across all color families causes unnecessary batch rejections and costly re-dyeing cycles that degrade fabric tensile strength and raise chemical consumption. Commercial tolerance matrix models assign wider tolerances to high-chroma shades while restricting pastel boundaries.
| End-Use Application | Target Substrate Construction | Primary D65 Tolerance | Secondary Illuminant Tolerance | Metamerism Index Limit (MI) |
|---|---|---|---|---|
| Automotive Interior Seating | Woven polyester dobby, 420 g/m² | Delta E00 ≤ 0.40 | Illuminant A: Delta E00 ≤ 0.50 | MI ≤ 0.30 |
| Apparel Outerwear Shell | Nylon 6,6 taslan plain weave, 160 g/m² | Delta E CMC (2:1) ≤ 0.75 | TL84: Delta E CMC ≤ 0.85 | MI ≤ 0.50 |
| Activewear Knitted Tops | Polyester/elastane circular knit, 180 g/m² | Delta E CMC (2:1) ≤ 0.90 | TL84: Delta E CMC ≤ 1.00 | MI ≤ 0.60 |
| Workwear Industrial Uniform | Cotton/polyester 3/1 twill, 280 g/m² | Delta E00 ≤ 1.10 | Illuminant A: Delta E00 ≤ 1.20 | MI ≤ 0.80 |
Arbitration Pathways for Off-Shade Shipments
Shade sorting groups adjacent rolls. The 555 shade sorting system groups production lots into three-dimensional color blocks along lightness, chroma, and hue axes, ensuring cutting rooms lay up matching fabric rolls to prevent panel-to-panel color shading in finished garments. When a buyer flags an entire batch as non-conforming, formal arbitration protocols require third-party laboratories to condition specimens under ISO 139 for twenty-four hours before conducting blind spectrophotometric validation on dual-beam reference spectrophotometers.
Inserting standard dispute clause DIN 6174 Annex B into the supply agreement shifts the burden of arbitration testing to the party whose bench readings deviate furthest from the agreed reference swatch.