Standardized Spectrophotometer Calibration Protocols for Industrial Dyehouse Operations
Standardized calibration aligns optical geometry, zero-trap absorption, and diagnostic ceramic tiles across instruments to guarantee digital shade tolerances.
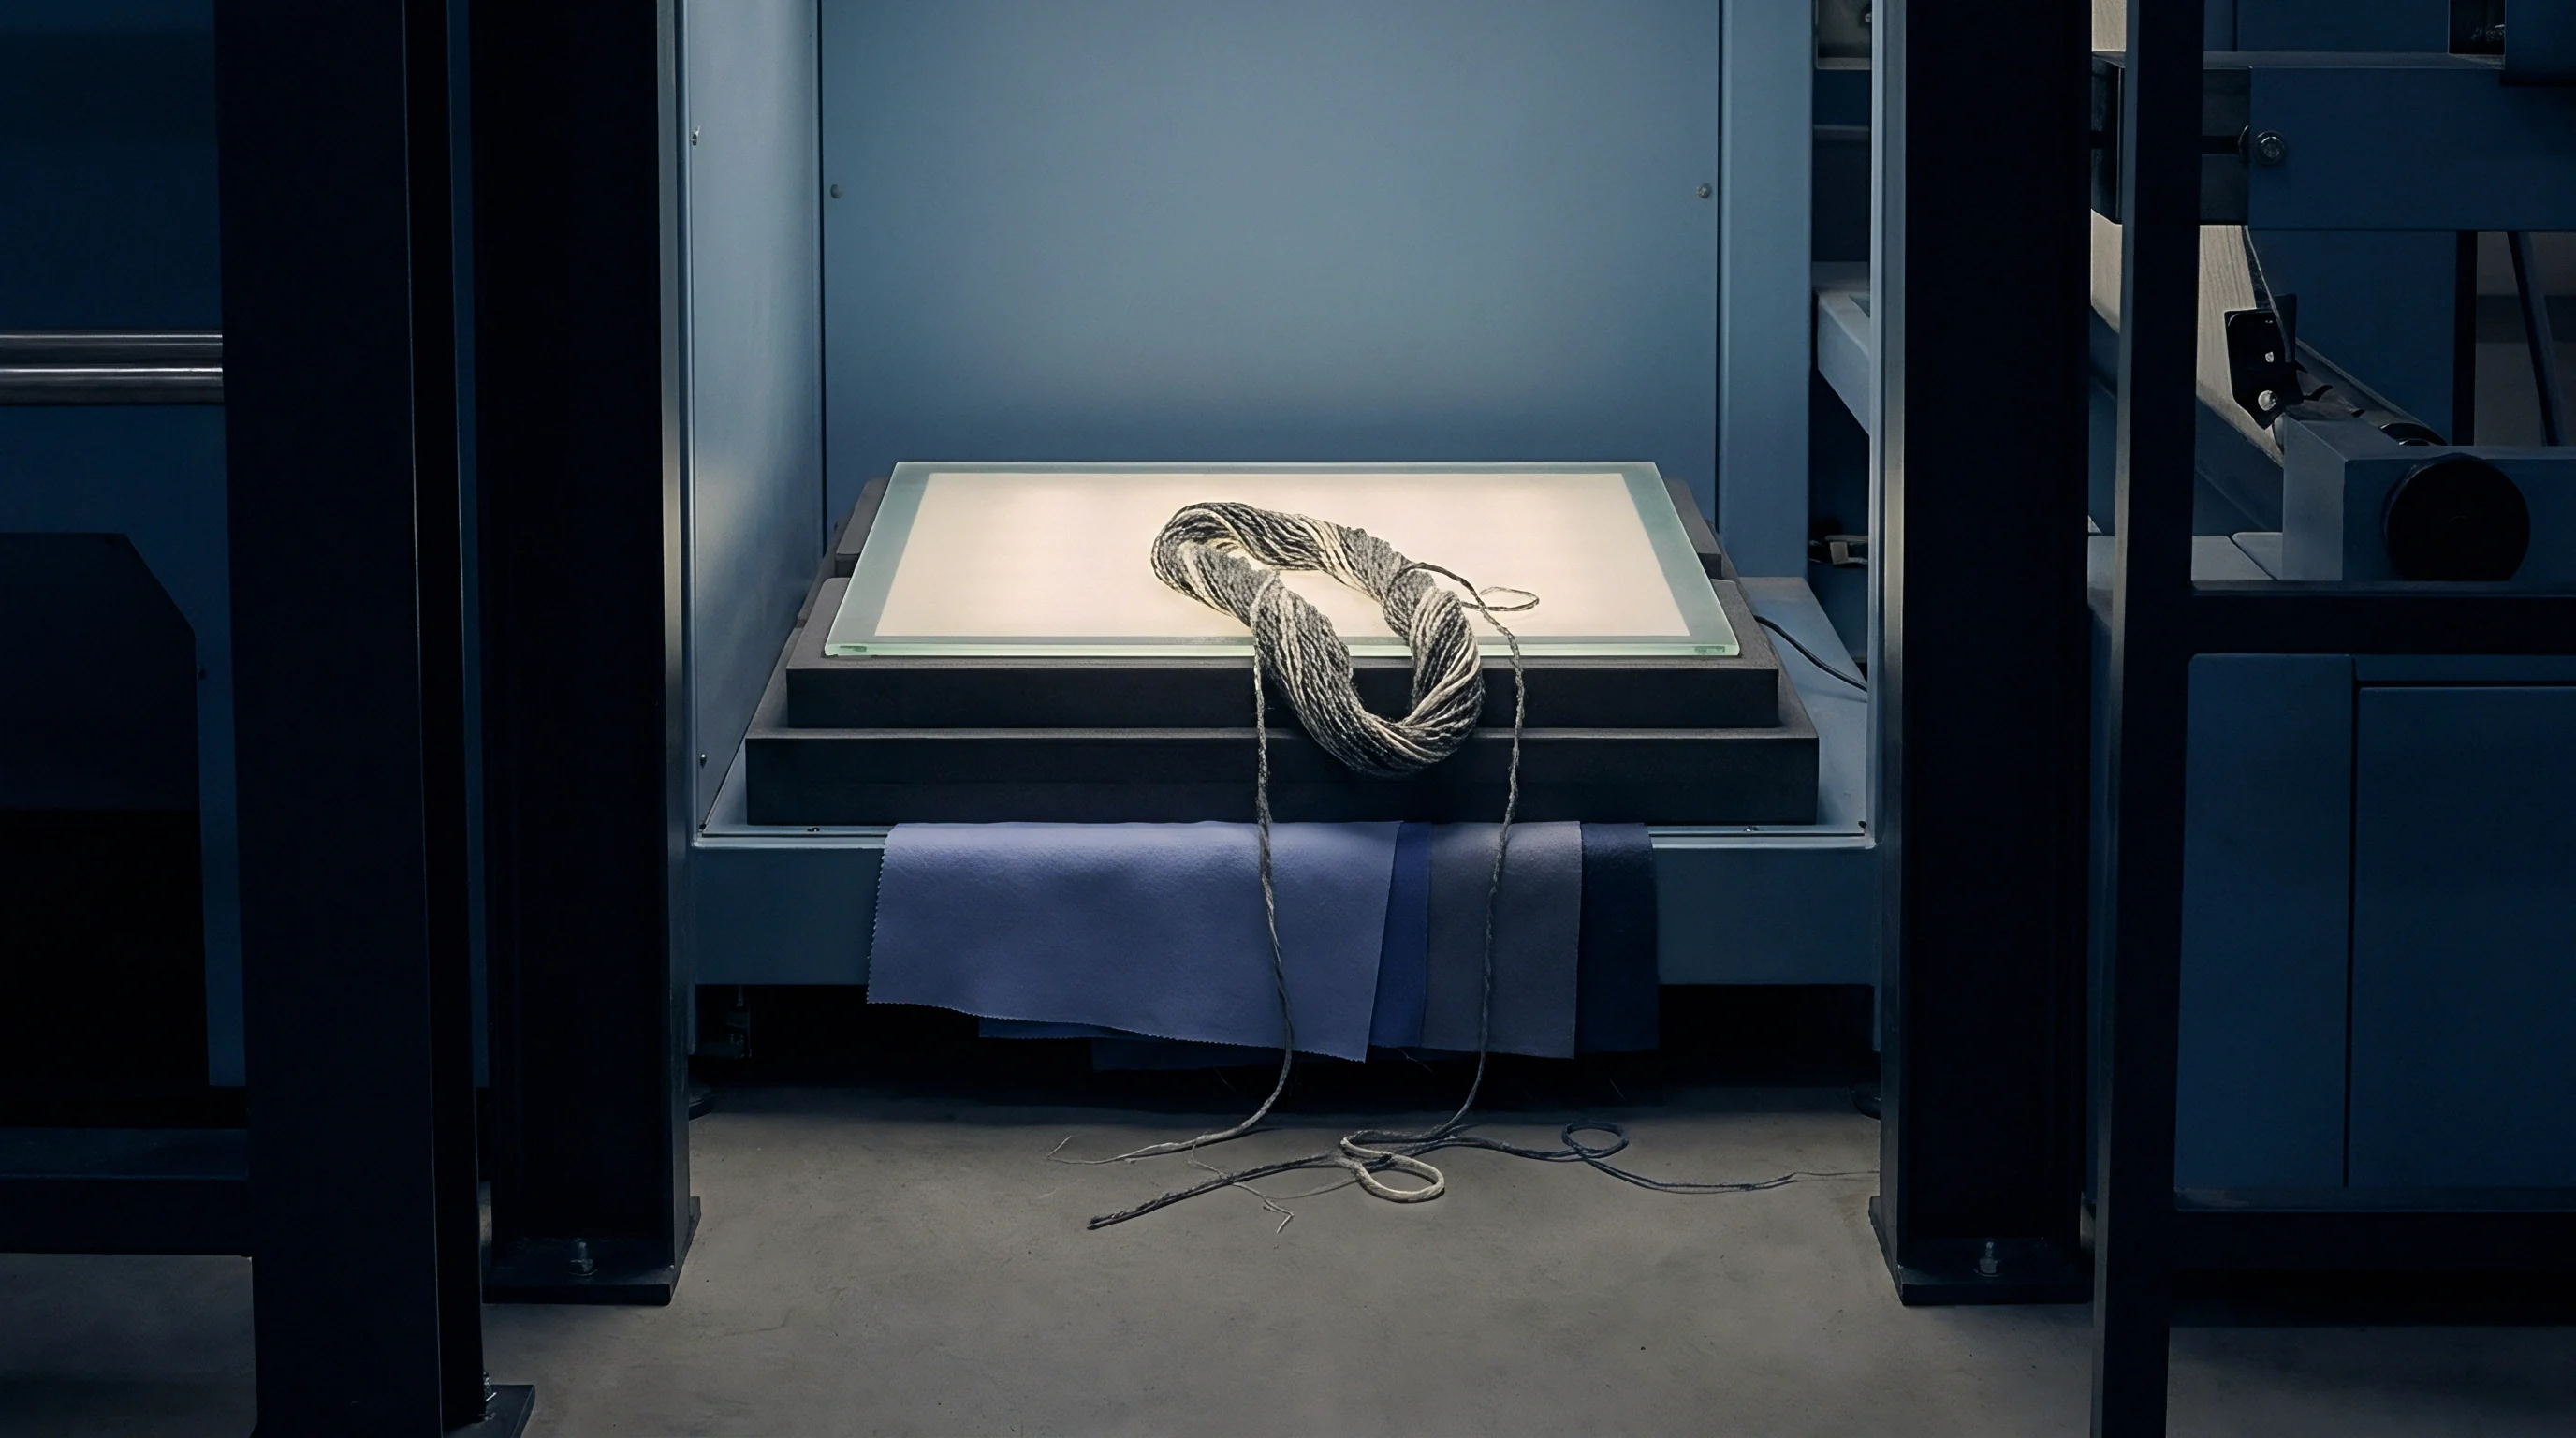

Trap
Dyehouse shade consistency begins with optical zero calibration. Spectrophotometers read colour by measuring the ratio of light reflected from a textile substrate against the light reflected from a calibrated standard. Absorbing all incident energy at the zero point establishes the bottom of the photometric scale.
In dual-beam sphere instruments, optical zero absorbs internal stray energy, housing flares, and electronic sensor noise. Zero drift ruins dark shades. When the zero baseline migrates upward by 0.05 percent reflectance, navy, black, and deep olive formulations suffer calculated lightness errors exceeding 0.60 CMC units.
Jet dyeing operations run off shade on heavy depths while pale pastels pass inspection without notice.
The physical light trap creates an absolute dark standard. Modern spectrophotometers utilize either a cavity trap coated with non-reflective polyurethane velvet or an empty light chamber with an inverted conical light sink. High-volume dyehouse laboratories expose these optical accessories to aggressive airborne contaminants.
Sublimated disperse dye carriers, atomized finishing oils from open tenter frames, and particulate lint settle on internal trap surfaces over sixty operating days.
A zero-trap cavity contaminated with 0.08 grams per square metre of lint elevates deep black reflectance baselines by 0.12 percent.
Airborne grease and particulate matter turn an absorbing cavity into a partial reflector. Technicians overlook this physical contamination because standard daily software prompts merely require clicking through the zero stage. Stray light falsifies depth.
Operators place the trap over the measurement aperture without inspecting the internal light sink, baking baseline distortion directly into subsequent measurements. The instrument registers a false elevated floor. Dark production goods measured against this skewed baseline appear excessively light on screen, prompting the laboratory automated dispensing system to overdye bulk lots by two to four percent on dyestuff weight.
Optical zero degradation follows distinct mechanical and physical mechanisms across dyehouse floors:
- Velvet Cavity Erosion sheds light-absorbing micro-flock fibres after repeated friction against aperture plates, exposing bare aluminium that reflects 4.2 percent of incoming light.
- Sublimation Vapour Deposition from nearby heat-setting machinery condenses volatile plasticizers onto the internal light sink, turning matte black coatings into specular gloss surfaces.
- Aperture Ring Distortion prevents planar seating against the optical port, allowing ambient room illumination to enter the integrating sphere during zero capture.
- Compressed Air Contamination from dirty plant lines deposits hydrocarbon aerosols directly into the optical chamber during cleaning cycles, permanently lifting baseline noise.
Inspection routines demand rigorous physical isolation. Black velvet degrades rapidly. Maintenance personnel must house zero standards inside sealed desiccators kept at 21 degrees Celsius and 50 percent relative humidity, separated from the open steam environment of laboratory sample dye beakers.
Standard operational practice mandates ultrasonic cleaning of solid metal trap housings in spectrophotometer-grade isopropanol every ninety days, followed by spectrophotometric verification against a factory-certified master trap. Skipping these physical controls produces catastrophic colour rejections in commercial production lots, generating re-dyeing charges that eliminate processing margins across entire seasonal contracts.

Plaque
White calibration plaques define the 100 percent reflectance limit across the visible spectrum from 360 to 750 nanometres. Industrial benchtop instruments employ sintered polytetrafluoroethylene or polished bismuth-doped opal ceramic tiles as primary working references. Ceramic surfaces collect oil.
Fingerprint lipids transfer to the ceramic face when technicians reposition the tile during morning calibration routines. A lipid film of 0.5 micrometres thickness absorbs ultraviolet radiation while scattering blue wavelengths, suppressing spectral values below 440 nanometres by up to 1.8 percent.
Calibration tiles scratch easily. Micro-abrasions from coarse greige cotton or mineral residues on unwashed twill cloth act as localized light traps, permanently reducing calibrated Y-tristimulus values. Daily calibration using a worn reference transfers systematic bias into every dye recipe calculation.
The instrument software compensates by artificially multiplying measured sample signals, shifting laboratory dip predictions away from actual production reality. Wavelength shift invalidates formulations.
| Standard Type | Physical Medium | Target Parameter | Tolerance Limit | Verification Cadence |
|---|---|---|---|---|
| Working White | Bismuth Opal Ceramic | Y Tristimulus Drift | Maximum Delta E 0.05 | Daily at 8-Hour Intervals |
| Diagnostic Green | BCRA Series II Ceramic | Spectral Slope Shift | Maximum Delta E 0.15 | Weekly on Monday Shift |
| Didymium Filter | Rare-Earth Doped Glass | Wavelength Accuracy | Peak Shift Under 0.2 nm | Monthly Diagnostic Run |
| Neutral Grey | Matte Sintered Ceramic | Photometric Linearity | Reflectance Error Under 0.10% | Bi-Weekly Routine |
| Master White | Pressed PTFE Disc | Primary Absolute Scale | Zero Deviation Baseline | Semi-Annual Audit Check |
| Measurements recorded under D65 illuminant, 10-degree observer, specular included mode at 21 degrees Celsius and 50 percent relative humidity. | ||||
Secondary reference standards confirm optical alignment between major service intervals. British Ceramic Research Association Series II green tiles provide sensitive diagnostics for both wavelength shifts and photometric inaccuracies. The green tile exhibits steep spectral reflectance slopes in two separate bands near 410 nanometres and 530 nanometres.
Minor prism misalignments or grating drive wear produce immediate, outsized colour difference readings on this specific ceramic standard.
International test standard ISO 105-J01 invalidates colourfastness ratings whenever instrument working tiles exceed an uncertified drift threshold of Delta E 0.20 against master plates.
Dyehouse managers maintain secondary verification routines using dedicated diagnostic sequences:
- Clean the BCRA green tile using optical lens wipes saturated with high-purity methyl alcohol, allowing five minutes for thermal stabilization on the balance bench.
- Execute routine white plaque and black trap calibration on the benchtop spectrophotometer under the 25.4-millimetre large area view aperture.
- Position the green tile against the measurement port using light spring tension to prevent micro-cracking of the ceramic glaze.
- Take five consecutive readings with ninety-degree manual rotations between flashes, recording average CIELAB coordinates against factory birth certificates.
A drift exceeding Delta E 0.15 on the green tile demonstrates optical misalignment requiring mechanical recalibration. Mill managers frequently claim that internal software algorithms automatically balance out minor ceramic scratches over time through mathematical averaging.


Sheen
Specular reflectance separates true material colour from surface finish. When incident light strikes a woven or knitted textile, the surface reflects energy through two distinct pathways: diffuse scattering from internal dye-fibre interfaces and directional specular reflection from outer filament surfaces. Integrating sphere spectrophotometers capture both components using diffuse illumination with directional viewing at eight degrees, designated as d/8 geometry.
Textured surfaces scatter light unevenly.
Internal specular gloss traps enable or disable direct surface reflection capture. Specular Component Included readings gather every scattered photon, recording the total absorption behavior of dyestuffs inside the polymer matrix. Specular Component Excluded configurations vent mirror-like surface reflections out of the sphere through an open optical port.
Geometry determines dye uptake calculation. Formulating dye recipes requires Specular Included data, because mechanical finishes applied downstream change surface sheen without altering dye molecule quantities.
| Substrate Class | Surface Texture | Target Geometry | Mode Selection | Formulation Risk |
|---|---|---|---|---|
| Continuous Filament Twill | High Specular Sheen | d/8 Integrating Sphere | Specular Included | Exclusion overestimates dye mass by 8% |
| Mercerized Combed Cotton | Moderate Lustre | d/8 Integrating Sphere | Specular Included | Exclusion causes batch-to-batch lightness drift |
| Microfibre Fleece Knit | Deep Diffuse Pile | d/8 Integrating Sphere | Specular Excluded | Inclusion captures boundary scatter loss |
| Direct-Coated Polyurethane | Gloss Barrier Film | 45/0 Directional Ring | Specular Excluded | Sphere modes mask micro-pinhole orange peel |
| Worsted Wool Serge | Directional Twill Rib | d/8 Integrating Sphere | Specular Included | Aperture orientation induces chromatic errors |
A calendered cotton satin exhibits higher apparent colour depth than an uncalendered plain poplin containing the identical dyestuff concentration per kilogram of yarn. Calendering flattens surface yarns, increasing specular reflection while concentrating directional glare. An instrument set to Specular Component Excluded records the calendered cloth as darker, leading computer colour matching engines to calculate lower dye concentrations for replenishment baths.
Gloss masks actual batch absorption. When the finished material undergoes subsequent laundering, surface luster collapses, revealing an under-dyed, pale ground that fails customer delivery specifications.
Surface finish changes apparent depth without shifting internal chemical dye concentrations.

How Do Specular Excluded Modes Distort Recipe Predictions?
Evaluating shade differences on the finished cutting table requires precise optical separation. Retail buyers inspect garments under mixed overhead lighting where specular glare deflects away from human eyes. Matching visual perception against spectrophotometric data on high-sheen synthetic outerwear demands Specular Component Excluded alignment.
Laboratory colorists nevertheless run recipe formulations under Specular Included parameters. Running recipe predictions with specular exclusion causes software matching algorithms to interpret surface gloss variations as pigment deficits, adding unneeded dye to jet vessels.
Directional geometry configurations create further industrial discrepancies. Circular 45/0 instruments illuminate samples at forty-five degrees through an annular ring and collect light at ninety degrees perpendicular to the surface. This optical setup eliminates specular reflections without mechanical gloss traps.
While 45/0 spectrophotometers correlate closely with human visual assessments inside light booths, they remain hypersensitive to yarn direction, knitting loops, and twill angles. Integrating sphere d/8 instruments remain the global standard for dyehouse recipe formulation and inter-mill communication. Calibration protocols must enforce strict specification of specular mode and sphere condition inside digital exchange files, because comparing an included reading against an excluded standard generates artificial Delta E color differences between 1.50 and 4.20 on lustrous synthetics.
Experienced colorists rely on consistent optical geometry rather than software conversions to protect production margins.

Specimen
Proper sample presentation governs measurement reproducibility on the dyehouse inspection bench. Textile materials lack optical uniformity. Knitted structures stretch, woven ribs create directional shadows, and open mesh constructions allow illuminating beams to pass directly through the sample opening.
Standardized calibration loses practical utility when operators press loose, unconditioned cloth against spectrophotometer measuring ports. Knits deform under spring clamps.
Substrate thickness dictates measurement opacity. Translucent sheer fabrics, fine 15-denier nylon hosiery knits, and low-sett plain woven linings leak light. Energy passing through open interstitial yarn pores reflects off the instrument backing plate instead of returning to the sensor array.
Standard protocol requires folding the specimen to an optically opaque thickness, verified when doubling the ply count causes no spectrophotometric change greater than Delta E 0.05. Alternatively, samples rest against a calibrated white ceramic backing tile matching the instrument calibration set, maintaining fixed background boundary conditions.
Textile samples folded to optical opacity yield measurements independent of backing plate reflectance.
Substrate orientation and measurement aperture dimensions interact directly with physical yarn geometry:
- Aperture Area Selection dictates sampling representation, where Small Area View ports of six millimetres capture yarn slub variations while Large Area View ports of twenty-five millimetres average out local textile irregularities.
- Four-Turn Averaging neutralizes directional shadow patterns on heavy twill, corduroy, and pique knits through ninety-degree rotational readings.
- Pneumatic Clamping Pressure regulates loop compression, preventing manual hand pressure variances that alter local yarn density during reflectance scans.
- Surface Pile Alignment standardizes light scatter on velvet and fleece goods by brushing nap fibers in a uniform downward direction prior to measurement.
Moisture content shifts reflectance profiles. Dye molecules and textile polymers alter refractive indices when conditioned from dry states to standard equilibrium. Cellulose fibres exhibit dramatic moisture sensitivity.
Unconditioned cotton holds between four and eight percent water by weight depending on ambient dyehouse humidity. Moisture alters chromatic coordinates. Water absorption swells cotton fibres, altering cross-sectional geometry and increasing light scattering paths inside yarn bundles.
Unconditioned yarn yields false values.

Should Conditioning Enclosures Precede Every Bench Measurement?
Industrial cycle times rarely accommodate four-hour sample conditioning cycles inside standard conditioning cabinets meeting ISO 139 tolerances of 20 degrees Celsius and 65 percent relative humidity. Rapid continuous dyeing ranges produce sixty metres of finished goods per minute, requiring shade approval decisions within six minutes of roll offloading. Running unconditioned shade scans against digital standards conditioned at standard equilibrium creates immediate chromatic errors, shifting delta values by up to 0.45 CMC units along the red-green and yellow-blue axes.
Sample temperature introduces severe thermochromic bias. Disperse red, sulfur brown, and certain reactive blues shift spectral profiles significantly when measured hot off the stenter frame exit. Measuring a fabric sample at 45 degrees Celsius yields a false reddish, dull appearance compared to its stable room-temperature profile.
Allowing specimens to reach thermal equilibrium on a conductive heat-sink plate for three minutes eliminates false shade rejections, preventing dyehouse managers from improperly adding shading dyestuffs to running batches. What environmental boundary conditions establish the acceptable commercial envelope between rapid operational cycle times and absolute spectrophotometric precision?

Accord
Inter-instrument agreement underpins modern supply chains where brands communicate digital target standards rather than physical fabric cuttings. A brand development studio in New York generates a digital QTX file containing spectral reflectance curves from 400 to 700 nanometres at 10-nanometre intervals. A commission dyehouse in Kaohsiung and a finishing plant in Ahmedabad formulate production dips to match those exact digital coordinates.
Digital standards replace physical cuttings. Success requires both instruments to read identical reflectance percentages across every wavelength band within strictly bounded limits.
Inter-instrument agreement tolerances depend on brand pass-fail thresholds. Commercial retail programs enforce batch-to-batch color tolerances between Delta E CMC 0.60 and 0.80. If two factory spectrophotometers exhibit baseline inter-instrument agreement variances of Delta E 0.40 on diagnostic ceramic tiles, the available manufacturing margin for actual dyeing, chemical bath concentration, and stenter curing drops by more than fifty percent.
Tight tolerances eliminate shaded shipments.
| Agreement Class | Diagnostic Medium | Maximum Inter-Model Variance | Repeatability Standard | Supply Chain Application |
|---|---|---|---|---|
| Tier 1 Digital Master | Twelve BCRA Series II Tiles | Delta E CMC under 0.15 | Delta E CMC 0.02 max | Brand Headquarters Digital Standards |
| Tier 2 Production Match | Twelve BCRA Series II Tiles | Delta E CMC under 0.30 | Delta E CMC 0.05 max | Vertical Mill Recipe Kitchens |
| Tier 3 Shop-Floor Check | Eight BCRA Series II Tiles | Delta E CMC under 0.50 | Delta E CMC 0.10 max | Inspection Frame Portable Scanning |
| Legacy Cross-Platform | Neutral Grey Tiles | Delta E CMC under 0.70 | Delta E CMC 0.15 max | Older Fleet Mixed Manufacture Lines |
Instrument profiles drift over time due to lamp aging, integrating sphere coating degradation, and motor drive wear. Flash xenon lamps fire millions of pulses over a twelve-month production calendar, altering emission spectrum balances in the ultraviolet and blue bands. Barium sulfate sphere coatings yellow upon exposure to atmospheric industrial fumes, absorbing short-wavelength energy and reducing signal-to-noise ratios.
Standard calibration protocols dictate annual factory recertification using primary standards traceable to the National Physical Laboratory or the National Institute of Standards and Technology.
Profiling software provides digital harmonization between diverse instruments across global dyeing networks. Mathematical transform matrices map spectrophotometer output curves against a centralized digital master unit, reducing inter-instrument variance across secondary production fleets. Profile correction remains valid only when baseline hardware calibration, zero traps, and white tile cleanliness meet strict diagnostic parameters.
Software cannot correct nonlinear detector failures or physical optical contamination.
Mill qualification agreements enforce formal contractual compliance mechanisms. Supply agreements specify that all production lots must undergo digital clearance on spectrophotometers certified annually under ISO 17025 accredited procedures, with daily calibration logs archived for three years. Incorporating clause 14.3 of the International Textile Sourcing Master Agreement mandates financial liability for all off-shade commercial garments when a mill fails to produce daily spectrophotometric calibration and diagnostic green-tile audit records upon delivery dispute.