Statistical Acceptance Sampling Plans for Heterogeneous Insect Honeydew Contamination
Acceptance sampling for insect honeydew requires Negative Binomial hotspot thresholds rather than mean spot counts to prevent extreme processing stoppages.


Sugar

Biochemical Identity and Thermal Phase Shifts
Insect honeydew deposited on raw cotton lint by Bemisia tabaci (sweetpotato whitefly) and Aphis gossypii (cotton aphid) transforms high-speed rotor and ring spinning operations into mechanical shutdowns. Plant-derived physiological sugars consist almost entirely of glucose and fructose. Insect honeydew introduces complex oligosaccharides, predominantly the disaccharide trehalulose (1-O-alpha-D-glucopyranosyl-D-fructose) and the trisaccharide melezitose (O-alpha-D-glucopyranosyl-(1-3)-beta-D-fructofuranosyl-alpha-D-glucopyranoside).
These insect secretions account for acute processing failure because their physical and thermal behaviors diverge sharply from monosaccharides.
Trehalulose possesses an exceptionally low glass transition temperature and extreme hygroscopicity. When ambient relative humidity inside the blowroom or carding suite exceeds 55 percent, trehalulose absorbs atmospheric moisture, shifting from a brittle amorphous glass into an adhesive, viscoelastic fluid. The sticky droplets adhere to the card clothing, accumulate on the draw frame drafting cots, wrap around roving rollers, and fuse within rotor grooves.
A raw cotton delivery exhibiting a low total reducing sugar content of 0.25 percent by mass can provoke severe cylinder loading if that sugar profile consists primarily of trehalulose. A physiological sugar concentration of 0.60 percent dominated by plant glucose often passes through ring spinning drafting systems without causing roller lap-ups.
A raw cotton delivery exhibiting a low total reducing sugar percentage provokes card loading when insect trehalulose dominates the deposit.
Laboratory quantification techniques yield conflicting indices of stickiness because they measure different chemical and mechanical phenomena. Quantitative chemical tests such as the Potassium Ferricyanide Reducing Sugar test or High-Performance Liquid Chromatography (HPLC) measure exact molecular concentrations across an aqueous extract of the lint. Mechanical thermodetectors simulate mill temperatures and pressures directly against an aluminum foil or sheet substrate.
The International Committee on Cotton Testing Methods (ICCTM) categorizes stickiness measurement systems into chemical assays, physical thermodetection devices, and automated high-speed mechanical testers. A chemical assay pulverizes the sample, extracting sugars uniformly into water, which completely masks the spatial aggregation of the sugar deposits on the raw fiber matrix.

Analytical Resolution across Standard Methods
Mechanical thermodetection isolates individual sticky points. The Sticky Cotton Thermodetector (SCT), standardized under ITMF guidelines, compresses a 2.5 g lint web between heated platens at 84 degrees Celsius for 120 seconds, followed by ambient pressure cooling, after which aluminum foil sheets reveal adhered spots peeled away from the fiber matrix. The High Speed Stickiness Detector (HSSD) automates this thermodynamic cycle, processing samples at rates suitable for high-throughput testing laboratories.
The Fiber Contamination Tester (FCT) and its successors employ infrared detection of deposits pressed onto rotating drums, quantifying both the size distribution and the absolute count of sticky droplets.
Data output structures vary across these analytical systems. HPLC outputs concentrations of specific mono-, di-, and trisaccharides in milligrams per gram of raw fiber with an analytical tolerance of plus or minus 4 percent relative standard deviation. The SCT records an integer count of sticky spots per 2.5 g sample.
The manual SCT operator visually counts spots pressed into an aluminum backing sheet, introducing human variance that expands the inter-laboratory coefficient of variation beyond 25 percent on identical commercial lots. Rotor spinning thresholds classify cotton with fewer than 10 SCT spots as non-sticky, 10 to 24 spots as lightly sticky, 25 to 39 spots as moderately sticky, and 40 spots or greater as heavily sticky. For compact ring spinning producing fine combed yarns of Ne 50 or finer, an SCT spot count above 15 brings frequent end-breakages and roller lap-ups.
Discrepancies between HPLC sugar concentration and SCT spot count stem entirely from physical distribution: five milligrams of trehalulose concentrated into three large droplets causes catastrophic drafting failure, whereas five milligrams dispersed across the lint matrix as an aerosol mist passes through opening and blending lines undetected.
The merchant defending a contested delivery routinely cites total chemical reducing sugar levels to argue for commercial compliance.


Clump

Microscopic Spatial Clustering in Bales
Insect honeydew does not form a homogeneous coating across the cotton fibers in a field. Aphids and whiteflies feed in localized colonies on the undersides of leaves, ejecting discrete droplets onto open bolls positioned directly below their feeding perches. When the spindle harvester or stripper gathers the seed cotton, heavily contaminated bolls enter the machine alongside untouched bolls harvested from unaffected sections of the plant canopy.
The ginning process, comprising cylinder cleaners, extractor feeders, and saw gin stands, partially tears apart seed cotton locks but fails to blend the mass at a microscopic level. Contaminated fiber tufts remain agglomerated.
Compressing the fiber into a standard 227-kilogram universal density bale cements this extreme spatial heterogeneity. A core sample pulled from the outer layer of a bale can reveal zero sticky spots on an HSSD scan, while a core drilled thirty centimeters inward through the same bale penetrates a dense pocket of honeydew containing several hundred spots per 2.5 grams of fiber. The distribution of insect honeydew within a single bale, and across an entire shipping lot of 200 bales, violates the core assumptions of Gaussian normal statistics.
| Detection System | Measurement Metric | Sample Size | Throughput Rate | Inter-Laboratory CV |
|---|---|---|---|---|
| SCT Thermodetector | Adherent Spot Count | 2.5 grams | 8 tests per hour | 22.5 to 31.0 percent |
| HSSD Automated Tester | Adherent Spot Count | 2.5 grams | 25 tests per hour | 14.0 to 19.5 percent |
| HPLC Chromatography | Specific Sugar Mass | 1.0 gram | 2 tests per hour | 3.5 to 6.0 percent |
| FCT Drum Scanner | Optical Deposit Count | 10.0 grams | 40 tests per hour | 16.0 to 24.0 percent |
| Rapid Chemical Reducing | Percentage Extractables | 5.0 grams | 12 tests per hour | 8.0 to 12.0 percent |

Mathematical Breakdown of Normal Distribution Models
Quality control systems that apply mean and standard deviation models to sticky spot counts miscalculate acceptance probabilities. Because honeydew occurs in discrete, highly localized droplets, spot counts across repeated samples from a single contaminated lot display pronounced positive skewness and kurtosis. Modeling these counts with a Gaussian distribution assigns non-zero probabilities to negative spot counts and underestimates the probability of encountering extreme spot clusters in the tails.
When a spinning mill measures ten samples from a 100-bale delivery and calculates an average of 12 SCT spots with a standard deviation of 14, an assumption of normality suggests that 95 percent of the lot falls below 40 spots. The actual skewed distribution contains pockets exceeding 80 spots per 2.5 g web, triggering massive machine stoppages as soon as those specific bales enter the carding room.
The statistical nature of honeydew contamination reflects an overdispersed counting process. The variance of the sample spot count systematically exceeds the sample mean, ruling out standard Poisson models. The spatial cluster represents a compound event: the primary arrival of an insect deposit on an individual lock of cotton, followed by the secondary mechanical tearing and smearing of that deposit into daughter droplets during ginning and lint cleaning.
A sampling plan designed around the Gaussian assumption guarantees commercial friction between buyer and seller.
A shipping lot certified as moderately clean under a normal distribution model regularly halts spinning machinery when opening line plucking beaters strike concentrated internal pockets of honeydew.


Poisson

Governing Probability Functions for Overdispersed Counts
Evaluating acceptance risk for heterogeneous insect honeydew requires statistical distributions accommodating count data where the variance-to-mean ratio is significantly greater than unity. The Poisson distribution presumes that events occur independently at a constant average rate, which equates the distribution mean to its variance. In honeydew contamination, the presence of one sticky droplet strongly increases the probability of finding additional droplets within the same drawn tuft due to mechanical smearing.
The Negative Binomial distribution correctly models this overdispersion by treating the rate parameter of a Poisson process as a Gamma-distributed random variable.
The Negative Binomial probability mass function defines the probability of observing exactly k sticky spots in a test specimen of fixed mass:
P(X = k) =
The parameter r represents the dispersion coefficient (shape parameter), while p is the success probability, linked to the population mean mu and population variance sigma squared through the equations:
mu = r (1 – p) / p
sigma^2 = mu + (mu^2 / r)
When the dispersion parameter r approaches infinity, the Negative Binomial distribution converges to the standard Poisson distribution. When r approaches zero, the distribution exhibits extreme aggregation, concentrating most counts at zero while dispersing remaining observations into an extended, heavy tail of severe contamination.
Zero-Inflated Poisson (ZIP) and Zero-Inflated Negative Binomial (ZINB) distributions address an additional operational reality of raw cotton procurement: lots containing a mixture of completely uncontaminated bales harvested before pest migrations, alongside heavily infested bales. A zero-inflated model bifurcates the population into a structural zero subpopulation (cotton harvested without insect exposure) and an overdispersed count subpopulation governed by insect deposition dynamics.
A Negative Binomial distribution captures the heavy tail of localized sticky spots that standard Gaussian acceptance calculations erase.
Operating Characteristic (OC) curves constructed from the Negative Binomial distribution reveal the performance of classical sampling plans. An OC curve maps the actual lot contamination level to the mathematical probability that the buyer will accept the shipment. Acceptance plans calibrated on Poisson assumptions generate an unjustified sense of security.
They yield artificially steep OC curves that dramatically underestimate the Producer’s Risk (rejecting a lot whose true mean meets the specification) and the Consumer’s Risk (accepting a lot containing intolerable pockets of honeydew).
Under a Negative Binomial model, decreasing the aggregation parameter r flattens the OC curve. This mathematical reality proves that no modest increase in drawn sample size can compensate for spatial clustering unless the sampling protocol actively addresses the cluster structure itself. A single composite sample created by blending ten pinches across ten bales dilutes extreme spots down into the background noise of the assay, presenting a false reading of uniform mild stickiness.
The field provides no mathematical escape: acceptance sampling of honeydew contaminated lots is an exercise in bounding tail risks under conditions of extreme overdispersion.


Lot

Spatial Stratification and Penetration Mechanics
A raw cotton purchase contract governs lots packaged in discrete physical units. The standard commercial lot consists of 100 or 200 universal density bales, wrapped in polypropylene fabric and bound with high-tensile steel wire or polyester strapping. Physical sampling protocols established by ASTM D1441 and ISO 1130 dictate drawing fiber portions from the outer layers of opened bales.
These conventional extraction procedures fail entirely when deployed against heterogeneous honeydew.
Surface sampling extracts lint that experienced the highest air circulation during warehousing, which dries outer deposits and promotes bacterial degradation of surface sugars. The core of the bale remains sealed at moisture contents typically ranging between 6.5 and 8.5 percent. A robust physical sampling protocol enforces spatial stratification across three distinct axes: lot stratification, bale stratification, and intra-bale core penetration.
- Laydown stratification isolates sampling units across the ginning sequence, drawing test bales from the beginning, middle, and end of the gin run to capture temporal shifts in field harvesting conditions.
- Intra-bale core boring extracts lint from a minimum depth of forty centimeters using a pneumatic serrated coring tube, securing fibers protected from external ambient humidity fluctuations.
- Dual-platen gross selection splits the drawn bale sample into outer layer tufts and deep interior layers, preventing contaminated internal tufts from escaping detection.
- Mechanical pre-opening feeds drawn samples through a laboratory opening roller without ginning wire clothing, individualizing tufts to expose hidden sticky surfaces before thermodetection.
The physical preparation of drawn samples determines testing validity. Extracting a 500-gram sample from a bale and running a direct 2.5-gram SCT test directly from the edge of that sample introduces massive selection bias. The technician naturally pulls cleaner, less tangled locks.
Contaminated locks frequently exhibit an off-white or yellowish cast with irregular crimp, prompting biased manual extraction. Drawn samples require randomized mechanical subsampling. The gross sample must pass through a specialized rotary blender or mechanical multi-sampler that reduces the mass to a 20-gram test sliver without generating heat that melts sticky spots onto internal guide plates.
Commercial acceptance plans must define the specific sampling stage within the procurement pipeline. The operational stages of lot verification include:
- Inspection of bale packaging integrity and recording of bale moisture percentages using calibrated electrical resistance probes across five points per bale.
- Selection of candidate bales determined by a pseudo-random stratification schedule based on the ginner’s bale sequence numbers.
- Pneumatic coring of identified bales at an angle perpendicular to the compressive layers to intersect multiple ginning flakes.
- Conditioning of raw cored samples at 21 degrees Celsius plus or minus 1 degree, and 65 percent relative humidity plus or minus 2 percent, for twenty-four continuous hours under ISO 139 atmosphere.
- Automated thermodetection testing of duplicate specimens from each cored bale, logging spot counts and deposit size distribution metrics.
Failure to maintain strict relative humidity conditioning prior to testing introduces severe analytical drift. Dry insect honeydew tests as completely non-sticky on mechanical detectors, while the identical sample exposed to 68 percent relative humidity turns into an adhesive gel that wraps completely around test rollers.
Disputes over lot quality emerge when the supplier conditions samples at 50 percent relative humidity while the receiving spinning mill tests the same lot at 65 percent relative humidity.


Tariff

Commercial Penalty Bands and Landed Cost Mechanics
Uncontrolled insect honeydew contamination destroys the financial viability of a spinning enterprise. The costs manifest across four operational categories: machine productivity losses, labor hours spent clearing wraps, roller cot damage requiring premature buffing or replacement, and finished yarn quality downgrades. Carding machines processing heavily contaminated cotton drop from speeds of 60 kilograms per hour down to 35 kilograms per hour to reduce friction-induced heat.
Rotor spinning frames suffer continuous rotor groove filling, shifting end-breakage rates from a normal baseline of 80 per 1,000 rotor hours up to 600 per 1,000 rotor hours. Ring spinning frames produce incessant roller laps, gouging rubber cots and forcing cardroom technicians into endless mechanical intervention.
The economic impact of stickiness escalates as fiber transforms into finished goods. Combing machines plug at the nippers and detaching rollers, driving uncombed noil extraction percentages upward by 2.0 to 4.0 percent above spec to strip out sticky clumps. The commercial contract must assign financial accountability for these losses directly to the raw material invoice.
| HSSD Spot Count Range | Contamination Grade | Price Discount Per Pound | Operational Mandate | Processing Cost Penalty |
|---|---|---|---|---|
| 0 to 9 spots | Non-Sticky | 0.00 US cents | Standard ring spinning | Base landed cost |
| 10 to 19 spots | Light Stickiness | 1.75 US cents | Blend at maximum 20 percent | +0.04 USD per kg yarn |
| 20 to 34 spots | Moderate Stickiness | 4.50 US cents | Blend at maximum 10 percent | +0.12 USD per kg yarn |
| 35 to 49 spots | Heavy Stickiness | 9.00 US cents | Rotor spinning only coarse counts | +0.28 USD per kg yarn |
| 50 spots and above | Severe Stickiness | Rejection of delivery | Arbitration or re-export | Full claim exposure |
The financial calculations governing raw cotton purchasing must integrate yarn yield and downstream labor. Combed cotton yarns command higher premiums in global markets. When honeydew-laden cotton enters the combing line, the financial loss compounds through wasted energy, degraded combed sliver uniformity, and depressed yarn tenacity.
Harmonized System (HS) customs tariffs for raw cotton (HS heading 5201) apply flat or ad valorem duties across shipments regardless of internal honeydew contamination. A spinning mill importing raw cotton at an 8 percent ad valorem duty pays import duty on the gross invoiced value, including contaminated fiber that cannot be processed into commercial yarn. If a 100-tonne lot valued at 2.10 USD per kilogram contains severe stickiness requiring rejection or selling to open-end coarse-count spinners at a 30 percent discount, the importing mill loses both the raw material margin and the unrecoverable import tariffs and inbound freight charges.
Landed cost models must incorporate the statistical risk of accepting out-of-spec bales under the contractual acceptance sampling plan. Incorporating a dynamic risk multiplier into the purchase contract transfers the financial exposure of spot clusters back to the commodity merchant.
The purchase contract must stipulate clear, unambiguous testing methods, naming the specific testing instrument, the ambient conditioning limits, and the exact percentile cutoff applied to the lot sampling distribution.


Protocol
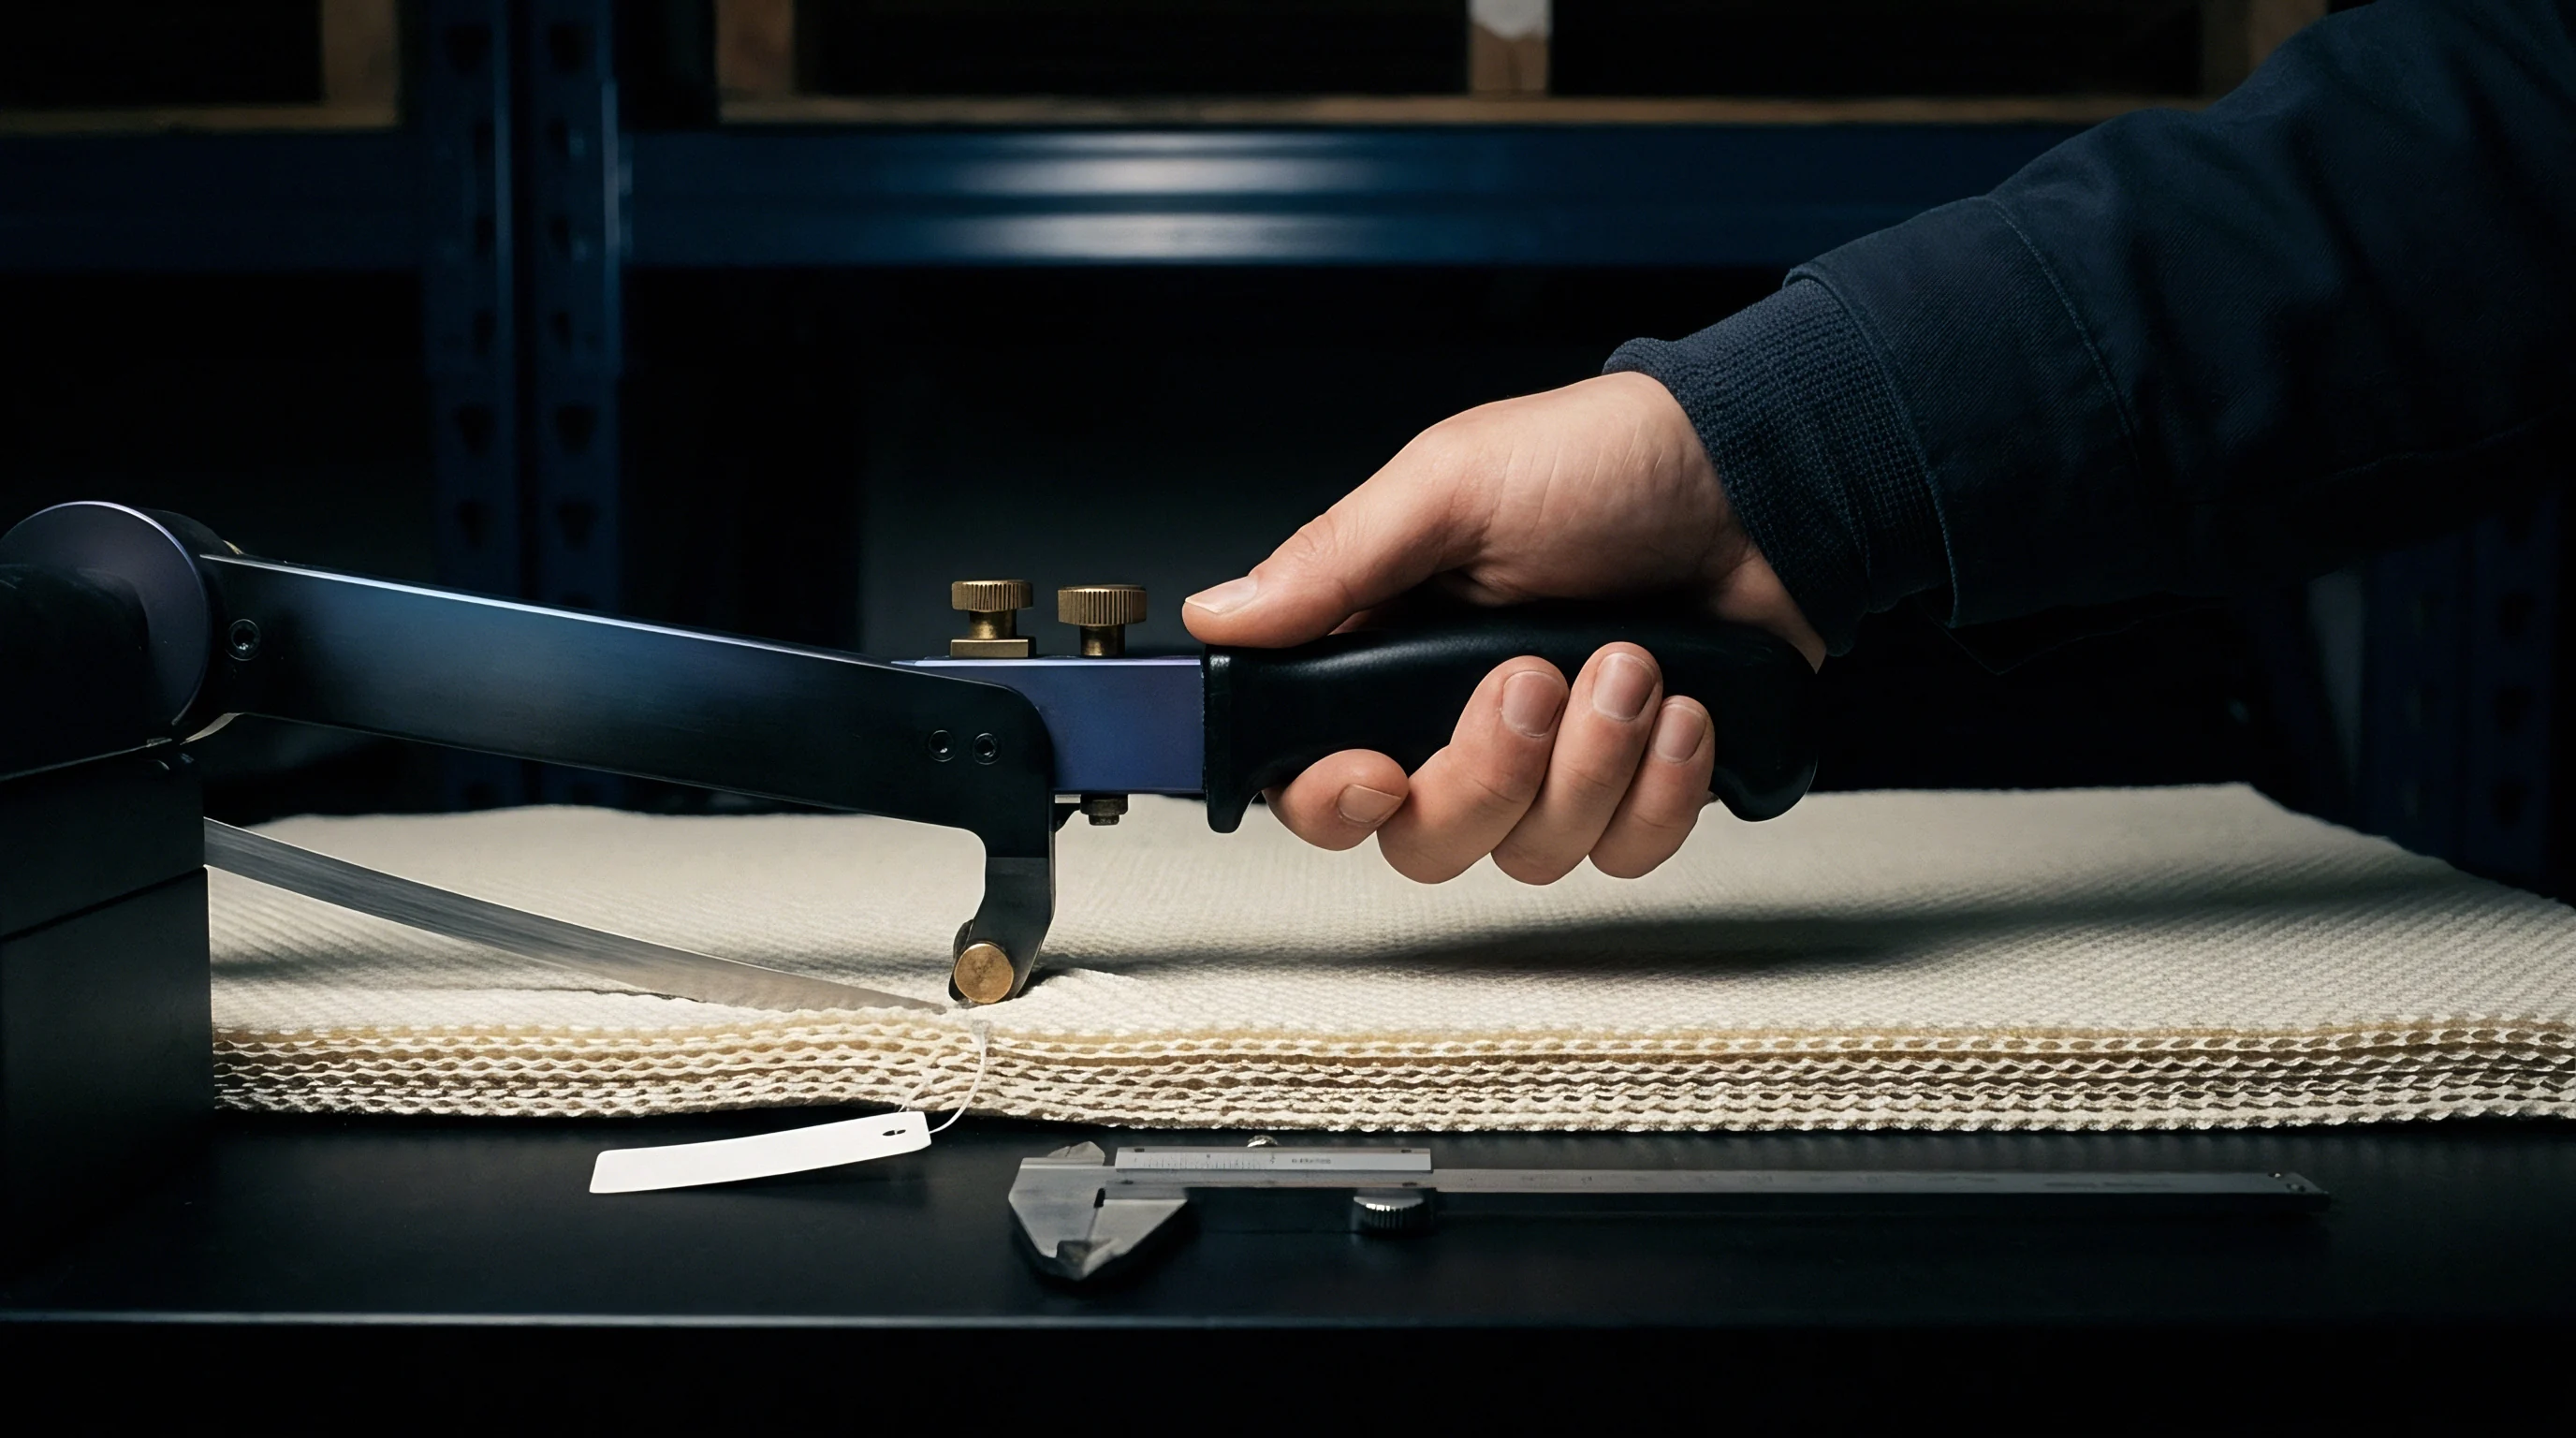
Could Composite Samples Conceal Isolated Hotspots?
Blending drawn cotton tufts into a single homogenized composite sample remains a widespread industry practice to lower laboratory testing expenses. When ten 25-gram samples drawn from ten separate bales are blended into a single 250-gram composite, an isolated, intensely contaminated bale containing 120 HSSD spots is mechanically diluted across nine clean bales containing zero spots. The composite sample returns a calculated average of 12 spots.
The lot is graded as lightly sticky and routed directly to high-speed ring spinning. Once mounted on the bale laydown, that single contaminated bale feeds into the plucking line, discharging concentrated bursts of trehalulose-rich tufts into the carding room every few hours, shutting down production lines.
Composite sampling masks extreme spatial variance and conceals dangerous hotspots. Acceptance protocols for heterogeneous contaminants must treat individual bales as discrete statistical units, evaluating the distribution of maximum values rather than relying on population means. The operational protocol must enforce testing on individual, unblended samples drawn across an audited sampling plan.
Homogenizing cotton into a single composite sample dilutes catastrophic localized honeydew hotspots into mathematically acceptable averages.
Designing an effective statistical acceptance plan requires selecting between single sampling, double sampling, or sequential sampling frameworks under an assumed Negative Binomial distribution. An ANSI/ASQ Z1.4 (ISO 2859-1) attribute sampling framework fails because it presumes independent, identically distributed defective items across an assembly line. For cotton stickiness, the variable of interest is not merely binary defective status, but the count of adhesive spots per unit mass.
The mathematical architecture of an individual bale acceptance plan employs an upper tolerance limit formulation. Let n represent the number of bales sampled from a lot of size N. Each sample of mass w (standardized at 2.5 grams on HSSD) yields a spot count x_i.
The lot is accepted if two distinct criteria are simultaneously satisfied:
Criterion A: The sample arithmetic mean x_bar does not exceed the contracted critical mean threshold mu_c.
Criterion B: The sample 90th percentile spot count, estimated via the fitted Negative Binomial parameters (r_hat, p_hat), does not exceed the maximum allowable hotspot threshold k_max.
Maximum likelihood estimation of the parameters r and p from the sample vector (x_1, x_2, x_n) proceeds via numerical iteration of the profile log-likelihood function:
ln L(r) = Sum + n r ln(r / (r + x_bar)) + Sum
Solving for the root where the derivative of the log-likelihood equals zero yields r_hat. The probability parameter is subsequently derived through:
p_hat = r_hat / (r_hat + x_bar)
With these parameters established, the cumulative distribution function yields the exact probability of any individual bale exceeding the machine failure threshold. If this probability exceeds the contracted Consumer’s Risk tolerance (beta, typically set at 0.05 or 0.10), the lot is rejected or re-graded into an inferior penalty band.

Are Sequential Plans Mathematically Viable for Stickiness?
Fixed-sample-size plans demand testing 30 to 50 individual bales per 100-bale lot to establish reliable confidence intervals under heavy overdispersion. The laboratory labor and testing equipment amortization costs associated with testing 50 samples per delivery can exceed the operating margins of the yarn. Sequential probability ratio tests (SPRT), derived from Wald’s classical formulations, reduce average sample numbers by 40 to 60 percent while preserving mathematical protection against heavy contamination.
In a sequential framework, the laboratory draws and tests an initial small batch of bales (for example, eight bales). The cumulative spot count is plotted against two parallel decision boundaries derived from the Negative Binomial log-likelihood ratio. If the cumulative count falls below the lower boundary line, the lot is accepted immediately without additional testing.
If the cumulative count crosses above the upper boundary line, the lot is rejected immediately. If the count falls between the two boundaries, the laboratory tests an additional three bales, updating the cumulative count until a boundary is crossed or a predetermined truncation limit (typically 24 bales) is reached.
The decision boundaries for a Negative Binomial SPRT are calculated from the baseline acceptable quality level (mu_0), the rejectable quality level (mu_1), and the assigned alpha and beta risks:
Intercept Lower: h_0 = ln(beta / (1 – alpha)) /
Intercept Upper: h_1 = ln((1 – beta) / alpha) /
Slope: s = r /
Deploying sequential testing concentrates laboratory testing capacity where uncertainty is highest: borderline lots with moderate, highly variable spot counts. Clean lots and severely contaminated lots are classified rapidly within the initial eight tests, preserving commercial capital and mill throughput.
The International Cotton Association rules dictate that commercial re-tests for arbitration must be drawn by an independent certified surveyor, with half the samples dispatched to an internationally recognized reference laboratory and half retained for seal verification.


Specimen

Worked Numerical Case for a Commercial Delivery
The following worked calculation defines the operational acceptance mechanics for a 200-bale delivery of raw upland cotton (nominal mass 45,400 kilograms). Assume a contract specification stipulating an Acceptable Quality Level (AQL) of mu_0 = 8 HSSD spots per 2.5 g test specimen, and a Rejectable Quality Level (RQL) of mu_1 = 22 spots. The contracted producer risk alpha is set to 0.05, and the consumer risk beta is fixed at 0.10.
An overdispersion parameter r = 1.8 is assumed, based on historical regional classing data for honeydew-prone harvesting zones.
Under a single-stage stratified sampling plan, the receiving facility cores 20 bales selected at uniform intervals across the ginning lot sequence. Testing duplicate 2.5-gram specimens per bale yields the following vector of mean HSSD spot counts across the 20 sampled bales:
Bale Spot Counts:
The sample arithmetic mean calculates as:
x_bar = (2 + 0 + 14 + 1 + 0 + 48 + 3 + 0 + 8 + 1 + 26 + 0 + 4 + 1 + 0 + 38 + 2 + 0 + 12 + 0) / 20 = 8.00 spots
Evaluating this shipment solely on sample mean indicates full contractual compliance. The calculated mean of 8.00 matches the AQL of mu_0 = 8.00 spots. A conventional quality control check based on linear averaging accepts the lot without penalty.
Examining the sample variance reveals severe underlying risk:
s^2 = Sum / (n – 1) = 3848.00 / 19 = 202.53
The variance-to-mean ratio equals 202.53 / 8.00 = 25.32, demonstrating extreme overdispersion and physical clumping. Fitting the sample data to the Negative Binomial model via maximum likelihood estimation produces r_hat = 0.385 and p_hat = 0.0459. This low shape parameter confirms an intensely aggregated distribution where the majority of bales contain near-zero contamination, but a critical fraction carries severe contamination.
The contractual hotspot clause dictates that the proportion of bales in the lot exceeding an HSSD spot count of 35 spots must not exceed 2.0 percent with 95 percent confidence. Utilizing the fitted cumulative distribution function:
P(X > 35) = 1 – Sum for k = 0 to 35
Evaluating the Negative Binomial CDF with r = 0.385 and p = 0.0459 yields:
P(X
P(X > 35) = 1 – 0.9082 = 0.0918 (9.18 percent)
The statistical analysis proves that approximately 9.18 percent of the bales in this shipment carry severe, machine-stopping honeydew contamination. Across the 200-bale lot, an estimated 18 bales contain spot counts above 35. Injecting 18 heavily sticky bales into an unsegregated blowroom laydown causes catastrophic card loading and roller laps.
Application of the dual-criteria acceptance plan triggers immediate lot rejection under Criterion B, despite the sample mean perfectly matching the AQL under Criterion A. The buyer avoids processing failure by executing the contractual penalty schedule, issuing an immediate notice of arbitration to the merchant.
Whether testing facilities will universally adopt automated high-speed thermodynamic scanners that record spatial coordinates alongside total spot counts remains an open question in international cotton standardization.