Lab Dip Approval against Bulk Shade under Three Illuminants
Tri-illuminant shade approval aligns lab dips with bulk by enforcing primary D65 visual matching alongside secondary TL84 and Illuminant A metameric tolerances.
Chamber
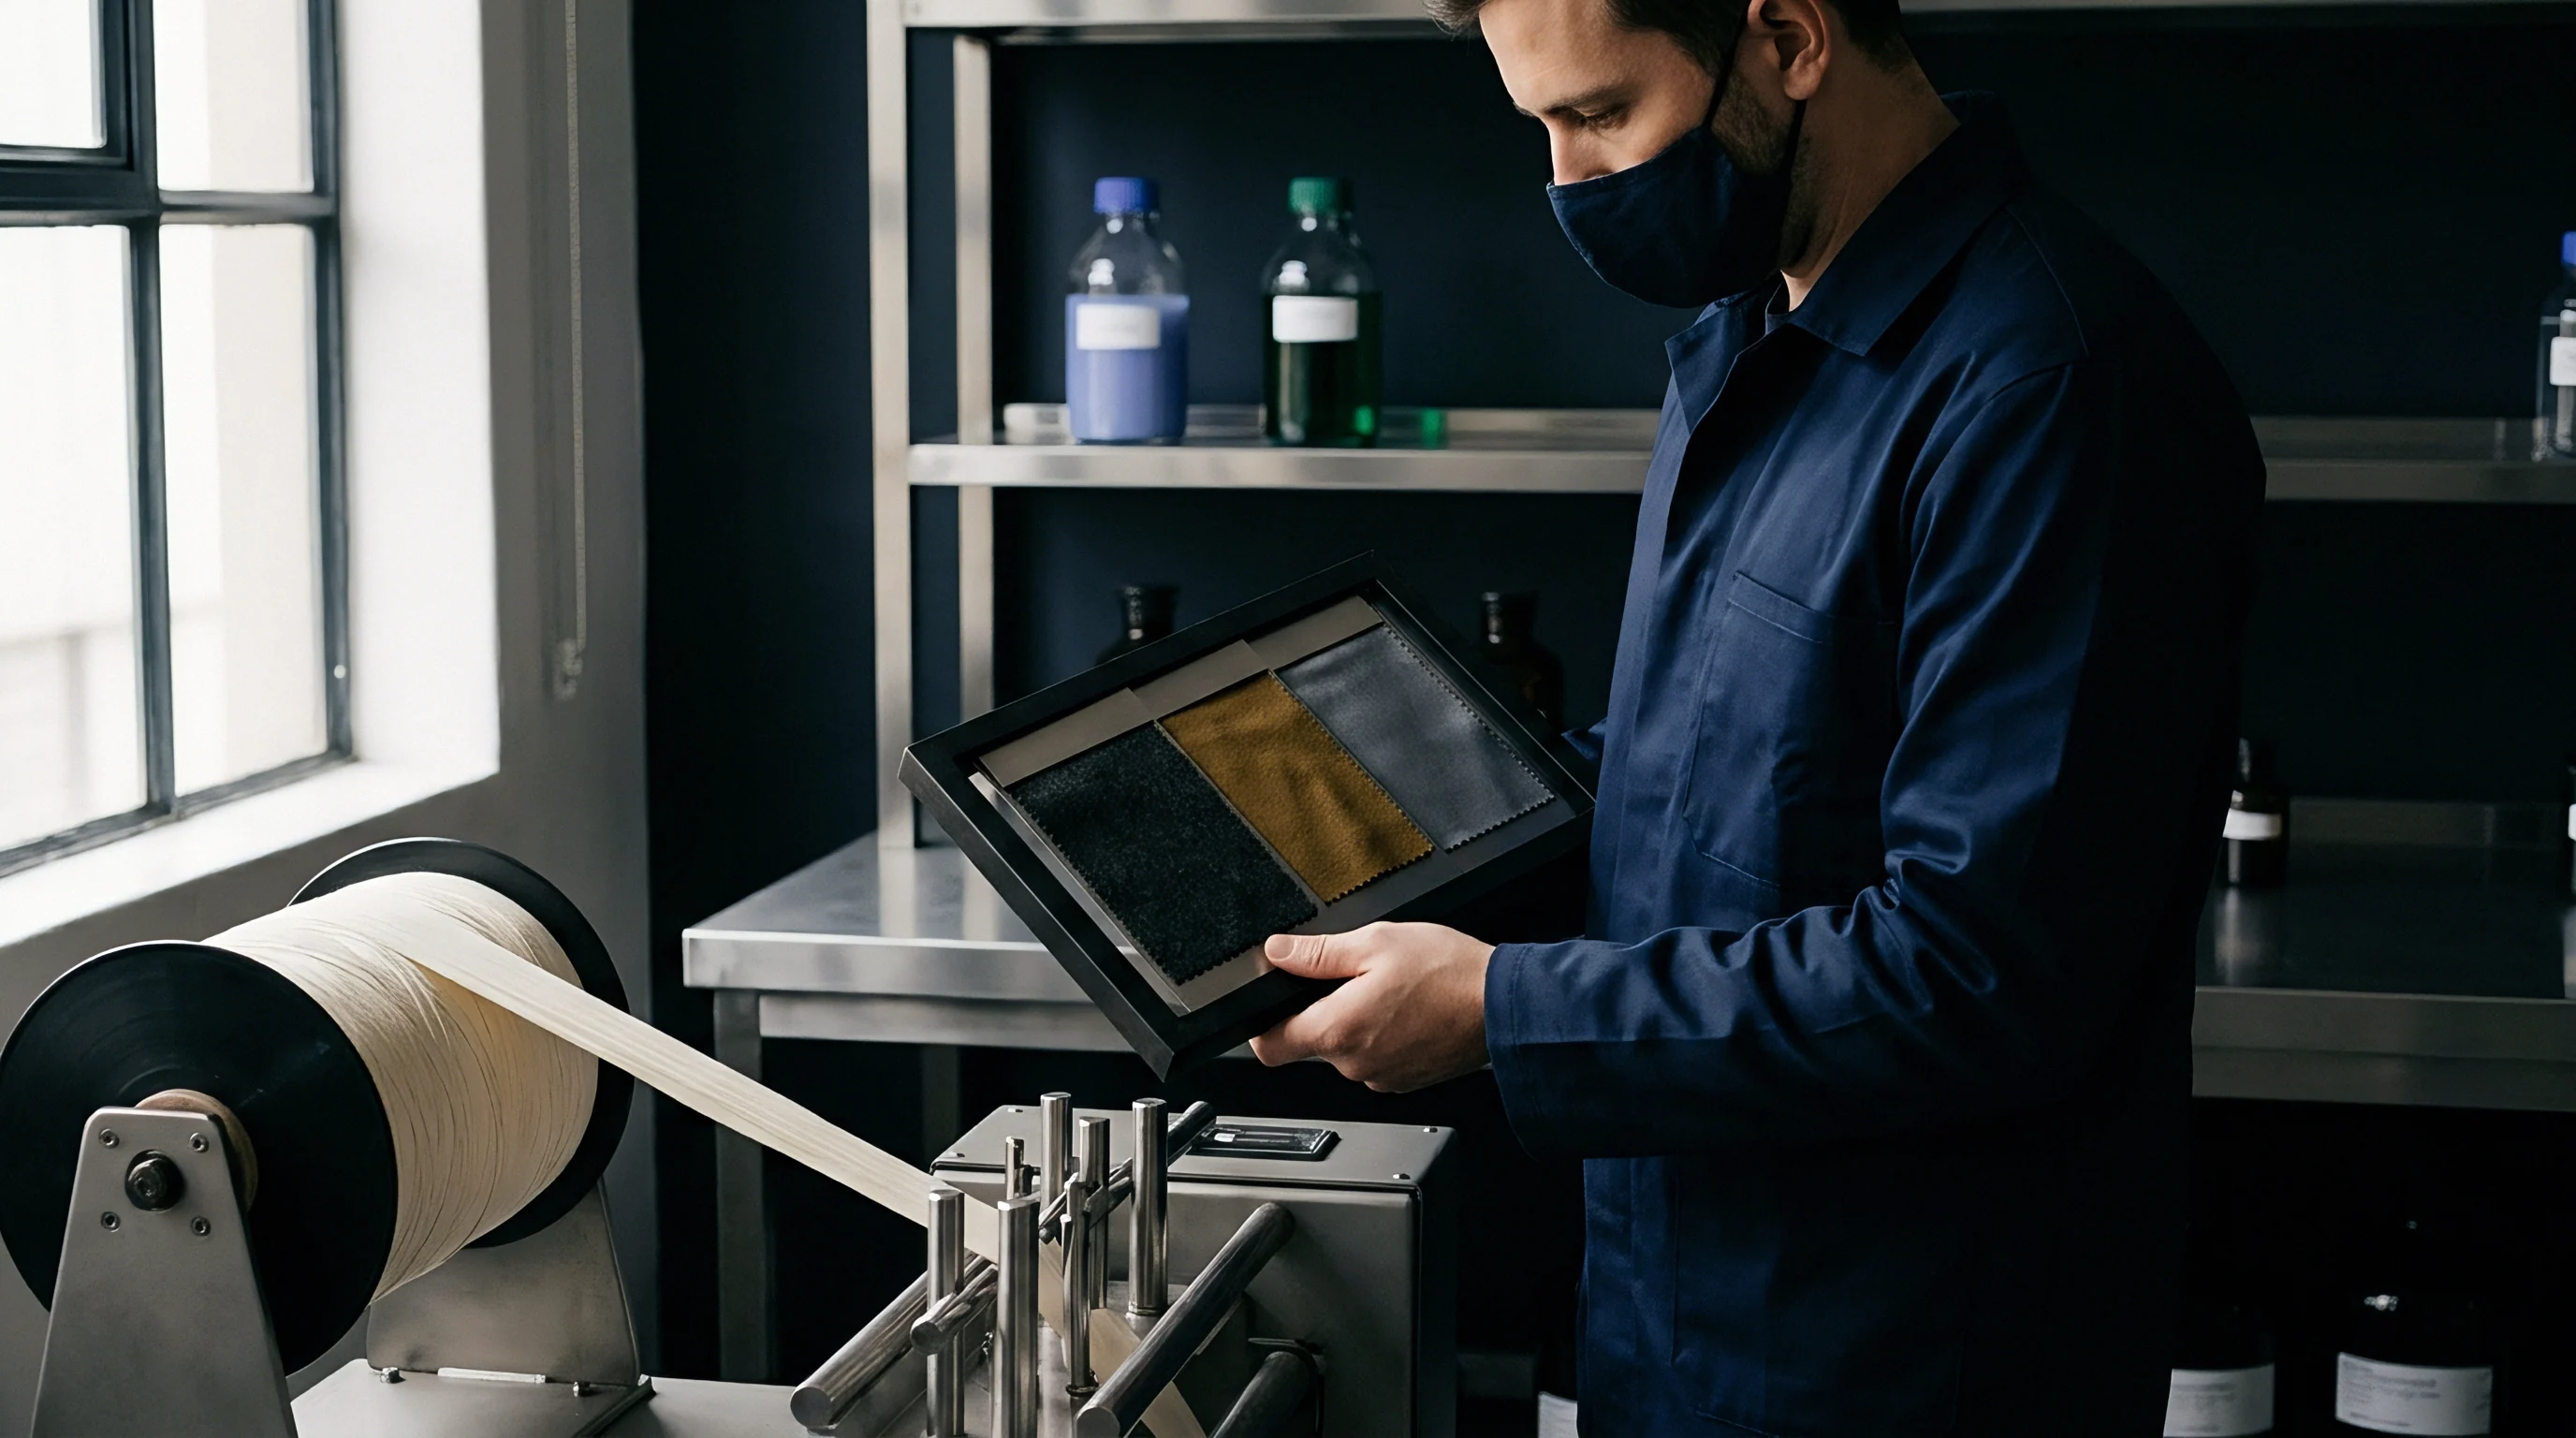
Evaluating shade under three distinct light sources isolates metameric color shifts before bulk fabric enters wet processing. Standard viewing booths house calibrated light sources mounted inside an enclosure coated with neutral grey matte paint, formulated to Munsell N7 or Munsell N8 standards. The primary light source serves as the commercial reference point for initial color matching.
Secondary and tertiary sources show whether two samples that appear to match under daylight diverge when illuminated by store fluorescents or residential incandescent bulbs. Proper assessment relies on controlled viewing geometry, complete ambient light exclusion, and disciplined tracking of lamp operating hours.
The primary source in modern color matching setups is CIE Standard Illuminant D65, representing average daylight with a correlated color temperature of approximately 6500 Kelvin. D65 contains a balanced spectral power distribution spanning ultraviolet through far-red wavelengths. In critical evaluations, filtered tungsten-halogen or calibrated multi-phosphor fluorescent lamps reproduce this spectral distribution.
A light booth that fails to provide correct ultraviolet emission yields misleading readings on textiles treated with optical brightening agents. When whitening agents absorb ultraviolet radiation and re-emit it in the blue visible spectrum, a lab dip evaluated under a UV-deficient D65 simulator displays a duller, redder cast than in natural daylight.
ASTM D1729 specifies an ambient illuminance level between 1080 and 1340 lux at the viewing plane for critical visual appraisal of textile color difference.
The secondary illuminant reflects the retail store environment where the finished textile product meets the end consumer. For decades, international retailers designated CIE Illuminant F02, commonly known as Cool White Fluorescent (CWF) at 4150 Kelvin, or narrow-band fluorescent lamps such as TL84 (F11) at 4000 Kelvin as their secondary appraisal standard. Modern supply agreements frequently replace or supplement these older discharge lamps with standardized narrow-spectrum light-emitting diode (LED) sources calibrated to 3000 Kelvin, 3500 Kelvin, or 4000 Kelvin.
Store fluorescents and retail LEDs display distinct emission spikes in the green, yellow, and red bands. Two dye recipes that reflect light identically under daylight can absorb and reflect these localized emission spikes in completely different proportions.
The tertiary light source assesses home interior conditions, represented almost universally by CIE Standard Illuminant A. Illuminant A is an incandescent tungsten filament lamp operating at a correlated color temperature of 2856 Kelvin. Its spectral emission curve rises smoothly from minimal output in the blue region to maximum energy output in the deep red and infrared spectrum. Under Illuminant A, yellow, orange, and red dyestuff components dominate the reflected light.
If a lab dip relies on a metameric dye recipe compared to the original standard, the incandescent filament illuminates the difference instantly, throwing the bulk fabric noticeably off shade.
| Illuminant Designation | Correlated Color Temp | Dominant Spectral Region | Commercial Function | Toleranced Variance |
|---|---|---|---|---|
| CIE D65 | 6500 K | Balanced full-spectrum with controlled UV | Primary approval reference across all global textile mills | Delta E 0.50 CMC 2 to 1 |
| TL84 / F11 | 4000 K | Tri-phosphor emission spikes at 435, 545, 610 nm | Secondary retail point-of-sale assessment for European apparel | Delta E 0.80 CMC 2 to 1 |
| CWF / F02 | 4150 K | Broad-band halophosphate discharge spectrum | Secondary retail assessment for North American department stores | Delta E 0.80 CMC 2 to 1 |
| Illuminant A | 2856 K | Continuous thermal incandescent ramp toward infrared | Tertiary residential lighting test for shade stability | Delta E 1.00 CMC 2 to 1 |
| Retail LED | 3000 K to 4000 K | Blue pump phosphor with customizable red rendering | Emerging secondary standard for modern commercial storefronts | Delta E 0.70 CMC 2 to 1 |
Viewing geometry inside the cabinet governs the consistency of every visual shade decision. The observer positions test swatches side by side on a 45-degree tilted table with illumination striking the surface perpendicularly at a zero-degree angle, or illuminates the sample at 45 degrees while viewing at zero degrees normal to the surface. Swatches placed flat on the bottom of the cabinet produce uncontrolled specular reflections that bleach color saturation.
The human eye evaluates both specimens simultaneously across a hairline split without overlap. Light booths lose calibration as lamps age, since fluorescent tubes and incandescent bulbs degrade in lumen output and shift their correlated color temperature over time.
Dyehouse technicians track lamp service hours through digital elapsed-time counters mounted on the cabinet housing. Fluorescent tubes lose their specified phosphor output after 2000 hours of active illumination, requiring complete replacement across the entire array. Replacing individual tubes piecemeal creates uneven lighting gradients across the interior deck.
Evaluating a strike-off on the left side of the booth and a master standard on the right under mixed-age tubes invalidates the visual result. Facility audits check the physical interior of the light chamber for paint scratches, dust accumulation on diffusers, and unauthorized sample trays that introduce foreign reflections.
Standardized commercial supply agreements incorporate ISO 105-J01, stating that visual approvals remain conditional until spectrophotometric reflectance values verify that primary D65 delta values, secondary retail illuminant shifts, and tertiary Illuminant A variations fall within mutually accepted numerical envelopes.
Curve
Spectrophotometers record spectral reflectance across the visible wavelength spectrum between 360 and 750 nanometers at 10-nanometer intervals. Achieving a true physical color match requires the spectral reflectance curves of the approved lab dip and the bulk production dyeing to overlap across every recorded wavelength. When two dyed fabrics display identical spectral curves, they match under daylight, incandescent light, and fluorescent lamps alike.
Production dye formulations rarely achieve complete curve overlap, however, because differing dye structures, concentration variations, and fiber auxiliaries alter light absorption at localized wavelengths.
Metamerism occurs when two specimens match in color under one specific light source but display visible color differences under another. This happens because the human eye relies on three types of cone photoreceptors sensitive to long, medium, and short visible wavelengths, with the visual cortex integrating signals from these receptors into a single color perception. Two distinct spectral reflectance profiles can excite cone receptors in identical proportions under daylight, producing the same perceived shade.
When the illuminant changes, the differing spectral energy distributions of the new light source alter reflected energy at specific wavelengths, causing unequal stimulation of the photoreceptors and breaking the match.
Formulating a lab dip requires selecting three or four compatible dyestuffs that build a balanced recipe. A dyer matching an olive-drab standard might choose a trichromatic mixture of a disperse yellow, a disperse red, and a disperse blue. If the dyer selects a yellow dye with a steep reflectance peak near 520 nanometers while the customer original used a yellow dye peaking at 580 nanometers, the two formulations can balance out to look identical under D65 daylight.
Under Illuminant A, excess red radiation exposes the chemical mismatch, turning the lab dip distinctly orange while the original standard retains its neutral green cast.
ISO 105-J03 establishes the mathematical basis for total color difference calculations under the CMC l:c formula, defining elliptical tolerance volumes around target color coordinates.
Spectrophotometric software calculates the Metamerism Index (MI) to quantify color changes across illuminant switches. The system computes CIELAB or CMC color difference coordinates under the primary illuminant, then recalculates chromatic coordinates under secondary and tertiary light sources. The gap between the primary delta value and the secondary delta value represents the degree of metamerism.
A high metamerism index indicates that the bulk production dye recipe deviates chemically from the target standard, a frequent issue when mills rely on cheap dyestuff combinations to lower formulation costs.
The choice of dye class dictates the boundaries of metamerism control, with fiber blends posing steep challenges on the dyehouse floor:
- Cotton polyester blends require a two-bath or single-bath two-stage dyeing process utilizing reactive dyes for cellulose and disperse dyes for synthetic filaments, increasing formulation complexity across both fiber components.
- Wool nylon blends depend on acid or metal-complex dyes whose strike rates vary dramatically with bath pH, causing differential dye uptake that shifts the total reflectance curve under incandescent light.
- Direct dyes on viscose generate broader reflectance peaks than fiber-reactive vinyl sulfone dyes, making cross-illuminant matching against reactive-dyed standards mathematically impossible across secondary store LED lights.
- Cationic dyeings on acrylic produce steep spectral slopes that yield vivid shades under daylight but tend to flare toward harsh red-violet tones when exposed to low-kelvin tungsten sources.
Spectrophotometric instruments utilize either diffuse 8-degree (d/8) or 45/0 optical geometries. In d/8 instruments, an integrating sphere coated with barium sulfate illuminates the fabric sample diffusely from all angles, while a detector reads reflected light at an angle of 8 degrees from the perpendicular. The spectrophotometer operates in Specular Component Included (SPIN) or Specular Component Excluded (SPEX) mode.
SPIN mode measures total color reflectance independent of surface texture, whereas SPEX mode excludes mirror-like surface reflection. Woven fabrics with high surface sheen, such as cotton sateens or filament polyester satins, produce large numerical divergences between SPIN and SPEX readings. Approving a lab dip using SPIN mode while inspecting bulk lots in SPEX mode introduces systematic acceptance errors.
Textile buyers define acceptable color variance using CMC l:c or CIE DE2000 mathematical color difference formulas. The CMC formula adjusts tolerance ellipsoids based on the position of the target color in CIELAB color space. Darker and more saturated shades permit larger absolute coordinate shifts before the human eye detects an objectionable deviation, whereas pale neutral greys, tans, and pastels demand tight numerical limits.
The lightness-to-chroma ratio (l:c) is set to 2:1 for visual apparel evaluation, giving twice the tolerance to lightness variations as to chroma differences. A bulk lot passing a total CMC Delta E of 0.60 under D65 daylight can register a CMC Delta E of 1.40 under Illuminant A, exceeding commercial acceptance limits and causing garment panel mismatch on the retail floor.
Failing to catch and correct metameric formulation errors during the lab dip stage leads to garment rejections at retail distribution hubs, where cut panels sourced from different production runs appear mismatched under store fixtures and trigger heavy commercial chargebacks.
Liquor
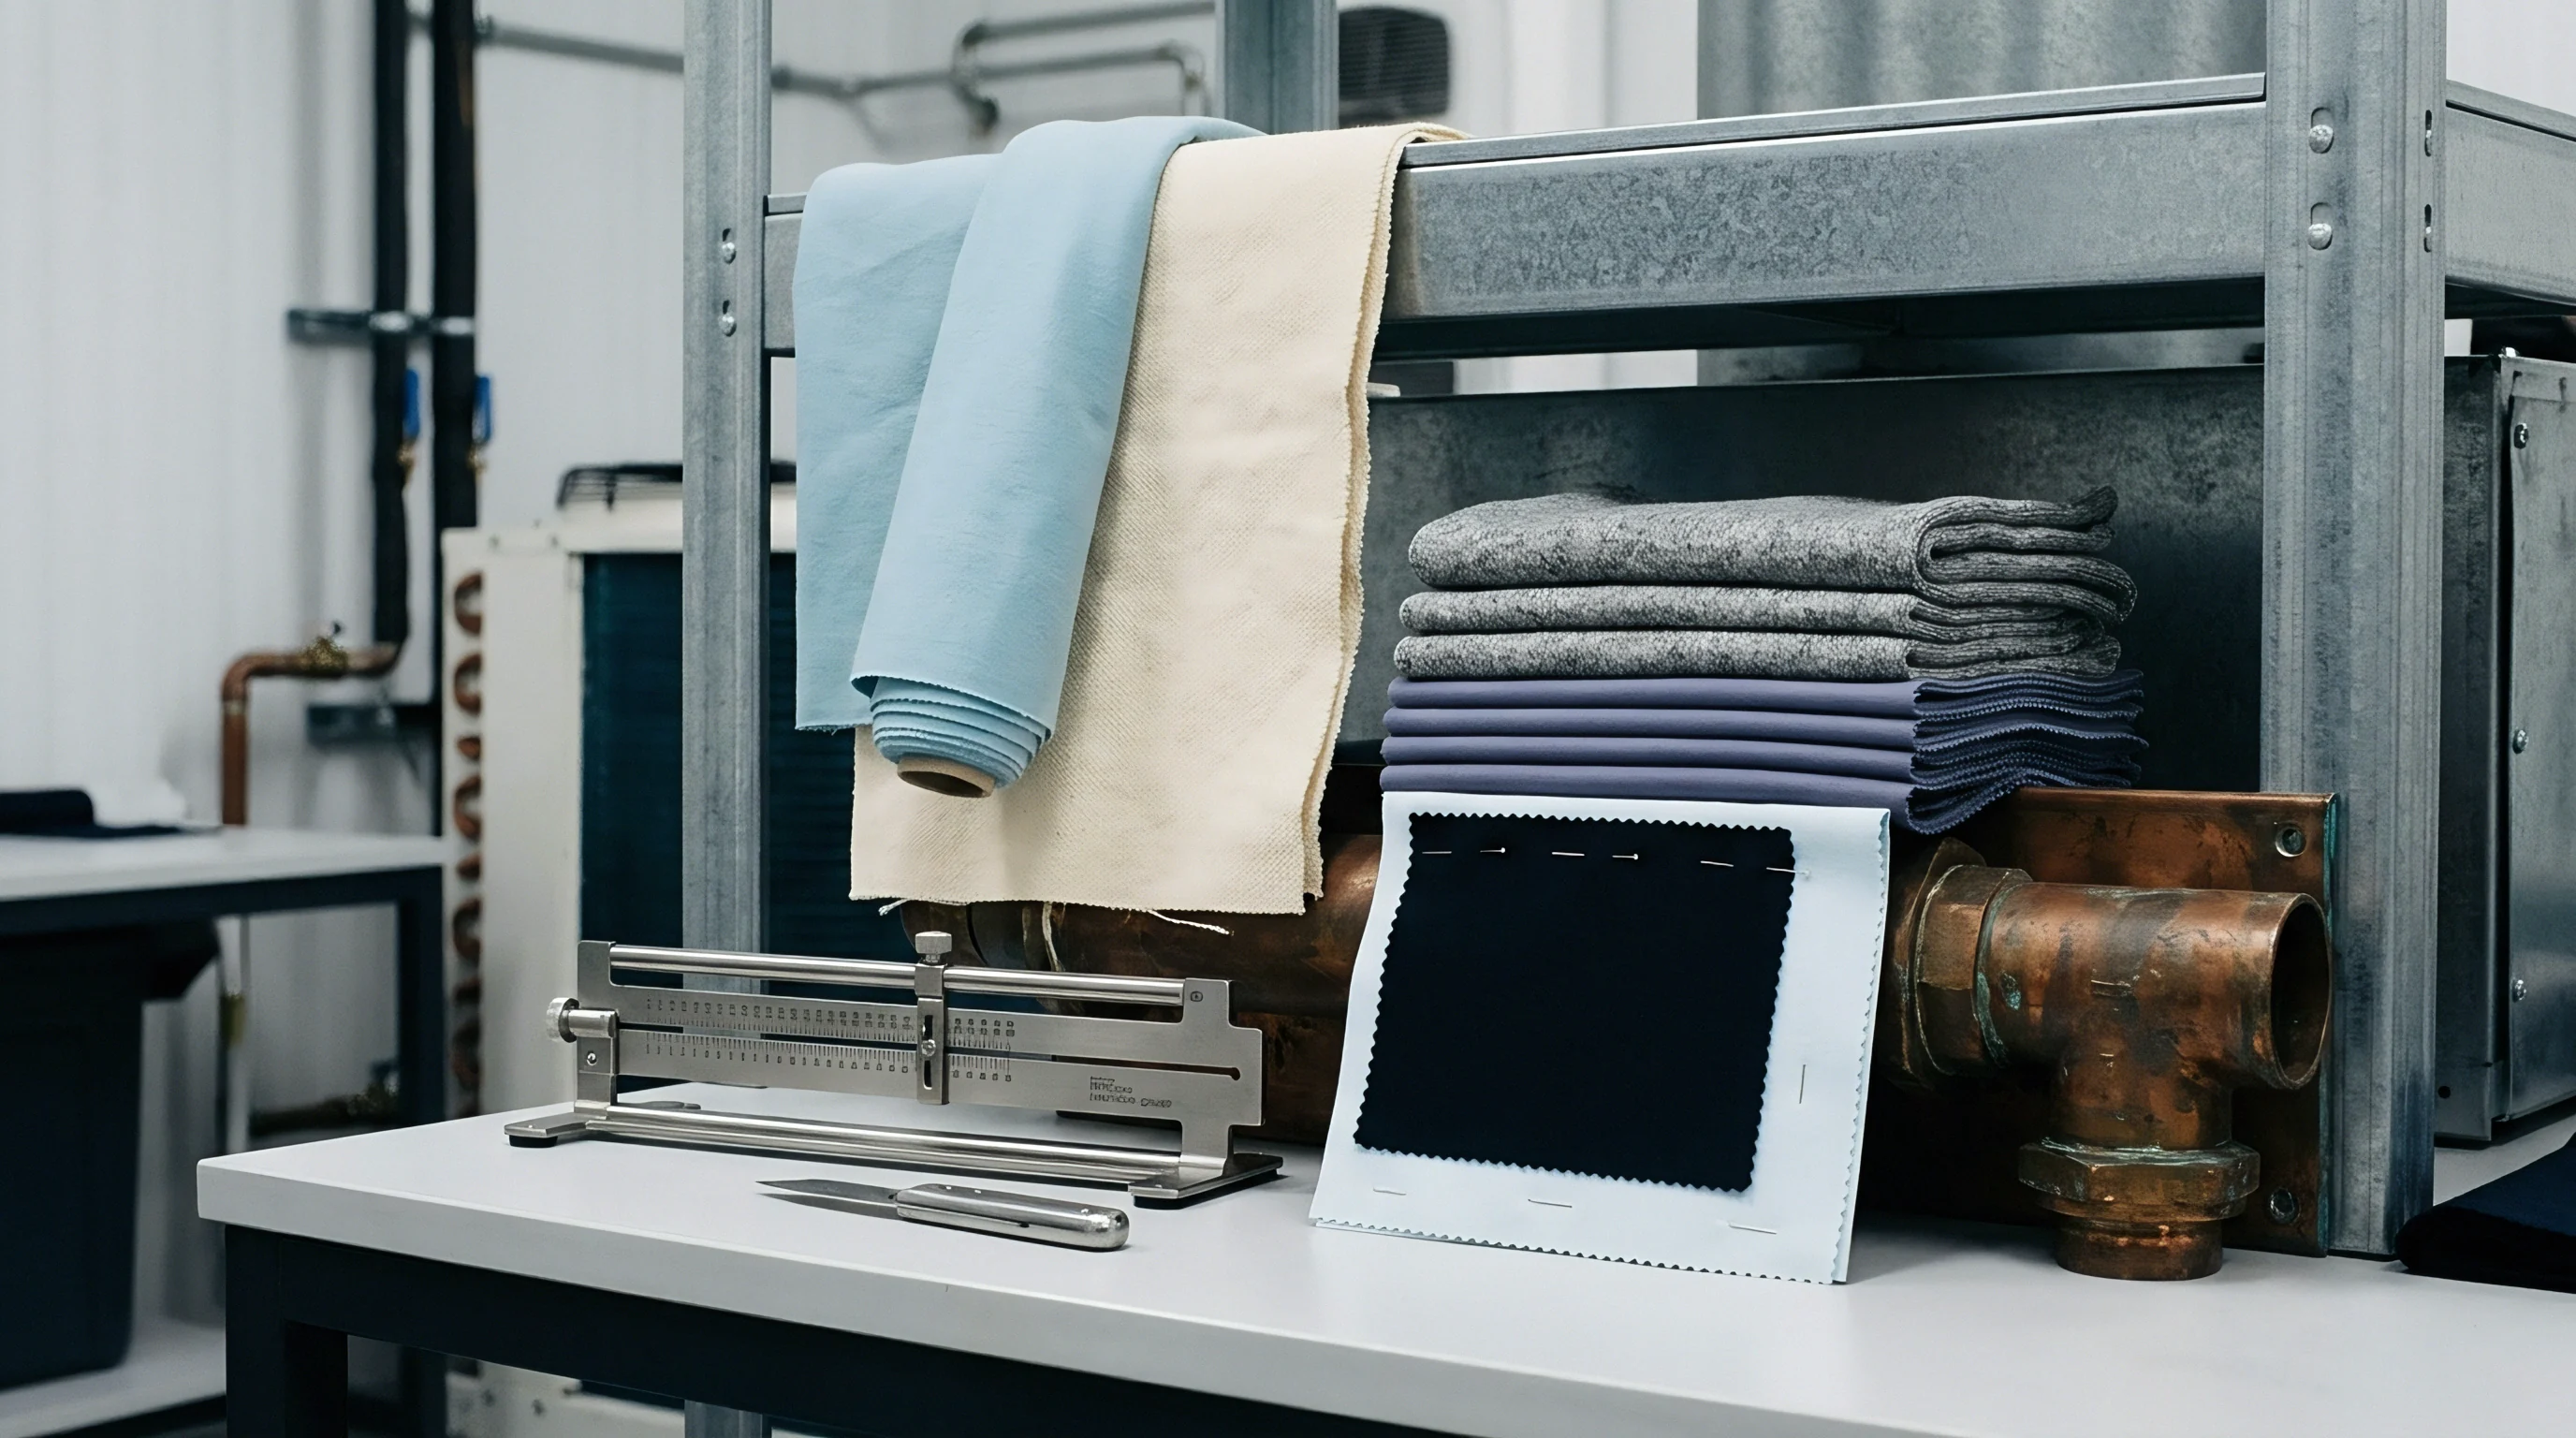
Scaling a dye formula from a 250-milliliter laboratory beaker to a 500-kilogram industrial dye vessel introduces chemical and physical dynamics that alter color yield. Lab dip machines agitate glass or stainless steel beakers inside a heated glycol or infrared chamber, running liquor ratios between 1:10 and 1:20 to permit fluid circulation around tiny five-gram swatches. Industrial production vessels operate on entirely different scales.
Modern aerodynamic jet dyeing machines process bulk rope fabrics at liquor ratios between 1:4 and 1:6, while continuous pad-dry-steam ranges deposit dye liquor at wet pick-up rates of 60 to 70 percent of dry fabric weight.
Liquor ratio variations shift the chemical equilibrium of exhaustion dyeing. Reactive dyes on cotton depend on inorganic electrolytes, such as sodium sulfate or sodium chloride, to overcome the negative zeta potential of cellulose fibers. In a laboratory beaker at a 1:15 liquor ratio, the absolute concentration of dissolved salt and alkali per gram of fabric must be higher to drive dye exhaustion into the fiber core.
When the mill transfers that identical percentage recipe to a low-liquor jet machine, the reduced water volume concentrates dyes and chemicals, accelerating exhaustion rates. Hydrolysis of reactive dyes increases unless alkali dosing is adjusted, leaving unfixed hydrolyzed dyestuff that shifts the final bulk shade if wash-off rinsing falls short.
Will Spectrophotometer Data Supersede Visual Assessment in Commercial Rejections?
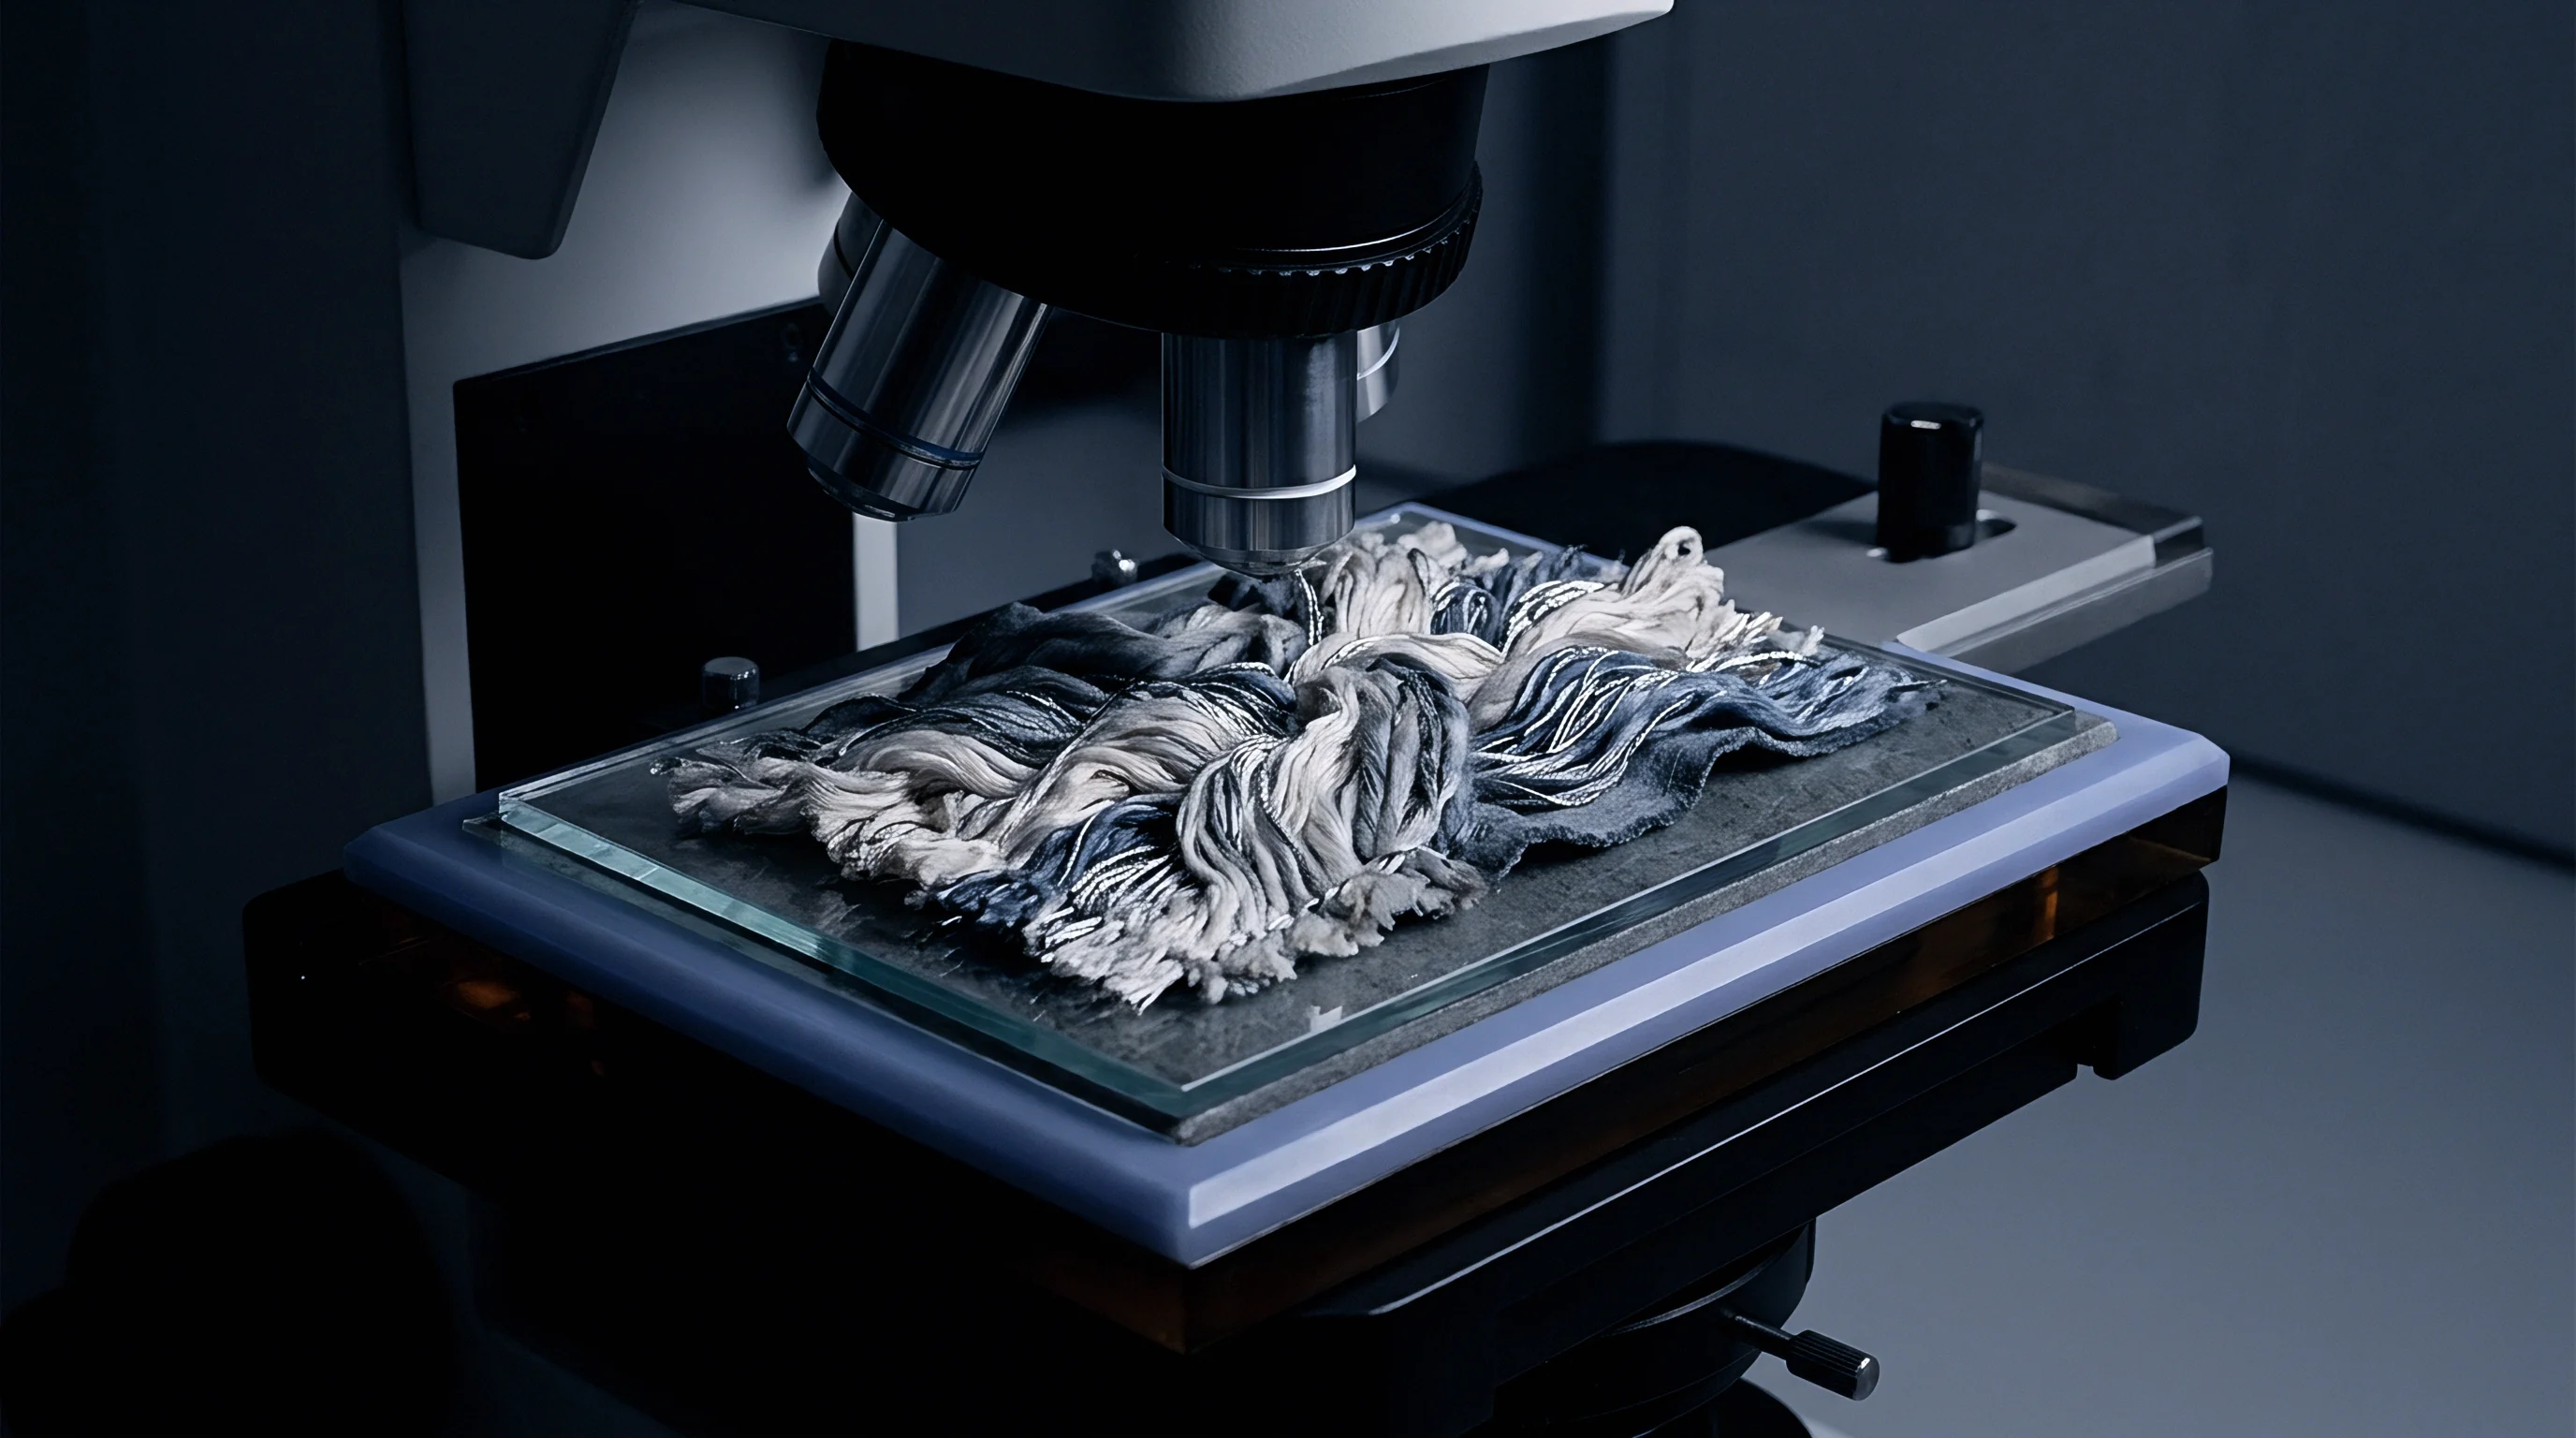
Modern commercial contracts establish instrumental spectrophotometry as the primary objective baseline, but visual assessment inside the light chamber remains the deciding factor for legal settlement. Spectrophotometers read a discrete circular aperture measuring between 10 and 25 millimeters in diameter, averaging reflectance within that confined area. The human eye views several square yards of fabric at once, integrating macroscopic surface variations, weave texture, fiber luster, and ambient shadows.
A fabric achieving a pass rating of CMC Delta E 0.45 under an instrument aperture can still exhibit visible streaks, side-to-center shading, or a two-tone cast when viewed across an inspection table under TL84 lighting.
Validating bulk production against an approved lab dip follows a strict sequence of operational steps:
- Laboratory recipe dispensing utilizes robotic micropipettes to measure stock dye solutions within a tolerance of plus or minus 0.001 grams, producing three distinct lab dip options labeled A, B, and C with slight trichromatic offsets.
- Customer visual selection identifies the best match under primary D65 daylight, followed by secondary store lighting and tertiary incandescent verification inside a certified viewing cabinet.
- Dyehouse pilot scaling runs a 50-meter sample length through a sample jet or single-rope vessel to establish true liquor exhaustion, leveling dynamics, and stenter thermal shifts before loading multi-port bulk machines.
- Bulk lot extraction takes representative head-end and tail-end fabric cuttings across the full width of the dyed piece after final drying, conditioning the textile for four hours at standard atmosphere.
- Instrumental verification reads four distinct locations per cutting under d/8 geometry, recording delta coordinates across D65, TL84, and Illuminant A to ensure complete compliance before shipping approval.
Dye compatibility factors dictate level exhaustion across bulk vessel cycles. Dyes mixed in a trichromatic recipe must exhibit identical strike rates, diffusion coefficients, and fixation temperatures. If a recipe combines a rapidly diffusing reactive yellow with a slow-diffusing reactive blue, the yellow strikes the fiber quickly during initial heating while the blue remains in the bath liquor.
In laboratory beakers with rapid heating cycles, temperature ramps occur quickly. In a 500-kilogram jet machine, heating two metric tons of water at 1.5 degrees Celsius per minute creates thermal gradients across the rope bundle. The fast-striking dye deposits unevenly, creating localized shade variations across the length of the fabric bolt.
| Processing Parameter | Laboratory Beaker | Sample Pilot Vessel | Bulk Production Jet | Continuous Pad Range |
|---|---|---|---|---|
| Batch Size | 5 to 10 grams | 20 to 50 kilograms | 300 to 1000 kilograms | 2000 to 10000 meters |
| Liquor Ratio | 1:10 to 1:20 | 1:8 to 1:12 | 1:4 to 1:6 | 1:0.7 wet pick-up |
| Heating Rate Control | Direct electrical ramp | Internal steam coil | External heat exchanger | Infrared pre-dryer |
| Agitation Mechanism | Magnetic or oscillating bar | Mechanical reel | Venturi nozzle fluid flow | Nip squeeze roller |
| Salt Concentration (g/L) | 50 to 80 g/L | 40 to 60 g/L | 30 to 50 g/L | Not applicable |
| Fixation Efficiency | 65 to 75 percent | 70 to 80 percent | 78 to 88 percent | 85 to 92 percent |
Dyehouse managers encounter difficulties when explaining why bulk lots fail to duplicate the approved lab dip. When challenged on a shade shift under secondary lighting, dyehouse technicians often attribute the variance to differences between fresh dyestuff lot standards used in laboratory beakers and older commercial barrels with degraded moisture content used in bulk vessels.

Substrate
Fabric construction parameters exert direct influence over perceived shade, reflectance geometry, and dye exhaustion. Greige goods arriving from the weaving shed or knitting mill carry structural variations that alter surface reflectance. A twill weave, such as a 3/1 cotton drill, presents raised diagonal wales that scatter incident light in preferential directions.
A plain weave poplin of identical yarn count and weight scatters light uniformly. When viewing a twill weave under direct light in a viewing cabinet, rotating the sample 90 degrees alters perceived depth of shade by up to one full CMC Delta E unit, even when chemical dye concentration across the yarns is identical.
Yarn structure alters optical depth through internal light scattering. Ring-spun yarns possess a smooth helical fiber orientation with minimal surface hairiness, creating clear optical reflectance. Open-end rotor yarns feature disordered wrapper fibers and loose surface structures that trap incident light, making an identical dye concentration appear darker and less saturated.
Filament yarns present extreme optical sensitivity. Highly twisted polyester yarns reflect less light than low-twist flat filaments. Microdenier polyester fibers, measuring below 1.0 denier per filament, possess vast specific surface areas compared to standard 2.5-denier fibers.
A microdenier fabric requires between 1.5 and 2.5 times the quantity of dyestuff to achieve the visual depth of shade of a standard filament fabric because increased fiber surface area scatters light out of the substrate before it penetrates deeply into the polymer matrix.
ISO 3801 defines mass per unit area measurement, which standardizes substrate weight calculations before wet processing adjustments are applied.
Chemical preparation steps prior to dyeing establish the baseline absorption properties of the substrate. In cellulose processing, mercerization alters fiber morphology permanently. Immersion in cold sodium hydroxide solution at 28 to 30 degrees Baume swells the kidney-shaped cotton lumen into a cylindrical cross-section, uncoiling natural fiber convolutions.
This structural change increases light transmission into the fiber interior while reducing light scattering from surface irregularities. Mercerized cotton yields deeper, more lustrous shades, consuming 20 to 30 percent less dyestuff than unmercerized cotton to achieve the same visual depth. If the degree of mercerization varies across a bulk lot, or if the lab dip was struck on mercerized greige while bulk production utilizes unmercerized stock, the two fabrics cannot match across multiple light sources.
Residual optical brightening agents (OBAs) introduced during greige yarn spinning or preparation bleaching contaminate shade matching. An OBA absorbs invisible ultraviolet energy between 340 and 380 nanometers and re-emits blue light between 420 and 460 nanometers. When a dyer matches a pale pastel shade on an OBA-contaminated substrate, the emitted blue light counteracts the yellow components of the dye recipe.
The visual match appears acceptable under D65 daylight containing ultraviolet radiation. When moved to Illuminant A or an incandescent tungsten bulb devoid of ultraviolet energy, the optical brightener stops fluorescing. The blue emission vanishes, leaving the bare dye formulation exposed, and the fabric instantly shifts to an off-tone yellow-green shade.
Finishing chemicals applied on the stenter frame after dyeing alter the refractive index at the fabric-air boundary:
- Silicone softeners coat fiber surfaces with a low-refractive-index polymer film that increases light transmission into the yarn, deepening perceived shade by 5 to 15 percent.
- Fluorochemical water repellents increase surface scattering and cause subtle yellowing under high-temperature curing, altering pastel balance under fluorescent sources.
- Melamine resin crosslinkers applied for crease-resistance reduce internal fiber moisture content, shifting reactive dye reflectance values toward lighter, redder coordinates.
- Polyurethane back-coatings penetrate the inter-yarn voids of lightweight fabrics, eliminating translucency and creating a flattened, darkened cast under normal lighting.
Thermal exposure during drying and curing moves dyestuff molecules within synthetic fibers. Disperse dyes on polyester undergo sublimation and thermal migration when exposed to stenter temperatures exceeding 180 degrees Celsius. Dyestuff dissolved within the amorphous regions of the polyester polymer migrates to the fiber surface, where it deposits as microscopic crystal aggregates.
This surface aggregation alters the spectral reflectance profile completely, reducing wash fastness and causing severe metameric shifts under store lighting. If the laboratory beaker sample was dried in a static hot-air oven while the bulk fabric experienced high-speed stenter drying under intense tension and hot air nozzles, the surface dye distributions diverge.
Greige fabric specifications control the ultimate optical outcome: a dye recipe approved on one yarn count, twist factor, and cover sett will fail when executed on a different construction despite consuming identical chemical concentrations.
Variance
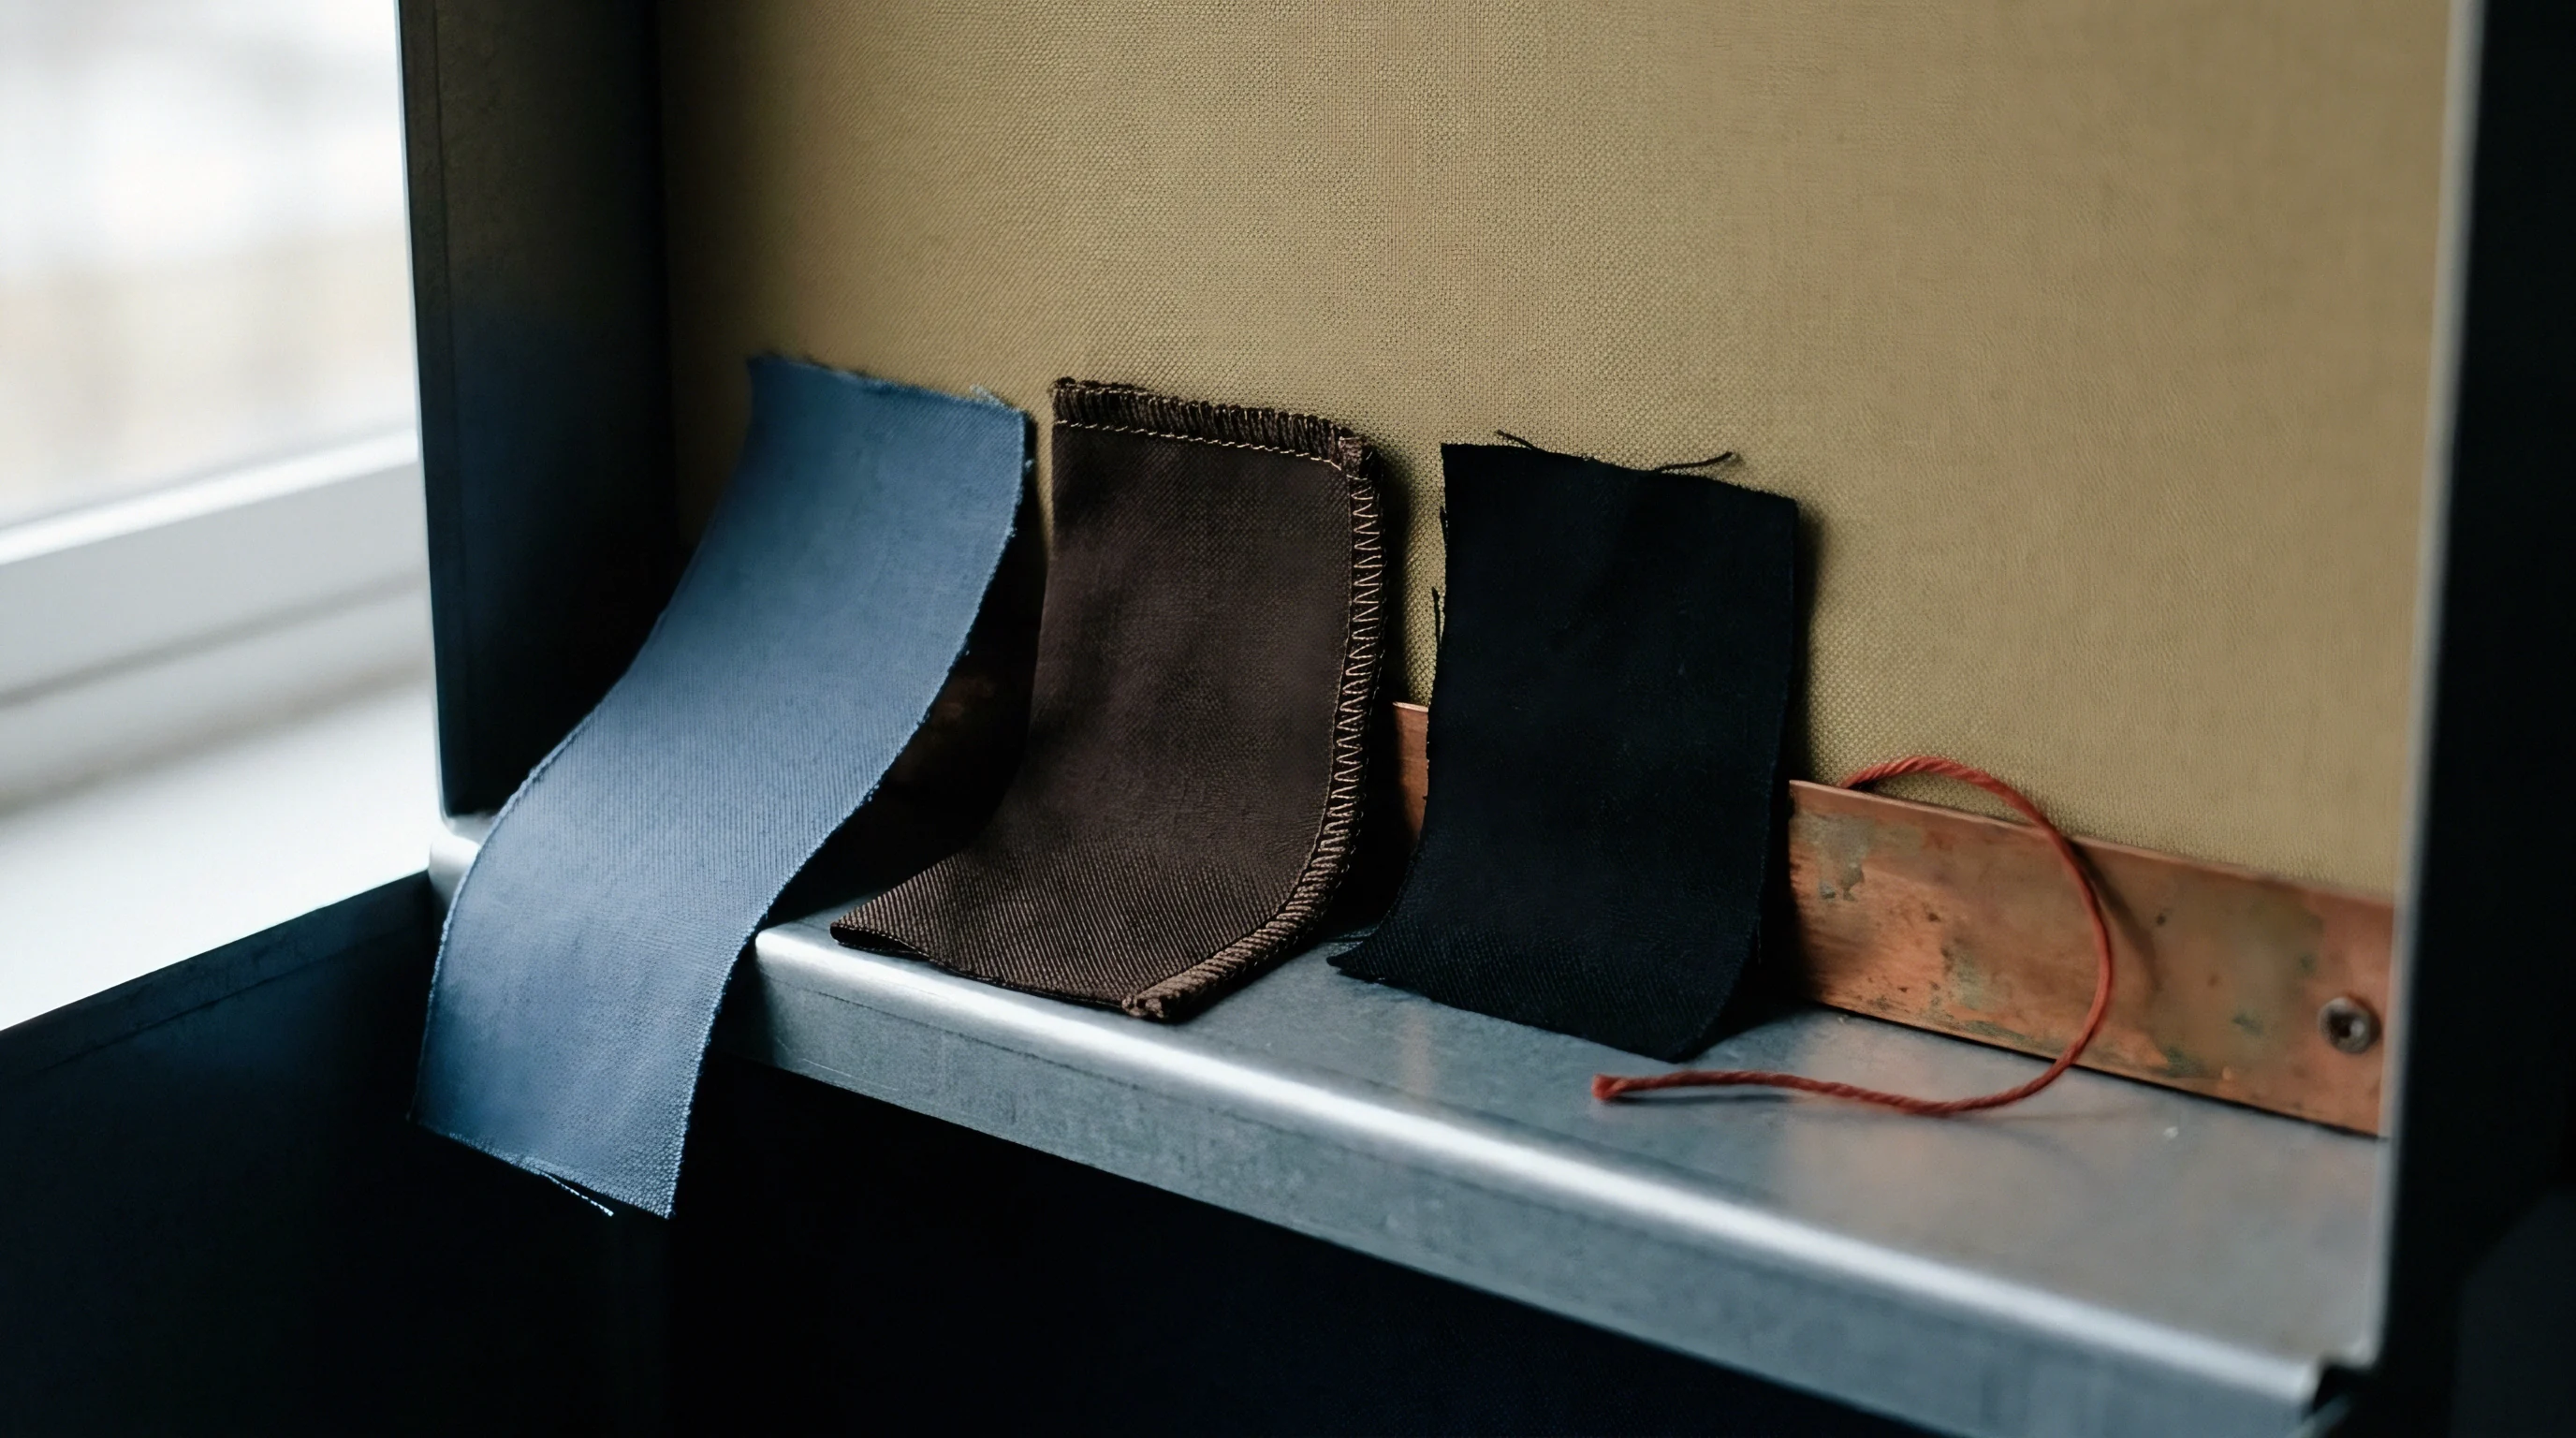
Managing shade variance across bulk fabric yardage requires rigorous inspection frameworks and statistical batch sorting. In industrial roll-to-roll production, shade drifts continuously from the beginning to the end of a single dye lot, and from batch to batch across a seasonal order. The textile industry utilizes the 555 shade sorting system to classify rolls into visually compatible groups.
The 555 system constructs a three-dimensional coordinate block around the target standard in CIELAB or CMC space. The target shade occupies the center block, designated 5-5-5. The first digit represents the lightness deviation (L ), the second digit represents the red-green chromatic shift (a ), and the third digit represents the yellow-blue chromatic shift (b ).
A roll assigned a sort code of 5-4-5 possesses target lightness and yellow-blue balance, but sits one step on the green side of the standard. Garment manufacturers restrict cutting room layups to rolls sharing identical 555 sort codes. Combining a front bodice panel cut from a 5-6-5 roll with a sleeve cut from a 5-4-5 roll creates a visible two-tone defect on the finished garment.
In multi-illuminant supply programs, shade sorting becomes multi-dimensional. A roll that sorts into the 5-5-5 block under D65 daylight can shift into a 6-4-5 block under TL84 store lighting and a 4-6-3 block under Illuminant A. Automated cut-and-sew operations reject lots that display excessive coordinate movement across the illuminant trio.
| Evaluation Plane | Target Standard | Acceptance Band (CMC l:c) | Illuminant Condition | Inspection Method |
|---|---|---|---|---|
| Lab Dip Approval | Master Color Target | Delta E 0.50 maximum | D65, TL84, Illuminant A | Spectrophotometer d/8 and Light Booth |
| First Bulk Lot | Approved Lab Dip | Delta E 0.70 maximum | D65 Primary / TL84 Secondary | Spectrophotometer SPIN/SPEX |
| Batch-to-Batch Run | First Bulk Lot Master | Delta E 0.80 maximum | D65 Primary | Automated In-line Spectrophotometry |
| Roll Head-to-Tail | Internal Roll Standard | Delta E 0.40 maximum | D65 Daylight | Continuous Edge-Center Scanner |
| Side-Center-Side Width | Centerline Cut Piece | Delta E 0.30 maximum | D65, Store LED | Three-point Transverse Traverse |
Side-to-center shading (listing) and end-to-end shading (tailing) represent severe physical defects in finished piece goods. In continuous pad dyeing, non-uniform pneumatic pressure across the padder squeeze rolls leaves excess dye liquor in the center of the fabric web, creating a darker center stripe. In beam dyeing, dye liquor flowing from the inside core to the outer periphery encounters differing filtration resistance, producing an end-to-end color taper across the bolt length.
Technical evaluations at the mill include reviewing continuous spectrophotometric traverse logs to verify that transverse color variance across the usable fabric width stays within a CMC Delta E of 0.30 before rolls are cleared for shipping.
Cutting room operations protect against panel shading by executing rigorous cut-part identification protocols. Once fabric passes inspection and enters the spreading table, automated ticket printers tag every individual cut component with its bundle, roll, and ply number. Operators assemble garments using parts extracted exclusively from the same ply of the same roll.
If a factory mixes plies across different dye lots, subtle metameric differences that were invisible on raw fabric rolls become pronounced across garment seams under retail store illumination.
Purchase orders must specify clear numerical parameters for multi-illuminant color approvals. A comprehensive quality contract defines the primary light source for initial matching, the secondary source for retail verification, and the tertiary source for home environment checks. The contract sets maximum permissible Delta E values under the CMC 2:1 formula for each illuminant, alongside a maximum allowable Metamerism Index.
Specifying these parameters protects the buyer against low-grade chemical substitutions and ensures that bulk shipments duplicate the aesthetic qualities of the approved design concept across every consumer touchpoint.
How will emerging solid-state retail LED lighting spectra with customizable narrow-band emissions reshape the legacy three-illuminant approval framework as legacy fluorescent lamps are phased out of international commerce?