Dynamic Baseline Compensation Algorithms for High Speed Spectral Sorting under Variable Regain Conditions
Dynamic baseline compensation algorithms eliminate regain spectral skew in high speed optical sorting, preventing blend misclassification and customs duty penalties.


Grid
Industrial optical sorters on high-speed conveyor lines process several tons of post-consumer textiles per hour. Identifying fibers at belt velocities between 1.5 and 3.2 metres per second forces near-infrared hyperspectral sensors to capture reflectance data within integration windows of just 0.5 to 2.0 milliseconds per point. At those speeds, ambient fluctuations continuously distort both the illumination beam and detector baseline.
Indium Gallium Arsenide linear photodiode arrays covering the short-wave infrared range from 900 to 1700 nanometres, along with extended InGaAs arrays reaching 2500 nanometres, depend on steady halogen or light-emitting diode sources to anchor a zero-absorbance reference frame under tight integration limits.
Heat generated within the sorter housing causes progressive baseline drift over long production shifts. Halogen lamps throw substantial infrared radiation into the chassis, raising interior temperatures and altering photodiode bandgap voltages. This shift moves the dark-current baseline of individual channels independently, distorting raw intensity values before any mathematical transforms run.
Accumulated dust on the optical window further scatters incoming light, creating a wavelength-dependent attenuation gradient that tilts the spectrum. Static factory calibration frames quickly break down once operational temperatures drift from room baselines.
While thermal stabilization of the detector reduces raw baseline drift, it cannot eliminate spectral overlap caused by fluctuating moisture regain. Channels across the 1400 to 1500 nanometre absorption window shift up to 8 percent in relative intensity during a 10-degree Celsius rise inside the chassis. That baseline movement alters the peak ratios classification models use to separate fiber types, degrading blend identification whenever raw intensity variations trace back to hardware drift rather than chemistry.
Optical sensor manufacturers typically maintain that thermal baseline compensation integrated into factory electronics eliminates the need for real-time dynamic spectral correction.
Maintaining sensor stability requires rigid mechanical mounts and controlled thermal dissipation across the optical bench. Vibration from high-speed belts travels straight through detector mountings, introducing micro-misalignments between the illuminated zone and collection optics. This shift changes the diffuse reflectance geometry and skews baseline levels across the entire collection matrix.
Handling these mechanical and optical shifts requires active reference tracking built directly into the acquisition pipeline instead of relying on baseline scans taken at startup.

High Speed NIR Detector Array Instrumentation
Running continuous conveyor belts at 1.5 to 3.2 metres per second creates difficult trade-offs for hyperspectral hardware. Line-scan InGaAs cameras must capture spatial and spectral information simultaneously to generate two-dimensional hyperspectral images of moving fabrics. Across a standard 1200-millimetre belt, achieving a spatial resolution of 2 to 5 millimetres at speeds above 2 metres per second demands frame rates between 500 and 1000 Hertz.
Those short dwell times starve the sensors of photons, lowering the signal-to-noise ratio in raw single-frame spectra.
| Sensor Parameter | Standard InGaAs Array | Extended InGaAs Array | Operational Exposure |
|---|---|---|---|
| Wavelength Range (nm) | 900 to 1700 | 1000 to 2500 | Covers fundamental overtone zones for polymer identification |
| Integration Dwell Time (ms) | 0.5 to 1.2 | 0.8 to 2.0 | Constrained by conveyor linear velocity and spatial resolution |
| Dark Current Shift (%/°C) | 0.45 | 1.15 | Requires continuous baseline tracking to prevent classification bias |
| Optical Noise (RMS AU) | 0.0003 | 0.0012 | High noise floors obscure weak second-overtone polymer bands |
| Data measured at 25°C ambient baseline with automated dark-current subtraction cycles every 60 minutes. | |||
Because integration windows are so tight, the system needs intense illumination to maintain adequate photon counts. High-power tungsten-halogen arrays provide sufficient flux across the 1000 to 2500 nanometre window, but filaments degrade over operational life. As tungsten evaporates, lamp color temperature drops, cutting emission at shorter wavelengths relative to the longer infrared bands.
Sorting lines without dynamic baseline correction misread this spectral shift as variance in dye concentration or material composition.

Thermal Drift and Optical Noise Mechanics
Incandescent lamps dump substantial heat into the optical enclosure during production. Convection currents along the optical path generate localized variations in the refractive index of air, deflecting the light beam and adding high-frequency noise across photodiode channels. When thermal gradients form across an array, baseline drift becomes non-uniform: pixels at 1400 nanometres wander at different rates than those at 2200 nanometres.
Continuous baseline tracking is necessary to prevent sorting accuracy from decaying.
Fast-moving textile conveyors also generate airborne debris that coats protective optical windows. Cotton lint, synthetic fragments, and dried processing finishes form a thin film on the glass, scattering short wavelengths and attenuating high-frequency signals to leave an inclined offset across raw reflectance profiles. Air knives blow off coarse lint, but sub-micron dust accumulates within hours of operation, making software-level baseline correction unavoidable.


Attenuation
Water absorption within polymer matrices drastically reshapes reflectance across shortwave infrared wavelengths. Liquid water produces strong fundamental molecular vibrations in the mid-infrared, which generate prominent overtone and combination bands in the near-infrared and shortwave infrared regions monitored by sorting optics. The first overtone of the O-H stretching vibration appears near 1450 nanometres, and the O-H bend-stretch combination band absorbs heavily near 1940 nanometres.
Weaker secondary overtones reach down to 970 nanometres, directly overlapping the aliphatic C-H stretching signals used to classify synthetic fibers.
Textile polymers differ sharply in their moisture regain under shifting ambient humidity. Standard moisture regain ranges from 0.4 percent mass fraction for hydrophobic polyethylene terephthalate up to 13.0 percent for regenerated cellulose and 15.0 percent for scoured wool. When post-consumer or post-industrial bales enter sorting lines without prior climate conditioning, uneven moisture produces severe baseline distortions.
Absorbed water depresses total reflectance across the entire SWIR region while broad water peaks mask underlying polymer signatures.
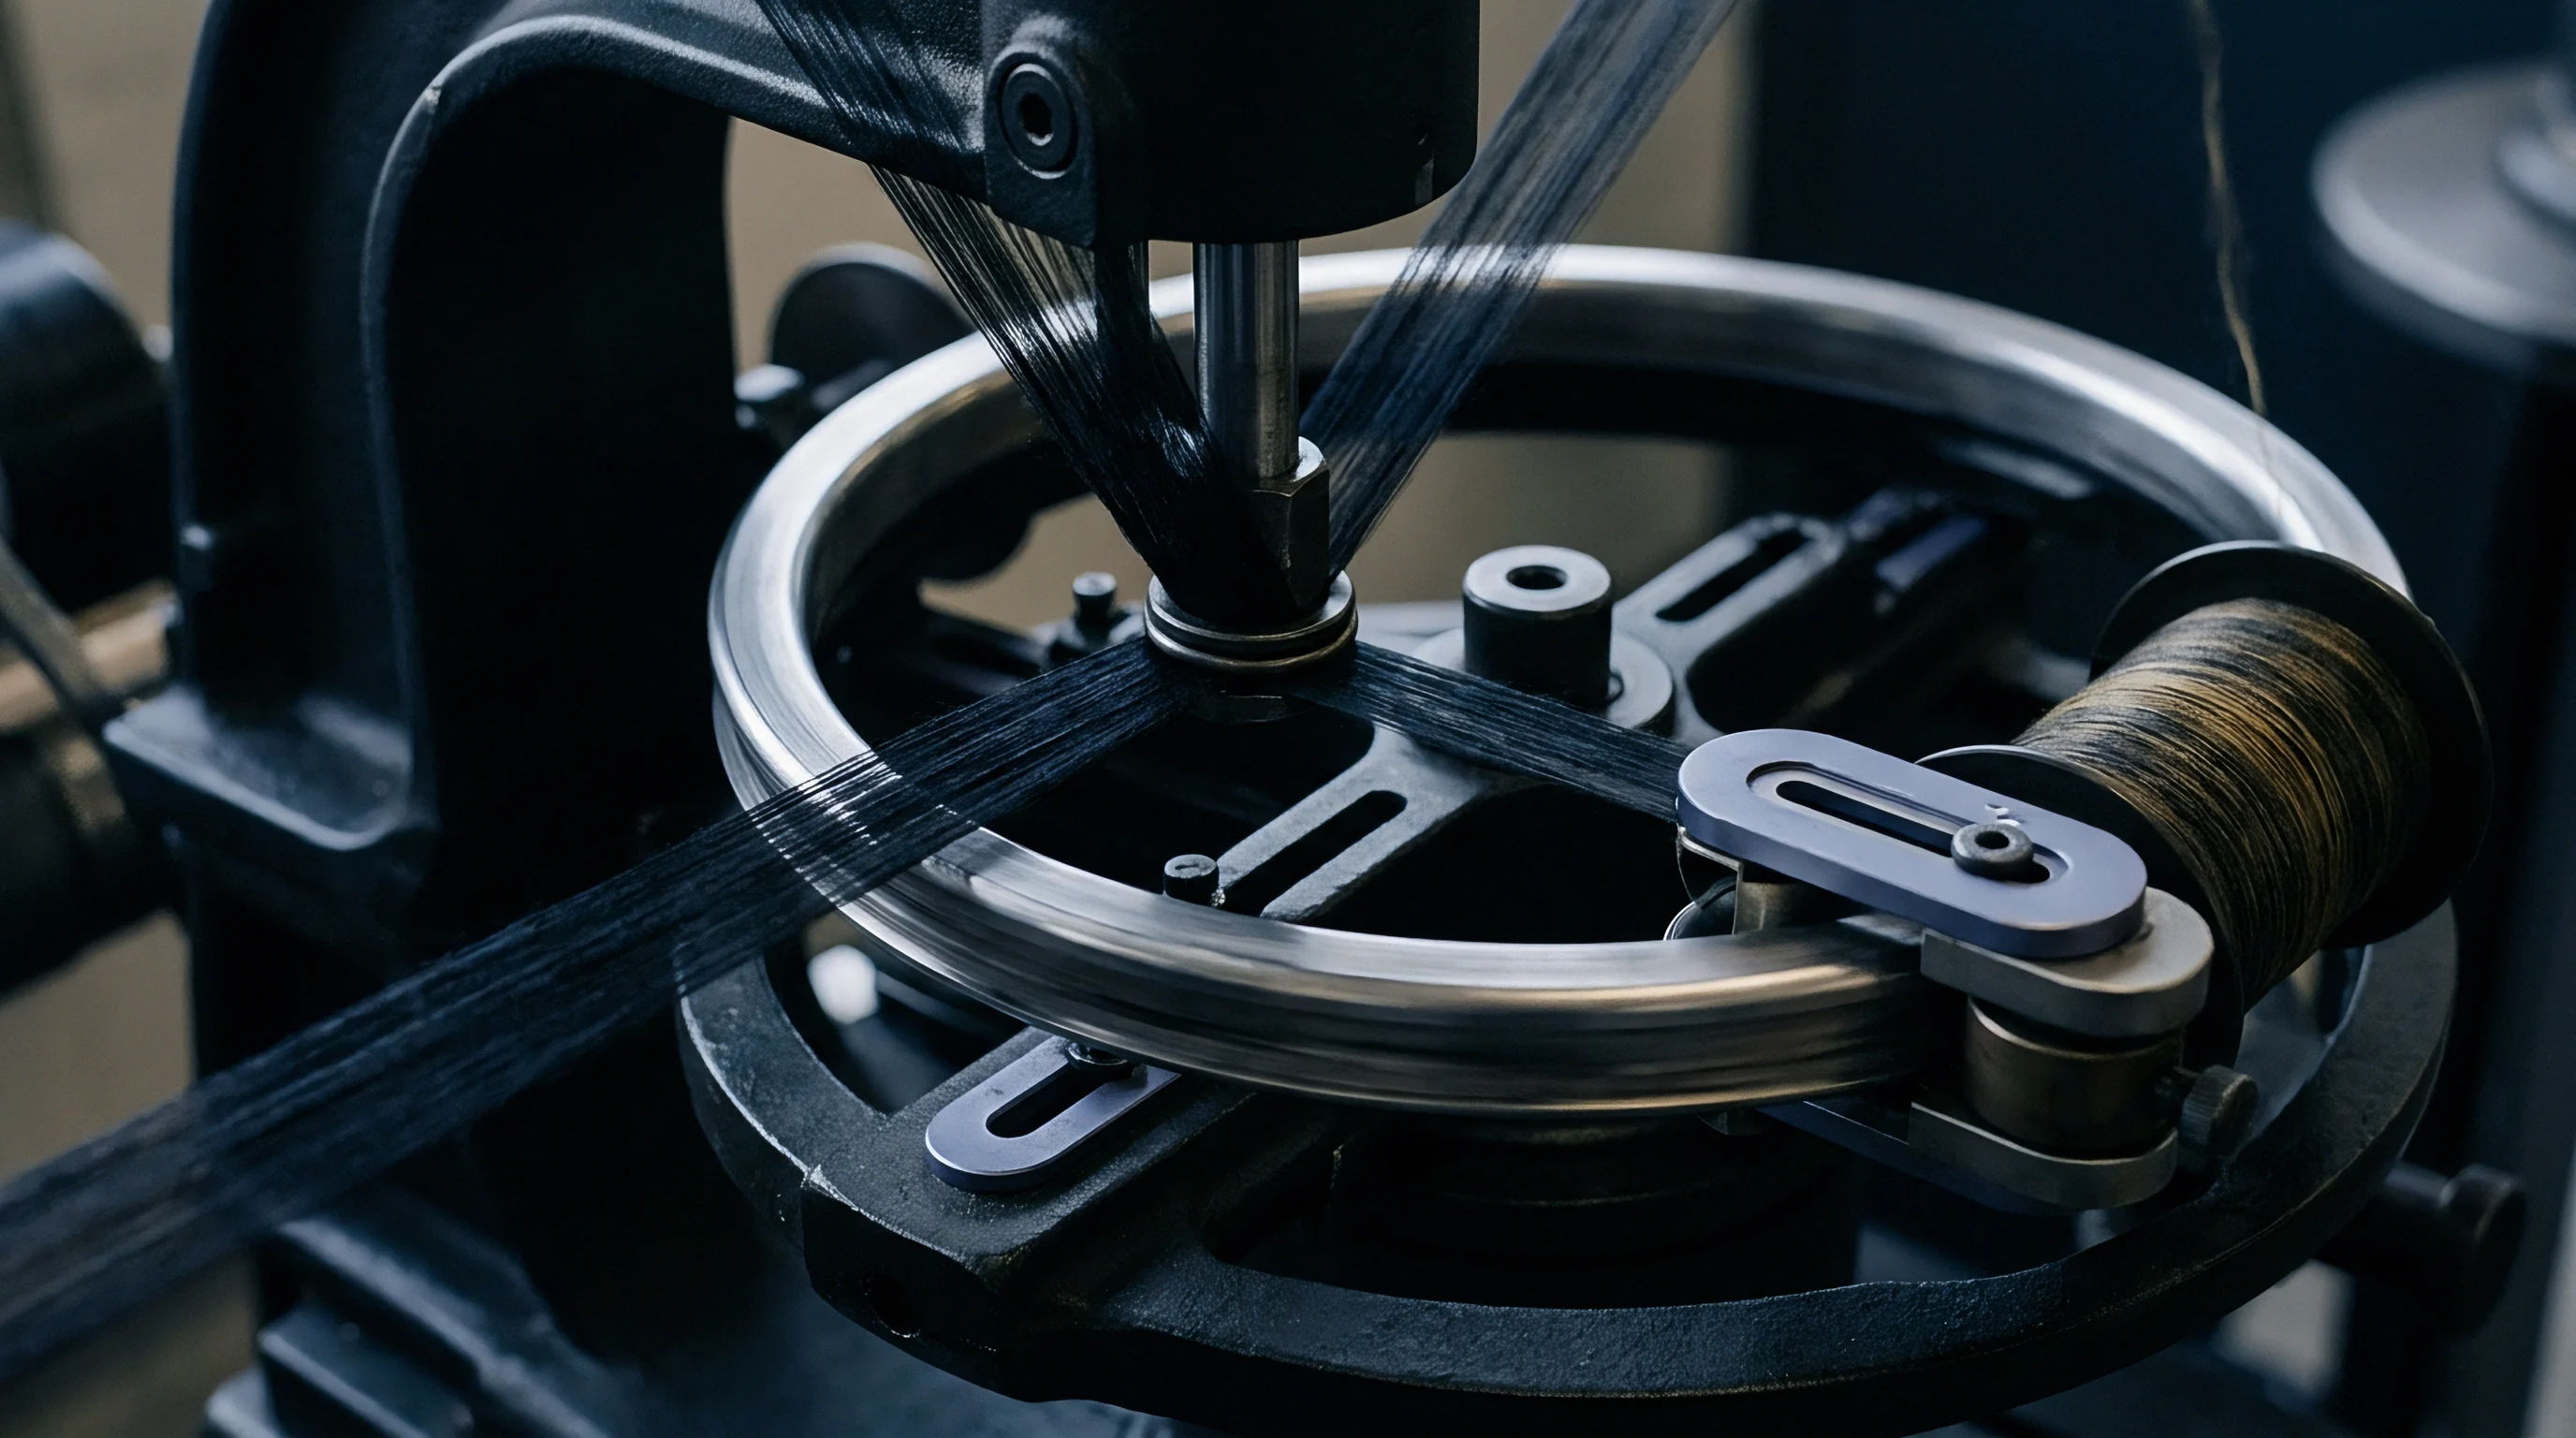
Polymer Moisture Sorption and Spectral Absorption
A fiber’s chemical structure dictates its affinity for ambient moisture. Hydrophilic materials such as cotton, viscose, wool, and flax carry abundant polar hydroxyl or amide groups that readily bind water molecules from surrounding air. Hydrophobic synthetics like polyester, polypropylene, and acrylic lack these sites and take up very little moisture in their amorphous regions.
As a result, shifts in ambient sorting hall humidity warp natural fiber spectra while leaving synthetic profiles essentially unaffected.
- Hydroxyl Band Masking broadens liquid water absorption peaks at 1450 nanometres, obscuring adjacent methyl C-H absorption bands in acrylic and polyamide substrates.
- Reflectance Baseline Shift lowers total light return across the shortwave infrared spectrum proportionally with increasing fiber regain percentages.
- Scattering Coefficient Change occurs when liquid water replaces air within fiber interstitial voids, altering diffuse light path lengths through moving fabric.
- Peak Shift Distortion moves apparent absorbance maxima of natural fibers toward pure water absorption wavelengths as moisture levels rise.
Water held mechanically between yarns affects reflectance differently than bound moisture hydrogen-bonded within polymer chains. Free water yields sharp absorption peaks at 1420 and 1920 nanometres, whereas bound moisture exhibits broader features shifted toward 1450 and 1940 nanometres. Practical sorting models have to distinguish between surface moisture picked up during transport and intrinsic regain balanced with plant air.

Water Band Overlap in Shortwave NIR Spectrometry
Spectroscopic sorting between 900 and 2500 nanometres relies on overtone signatures from specific chemical bonds. Distinct C-H, N-H, O-H, and C=O vibrations distinguish different polymers: polyamides show clear N-H overtones near 1510 and 2060 nanometres; polyester displays aromatic C-H peaks near 1660 and 2130 nanometres; and cellulosic fibers exhibit strong O-H stretching overtones near 1480 and 2100 nanometres. When moisture regain rises beyond calibration limits, broad water bands obscure these diagnostic regions.
Uncompensated water absorption bands obscure synthetic polymer peaks long before optical saturation occurs.
This overlap distorts quantitative blend calculations on high-speed sorting lines. In a cotton-polyester blend, elevated moisture broadens the 1450 nanometre water band until it bleeds into the 1660 nanometre polyester C-H zone. Standard linear regression models read that added absorbance as higher cellulose content and miscalculate the blend ratio.
Left uncompensated, rising moisture consistently skews automated classifications toward natural fibers at the expense of hydrophobic synthetics.


Algorithm
Mathematical preprocessing isolates true polymer absorption from background optical noise. Raw reflectance data captured by line-scan cameras enters the compensation pipeline as intensity arrays mapped across wavelength channels. The initial step converts intensity to apparent absorbance by taking the negative logarithm of the sample reflectance divided by a zero-absorbance reference.
Because variable regain introduces both baseline offsets and slope changes across these profiles, the software applies mathematical corrections to extract signals tied strictly to chemical structure.
Standard Normal Variate (SNV) transformation subtracts each spectrum’s mean absorbance and divides by its standard deviation across the wavelength range. This normalizes individual spectra to zero mean and unit variance, stripping out multiplicative scatter caused by fabric textures and varying distances to the conveyor belt. However, because SNV weights every channel equally, large water peaks at 1450 and 1940 nanometres distort the calculated mean and standard deviation for the entire scan.
Modified routines restrict scaling calculations to invariant spectral windows to prevent regain peaks from corrupting the result.

Which Algorithmic Architecture Corrects Non-Linear Regain Distortions?
Interactions between bound water and polymer chains introduce non-linear baseline shifts across hyperspectral datasets. Multiplicative Scatter Correction (MSC) fits measured spectra against an average reference using ordinary least squares, where the slope reflects multiplicative scatter and the intercept accounts for additive offset. For high-speed textile sorting under fluctuating moisture, Extended Multiplicative Scatter Correction (EMSC) expands this model by incorporating pure liquid water absorbance vectors, allowing the regression to decouple physical scattering from variable moisture content in real time.
| Compensation Algorithm | Mathematical Complexity | Regain Robustness | Computational Dwell Time (ms) |
|---|---|---|---|
| Standard Normal Variate (SNV) | Low (Vector arithmetic) | Moderate (Fails above 10% regain variation) | 0.08 |
| Savitzky-Golay 2nd Derivative | Moderate (Convolution window) | High (Eliminates baseline offset and tilt) | 0.14 |
| Multiplicative Scatter Correction (MSC) | Moderate (Least-squares fit) | Moderate (Sensitive to water peak changes) | 0.22 |
| Extended MSC with Water Vectors (EMSC) | High (Matrix inversion) | Very High (Decouples moisture from polymer) | 0.65 |
| Adaptive EWMA Dynamic Baseline | High (Real-time state space tracking) | Very High (Tracks rapid ambient shifts) | 0.48 |
Savitzky-Golay filtering calculates numerical derivatives using low-degree polynomials fitted across localized wavelength windows. A first derivative removes constant baseline offsets by turning vertical shifts into zero crossings; a second derivative strips out linear slope, eliminating spectral tilt from lamp aging or optical dust. Second derivatives also resolve small polymer peaks masked beneath wide water shoulders, sharpening aromatic C-H features in polyester and N-H bands in wool and polyamide blends.
Because differentiation amplifies high-frequency noise, smoothing windows must be carefully tuned to preserve weak absorption peaks.
Scatter Correction and Derivative Processing Protocols
Variations in yarn structure and fabric weave shift total reflectance up or down: an open, coarse weave scatters light differently than a dense continuous-filament knit. Practical processing pipelines pair scatter correction with derivative filtering to clean raw data before classification. Running SNV preprocessing followed by a Savitzky-Golay second derivative suppresses broad water absorption while sharpening diagnostic polymer peaks.
Implementing dynamic baseline compensation on post-consumer cotton-polyester feeds yields a 4.2 percent reduction in blend misclassification. The pipeline runs an adaptive background update loop that continuously recalculates zero-water baseline vectors from hydrophobic control items passing down the belt. When high-regain natural fiber lots cross the sensor field, the system applies an offset vector derived from the preceding 100 milliseconds of sorting data, suppressing false cellulose readings in hydrophobic blend components.

Real Time Baseline Recalibration Workflows
Operating a sorter in an uncontrolled plant environment requires continuous reference tracking. Real-time baseline routines use an Exponentially Weighted Moving Average (EWMA) to update the background reference spectrum during production runs. Giving higher weight to recent background scans lets the system track rapid temperature changes and moisture shifts in incoming bales without stopping the belt for manual recalibration.
Consider a sorting line processing mixed cotton and polyester garments at a belt speed of 2.5 metres per second. If rain outside drives plant humidity from 45 percent to 75 percent over four hours, uncompensated sorting models register a 0.35 AU baseline jump around 1450 nanometres on pure cotton items, while 50/50 cotton-polyester blends appear to drift to 62 percent cotton by mass. Polyethylene terephthalate absorbs negligible moisture.
To run dynamic EMSC compensation under these conditions, the software evaluates the correction equation for every acquired spectral pixel vector x:
x_corrected = (x – a – b lambda – c W) / d
Where lambda represents the wavelength vector from 1000 to 2500 nanometres, W represents the standardized reference spectrum of pure liquid water, a represents the scalar additive baseline offset, b represents the spectral tilt slope, c represents the calculated moisture weight coefficient, and d represents the multiplicative scatter scale factor. The software solves for parameters a, b, c, and d simultaneously using partial least squares matrix decomposition within a 0.5 millisecond processing budget per spectrum.
Standard Normal Variate transformations suppress baseline offset variations up to 0.45 absorbance units under steady humidity.
After EMSC transformation, the corrected vector x_corrected shows zero baseline offset and a stable zero-water reference. Absorbance at 1660 nanometres returns to the value corresponding to actual 50 percent polyester content by mass, keeping classification error within 1.5 percent absolute tolerance through the 30 percent humidity swing. Dynamic updating prevents baseline drift from pushing items past classification thresholds.
Whether adaptive neural network algorithms can dynamically isolate bound water signatures from free surface water across shredded post-consumer textiles without requiring continuous physical reference recalibration remains an open engineering challenge.

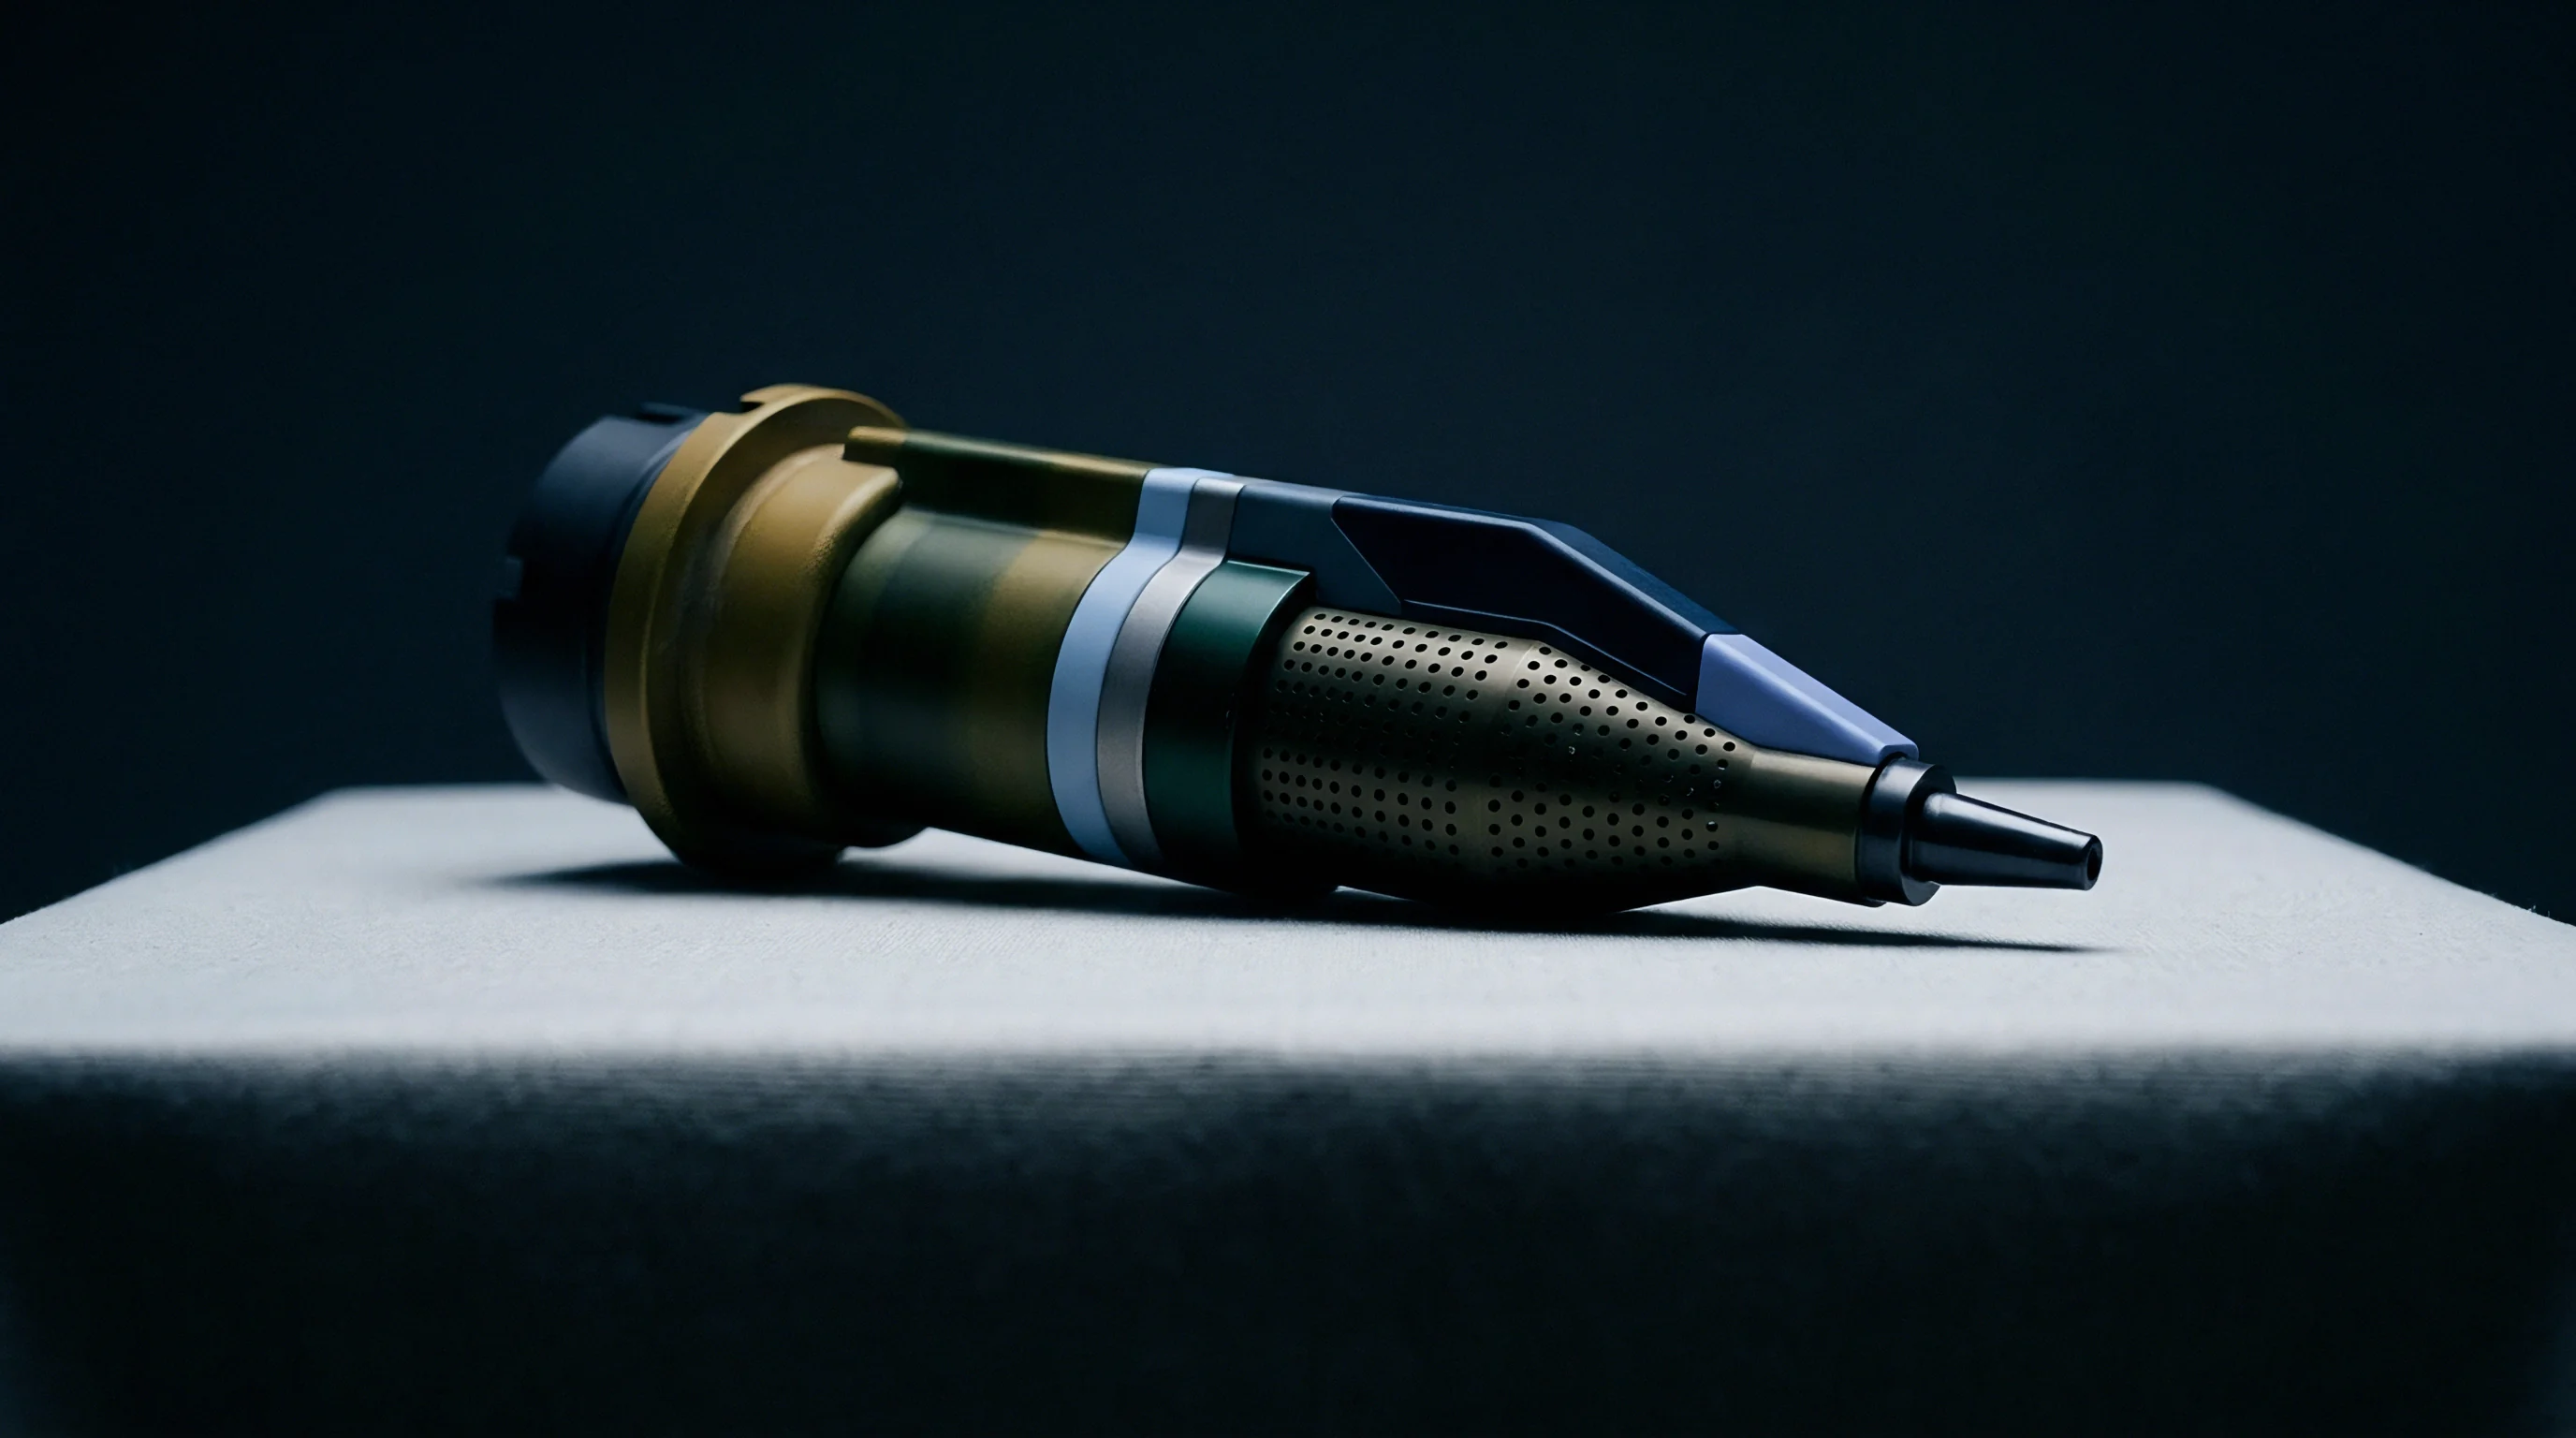
Sampling
Physical laboratory testing serves as the ground-truth benchmark for all optical calibration models. Optical sorting hardware requires regular validation against wet-chemical separation performed under strict laboratory conditions. Standard methods isolate binary and ternary blends through selective solvent dissolution, requiring test specimens to be conditioned to standard moisture regain before weighing to establish the dry-mass baseline needed to train optical baseline algorithms.
Standard preparation requires holding fiber samples in a controlled atmosphere at 20 degrees Celsius and 65 percent relative humidity for at least 24 hours. This conditioning brings natural and synthetic fibers to moisture equilibrium, eliminating erratic surface moisture that distorts initial mass readings. Laboratory ovens with internal balances dry specimens at 105 degrees Celsius until mass changes between consecutive weighings drop below 0.05 percent.
Commercial invoice mass is then calculated by adding standard commercial regain allowances back to this oven-dry figure.

Quantitative Chemical Separation Baseline Validation
Chemical analysis uses selective solvent extraction to isolate blend constituents by mass. For a binary cotton-polyester blend, ISO 1833-11 prescribes dissolving the cotton in 75 percent sulfuric acid by mass at room temperature. The remaining polyester residue is caught on a sintered glass filter crucible, washed, dried, and weighed.
Solvent testing requires complete dissolution of the target fiber without degrading the insoluble matrix, demanding tight control over acid concentration, temperature, and contact time.
Ternary blends require sequential dissolution steps. In a mix of wool, silk, and synthetic fibers, sodium hypochlorite dissolves the wool first, followed by zinc chloride and formic acid to remove the silk, leaving the synthetic residue behind. Because each step can cause minor degradation of the insoluble fractions, laboratories apply correction factors (d-values) to adjust calculated dry masses based on known solvent loss rates.
- Draw representative sub-samples from incoming textile bales using a multi-point core sampling tool across at least ten spatial locations per lot.
- Pre-condition extracted sub-samples in a climate-controlled laboratory at 20°C and 65% relative humidity for 24 hours until mass equilibrium is reached.
- Determine raw conditioned specimen mass on an analytical balance calibrated to 0.1 milligram accuracy.
- Extract surface finishes, oils, and residual sizing agents using petroleum ether in a Soxhlet extraction apparatus for one hour.
- Dry specimens in a forced-draft oven at 105°C for four hours, transferring them to a desiccator containing activated silica gel to cool prior to recording dry mass.
- Perform selective chemical dissolution according to ISO 1833 protocols specific to the identified fiber blend components.
- Filter, wash, and dry insoluble residues at 105°C to constant mass, applying standardized d-value corrections for chemical loss.
- Calculate dry fiber percentage composition and append official commercial moisture regain allowances to derive declared invoice composition.
When reviewing bulk fiber lots before filing customs declarations, physical oven-dry test results are compared against automated spectroscopic output. Mismatches between optical predictions and wet-chemical results typically trace back to uncompensated regain during sorting. If a sorter inspects incoming bales at 12 percent regain using models trained on 6 percent regain references, it overstates the natural fiber fraction, producing declarations that fail ISO 1833 verification audits.

Oven Dry Conditioning and Commercial Regain Mass
Textile commodities trade on conditioned commercial mass rather than dry mass alone. Regulatory standards assign fixed commercial regain allowances to each fiber type to standardize weights across global supply chains. Commercial calculations add a 17.00 percent regain allowance to the dry mass of scoured wool and 8.50 percent to combed cotton yarn.
Viscose rayon receives 13.00 percent, synthetic polyester receives 1.50 percent, and polyamide receives 6.25 percent.
Contracts governed by ISO 1833-1 require chemical dissolution verification whenever spectroscopic blend estimates deviate by more than two percent absolute mass.
Calculating commercial mass involves multiplying the oven-dry mass of each fiber component by one plus its decimal regain factor and summing the results. Miscalculating moisture during optical sorting distorts these proportions, creating weight discrepancies between invoice paperwork and actual commercial mass received at the spinning mill.
Under ISO 1833-1 Clause 8, any deviation in dry fiber mass exceeding one percent between duplicate specimens mandates full re-extraction and invalidates prior optical sorting calibration datasets.


Clearing
International trade rules require precise fiber breakdown declarations on commercial import paperwork. Customs agencies enforce classifications based on the Harmonized Commodity Description and Coding System, where tariff lines and duty rates across Chapters 50 through 55 depend directly on chief-weight rules. Declaring incorrect blend ratios because of uncorrected spectroscopic drift risks fines, mandatory physical re-inspections, and retroactive duty assessments.
Tariff classification for blended textile waste and recycled fiber lots depends on whichever fiber makes up the majority of the dry mass. Fabric scrap containing 52 percent cotton and 48 percent polyester by dry mass enters under HS Code 5202.99 as cotton waste, carrying specific tariff schedules and preferential access rules. If regain-induced spectral distortion misidentifies that lot as 48 percent cotton and 52 percent polyester, customs reclassifies it under HS Code 5505.10 as synthetic waste, triggering different duty rates and documentation requirements.

Tariff Classification and Chief Weight Valuation
Under chief-weight rules, if one fiber exceeds 50 percent of total dry mass, the whole shipment is classified under that material’s specific chapter. Preferential trade agreements also tie rules of origin to strict composition thresholds. An error of just two or three percentage points can strip a lot of recycled yarn feed of its originating status, eliminating duty-free eligibility under regional trade pacts.
| Fiber Blend Category | Predominant Mass Threshold | HS Code Classification | Typical Duty Differential (%) | Sorting Error Risk Exposure |
|---|---|---|---|---|
| Cotton Waste / Scrap | > 52% Cotton by mass | HS 5202.99 | 0.0 to 5.0 | Baseline water band overestimates cotton ratio |
| Synthetic Staple Waste | > 50% Polyester by mass | HS 5505.10 | 4.0 to 8.5 | Uncompensated regain shifts lot into synthetic tariff |
| Wool Waste / Shredded | > 50% Wool by mass | HS 5103.20 | 0.0 to 3.2 | High natural regain causes broad baseline shift |
| Artificial Staple Waste | > 50% Viscose by mass | HS 5505.20 | 3.5 to 6.0 | Hydroxyl absorption mirrors water spectrum features |
Customs authorities routinely pull verification samples from imported bales for laboratory dissolution testing under ISO standards. If official tests show that a lot declared as 100 percent recycled polyester contains 4 percent cotton that went undetected due to moisture drift on the sorting line, customs amends the entire entry filing. Penalties include unpaid back duties, accumulated interest, and administrative fines calculated on the total commercial value of the shipment.
Landed Cost Exposure under Misdeclared Blend Ratios
Applied duty rates differ substantially among natural, artificial, and synthetic textile categories. Landed cost models aggregate purchase price, ocean freight, marine insurance, port handling, and applicable customs duties. Small shifts in the declared blend ratio alter the duty rate, directly affecting the landed cost per kilogram and the operating margin for secondary spinning mills.
- Tariff Classification Reassignment occurs when inaccurate blend declarations force customs officers to reclassify shipments under higher duty chapters.
- Customs Seizure and Detention holds commercial shipments at port facilities while dispute resolution laboratory analyses are completed.
- Retrospective Duty Assessment penalizes importers for historical misdeclarations identified during routine post-clearance corporate audits.
- Spinning Mill Batch Rejection happens when delivered fiber composition violates yarn engineering specifications and contractual purity limits.
Consider a commercial shipment of 20,000 kilograms of post-consumer recycled fiber imported for secondary yarn spinning. The invoice declares the material as 100 percent recycled polyester fiber under HS Code 5503.20 at a purchase price of 1.20 Euros per kilogram and an import duty rate of 4.0 percent. The baseline landed cost calculation yields:
FOB Material Value = 20,000 kg 1.20 EUR/kg = 24,000 EUR
Freight and Insurance = 2,500 EUR
Customs Valuation Base = 26,500 EUR
Declared Duty (4.0%) = 1,060 EUR
Declared Landed Cost = 27,560 EUR (1.378 EUR/kg)
If uncompensated optical sorting allowed 8 percent cotton content to remain within the sorted lot, a customs post-importation inspection reclassifies the shipment as mixed synthetic and natural waste under HS 5505.10, carrying an 8.0 percent duty rate plus a 15.0 percent misdeclaration administrative penalty on duty unpaid:
Re-assessed Duty (8.0%) = 2,120 EUR
Duty Difference = 1,060 EUR
Administrative Penalty (15.0% of CIF) = 3,975 EUR
Demurrage and Re-testing Fees = 1,800 EUR
Corrected Landed Cost = 33,455 EUR (1.673 EUR/kg)
The resulting 21.4 percent increase in landed cost per kilogram eliminates profit margins for the secondary spinning mill, turning a profitable sourcing contract into a net operating loss. Implementing continuous dynamic baseline compensation on high-speed sorting cameras protects importers from baseline regain distortions that induce classification errors on commercial invoices.
Misclassifying a post-consumer recycled textile lot due to regain-induced spectral skew leads directly to customs seizure, punitive tariffs, and complete rejection of the shipment by secondary yarn spinners.