Spectrophotometer Calibration Methods for Industrial Textile Shade Approval
Industrial shade approval relies on daily white tile calibration, black trap zeroing, UV adjustments, and aperture matching across color measurement units.
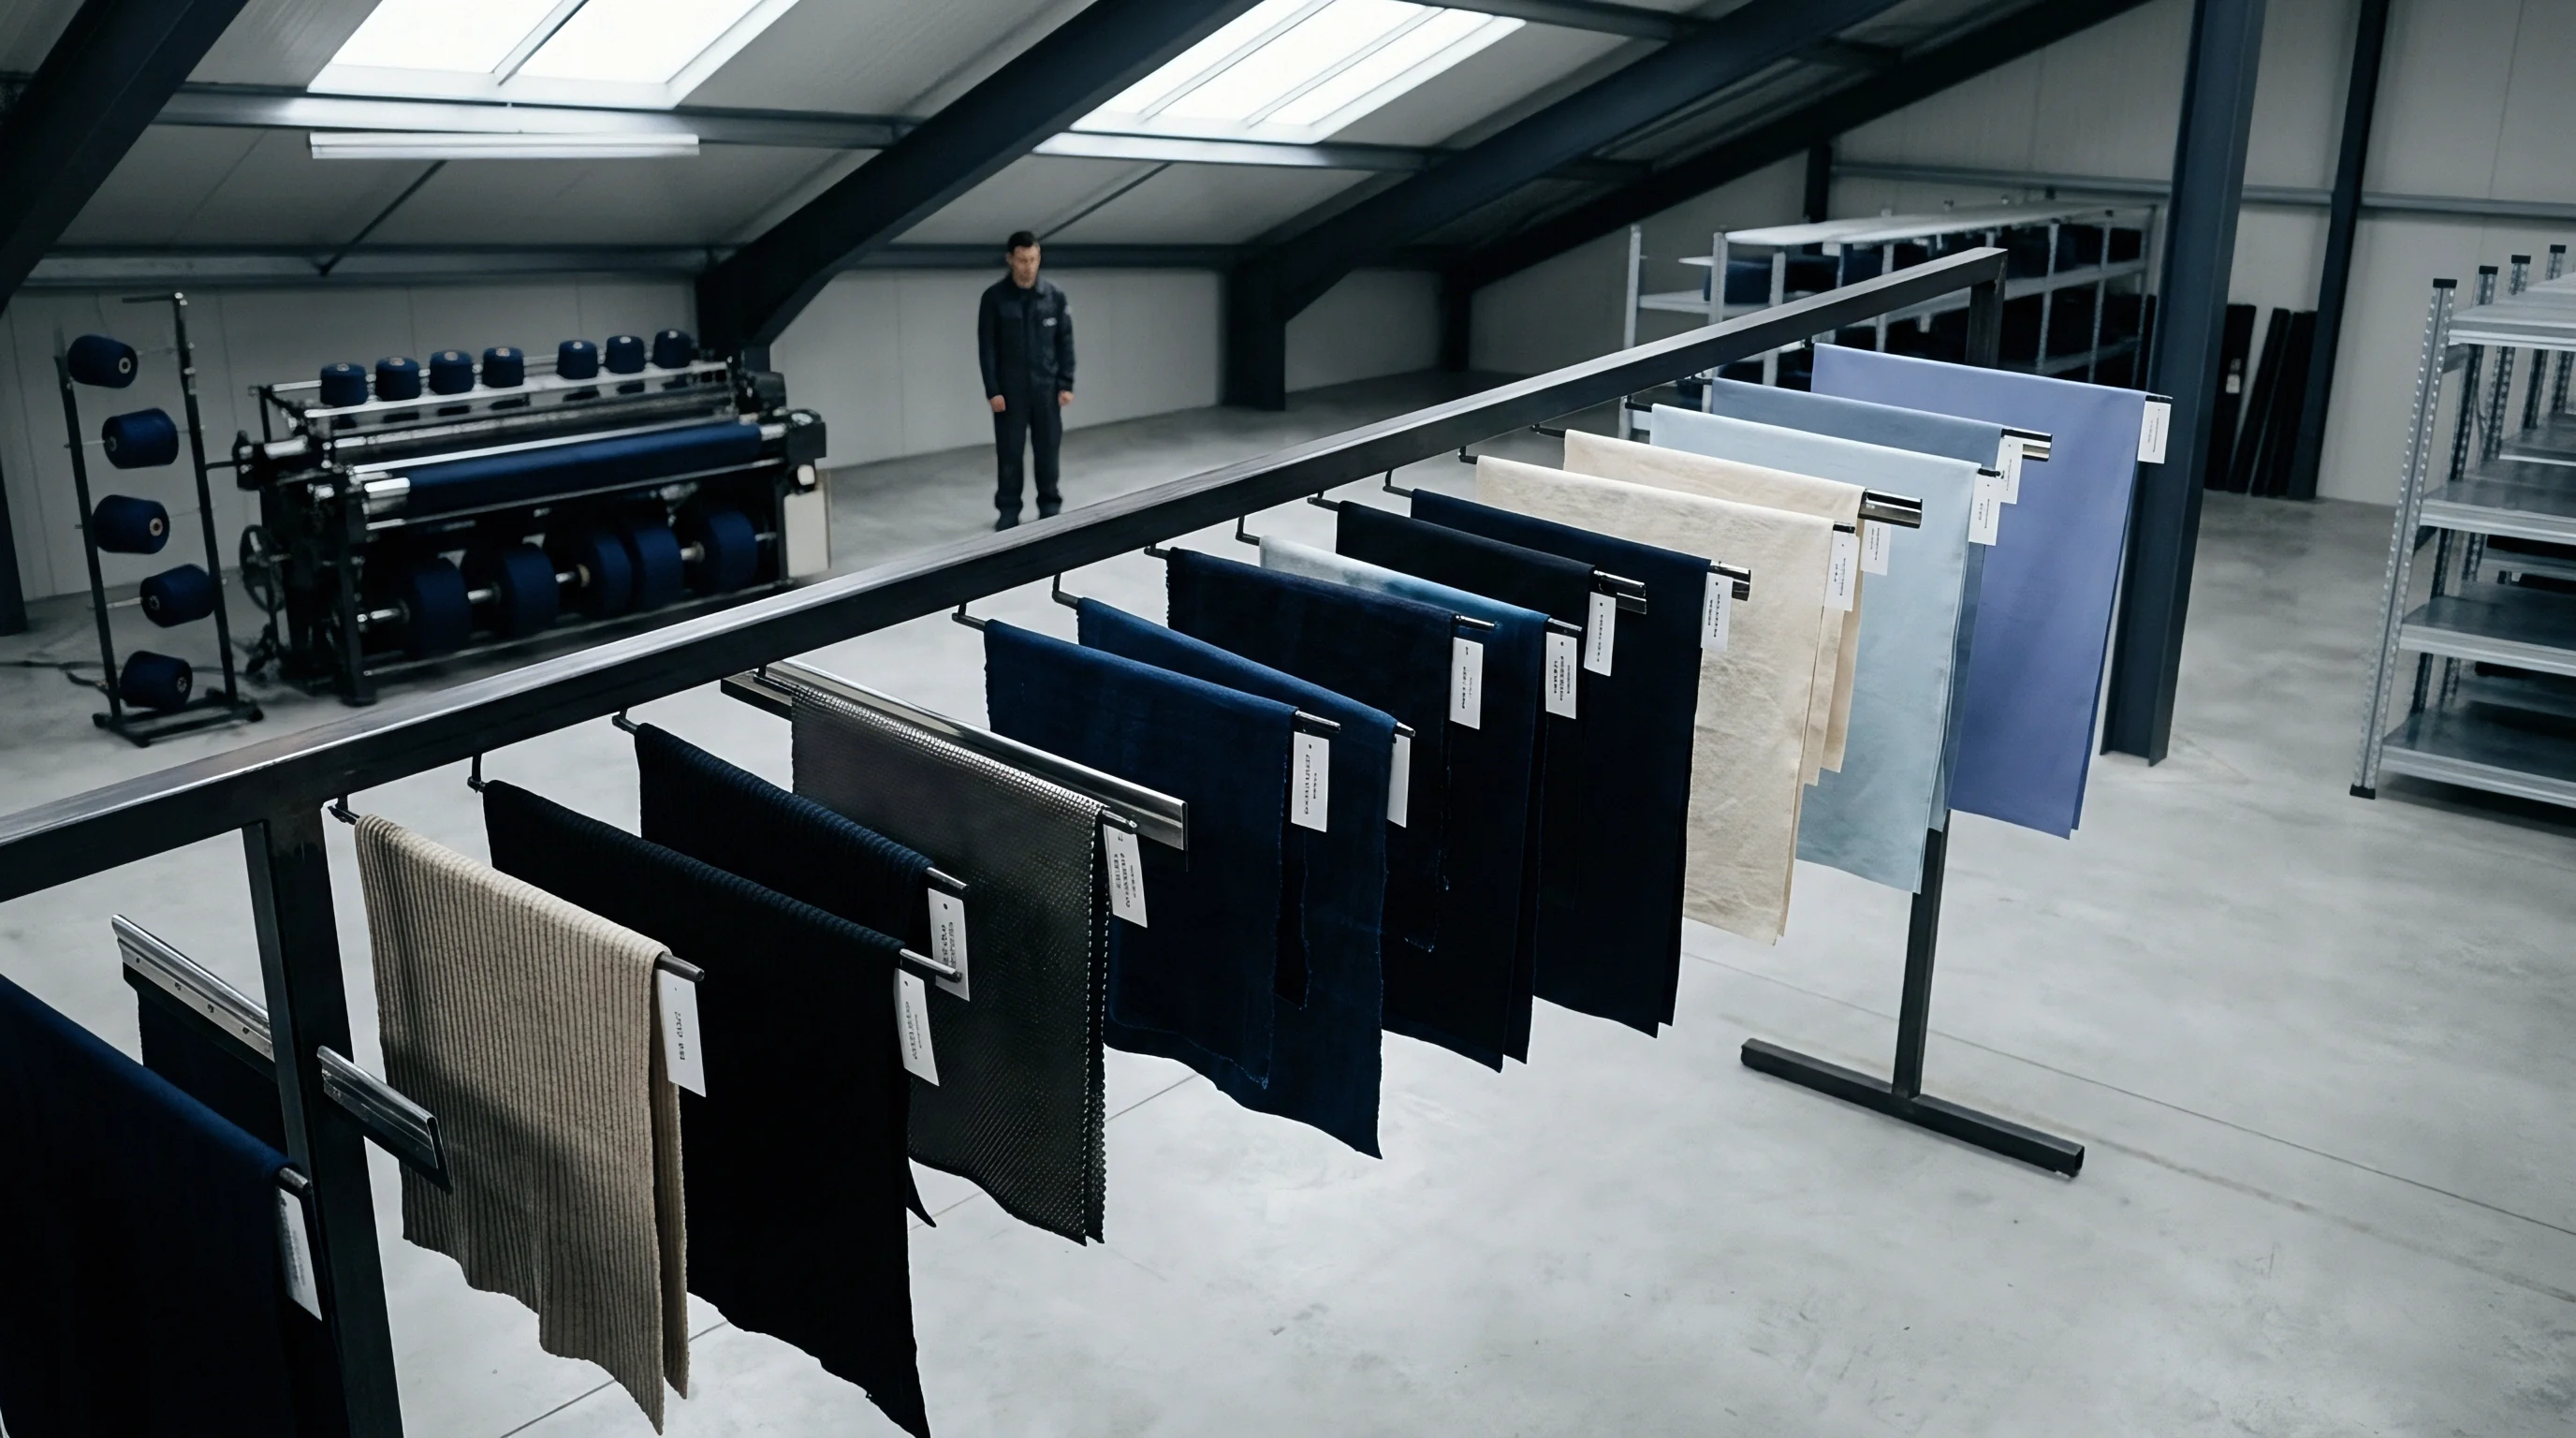

Tile
Spectrophotometer accuracy depends on daily primary reference routines performed before commercial shade measurement begins. Industrial color measurement instruments split light from a pulsed xenon flash lamp along a dual-beam optical path into reference and sample channels. While the reference channel monitors variations in lamp output, the sample channel captures spectral energy reflected from the textile substrate across the visible spectrum from 360 nanometers to 750 nanometers.
Calibration fixes the detector array’s baseline zero and maximum reflectance boundaries. If that baseline is misaligned, dyebath strength calculations and lab-to-bulk color difference equations produce faulty values that fail visual assessment under a light box.
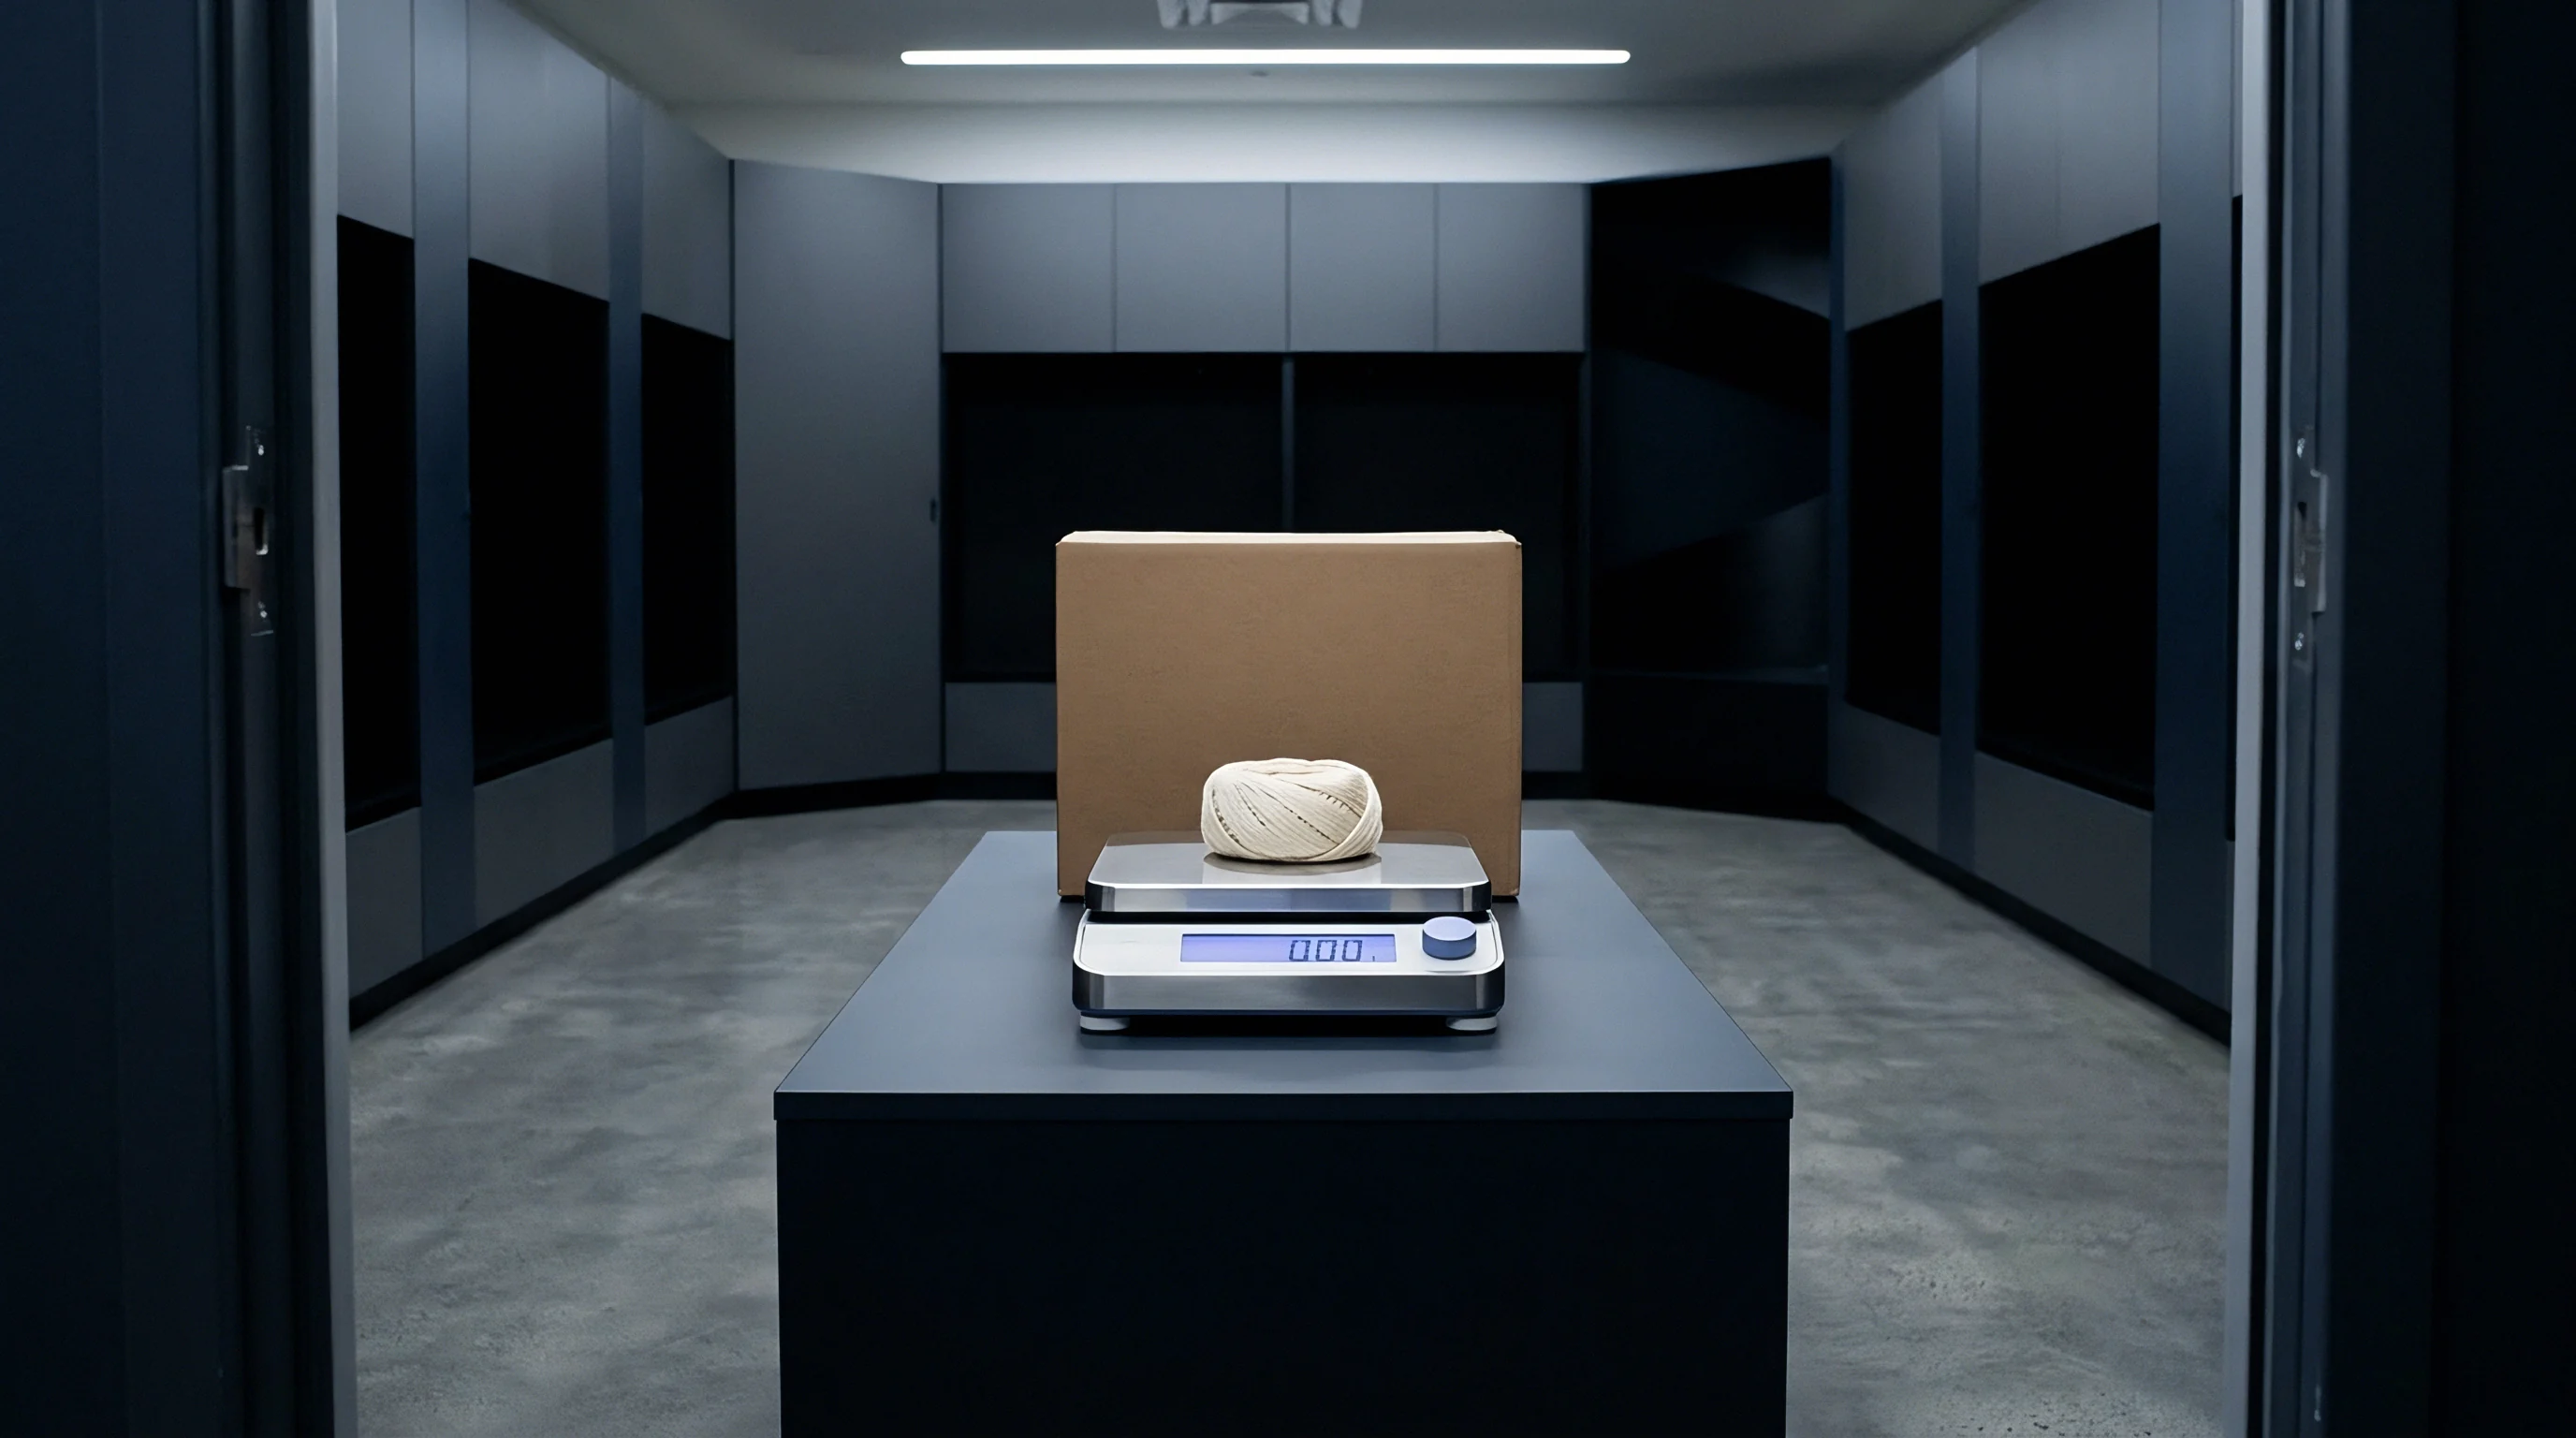
Primary calibration relies on two physical standards: a light trap to set zero reflectance and a certified white ceramic plate to establish maximum reflectance. The light trap captures all incoming light to remove internal stray light and dark current detector noise. Across every wavelength band, the 100 percent reflectance curve is provided by the white ceramic plate, which is manufactured for high spatial uniformity and calibrated against national metrology standards.
Technicians store these reference standards in protective cases away from dyehouse fumes, direct sunlight, and ambient moisture.
A baseline white tile standard recalibrated by an accredited laboratory retains certified spectral values for twenty-four months when stored in clean darkness at twenty degrees Celsius.
Primary Optical References and Wavelength Calibration
A dual-beam spectrophotometer isolates color measurements from power fluctuations by dividing flash lamp emissions between sample and internal reference channels. Wavelength scale integrity ensures that energy recorded at 520 nanometers belongs to that specific monochromatic band without drifting into adjacent wavelengths. Checking this accuracy requires rare-earth oxide glass filters, such as holmium oxide or didymium standards, which display sharp spectral absorption peaks at known physical intervals.
A holmium oxide standard has distinct absorption minima at 360.8 nanometers, 418.5 nanometers, 536.4 nanometers, and 637.5 nanometers. Peak location shifts beyond 0.2 nanometers during diagnostic routines signal optical misalignments that require manufacturer service.
Photometric linearity confirms that detector response scales evenly across the entire reflectance range, from deep blacks at two percent reflectance to bleached white fabrics at ninety-five percent. Calibrated neutral density optical filters test sensor linearity across several attenuation steps. A non-linear detector skews colorant concentration calculations during recipe formulation, leading to inaccurate dye predictions that demand repeated dyebath additions in bulk production.

Diagnostic Arrays and UV Adjustment Protocols
Monitoring spectral linearity and stray light requires secondary diagnostic tools across the visible band. Diagnostic ceramic tile sets, such as the British Ceramic Research Association Series II tiles, supply twelve color plates with calibrated spectral curves to verify instrument performance. These plates expose repeatability issues, chromatic drift, thermochromism, and inter-instrument divergence.
Regular readings on green, yellow, deep blue, and orange diagnostic tiles catch subtle lamp changes or detector wear before off-shade lots make it into production.
Evaluating fabrics finished with Optical Brightening Agents adds complexity: these chemicals absorb ultraviolet energy between 300 nanometers and 400 nanometers and re-emit visible blue light between 400 nanometers and 500 nanometers. Accurate measurement therefore requires calibrating the light source’s ultraviolet output, which shifts as pulsed xenon lamps age. UV calibration uses a fluorescing reference tile with a certified Whiteness Index determined under ISO 105-J02 or AATCC Evaluation Procedure 11 conditions.
Adjusting a motorized UV cutoff filter, or tuning a secondary UV flash lamp, aligns the UV ratio with the assigned tile value; uncalibrated output results in mismatched white and pastel readings between buyer and supplier laboratories.
The inter-instrument offset standard figure of 0.15 Delta E CMC (2:1) on diagnostic tile arrays rests on identical benchtop sphere spectrophotometers reading at 10 nanometer spectral intervals in a 20 degrees Celsius environment with a white standard plate recalibrated within twelve months. Tile surface contamination, ambient temperature swings exceeding 5 degrees Celsius, or xenon lamp flash voltage drops exceeding 15 percent widen this offset beyond visual tolerance thresholds.
- White Reference Standard calibration plate manufactured from sintered polytetrafluoroethylene or polished white ceramic, supplying top-of-scale spectral reflectance values.
- Black Light Trap optical cavity designed to swallow all incident light, establishing true zero reflectance by removing dark current noise.
- Holmium Oxide Filter sealed glass optical element containing rare-earth oxides used to verify absolute wavelength calibration across visible bands.
- Fluorescent UV Tile fluorimeter reference plate calibrated for Whiteness Index to set motorized UV cutoff filter positioning for fluorescent whitening agent measurement.
Initial spectral shifts frequently trace back to baseline factory calibration drift when software updates overwrite local tile offset tables with default parameters.


Optics
How light interacts with a textile structure introduces physical variables that alter reflected energy independently of dye concentration. Woven and knitted fabrics are complex three-dimensional lattices of twisted fibers, directional yarns, and surface pile rather than flat specular surfaces. Monochromatic light hitting textured fabric partly reflects specularly from fiber exteriors, while the rest enters the substrate, scatters through internal refractions, and exits as diffuse reflection.
Optical geometry determines whether a reading captures that specular sheen or isolates core pigment absorption, and formulating dyebaths requires separating surface finish from dye saturation.
Integrating sphere instruments, using d/8 or 8/d geometry, illuminate fabric diffusely within a specularly reflective white cavity, collecting light reflected at an 8-degree angle from perpendicular. A specular port trap door in the sphere wall controls capture mode: closing the port includes surface shine for Specular Component Included mode, whereas opening it allows specular reflection to escape into a trap for Specular Component Excluded mode. Specular Component Included measurements capture total colorant independent of surface texture, making them necessary for recipe formulation, while Specular Component Excluded measurements match human visual assessment by factoring in gloss and weave.

Aperture Selection and Specular Reflection Control
Integrating spheres collect scattered light through entry ports that define the sample evaluation area. Aperture plates adapt this field of view, spanning Small Area View at 3 to 6 millimeters diameter, Medium Area View at 10 to 15 millimeters, Large Area View at 25 to 30 millimeters, and Extra Large Area View above 30 millimeters. Using small apertures on coarse weaves or slub yarns isolates individual yarns or surface variations, producing erratic spectral curves across the same fabric roll, which makes larger apertures preferable for general measurement.
Large Area View ports aggregate optical signals across multiple weave repeats, smoothing out localized fiber differences to yield steady spatial averages on micro-denier polyesters and dense poplins. When shade matching patterned yarns or narrow elastics, Small Area View is unavoidable, requiring multiple readings across the sample to establish a reliable mean reflectance curve.

Which Aperture Size Eliminates Directional Weave Error?
Maximizing the measured surface area through large aperture ports averages localized yarn variations across woven and knitted structures. Directional weave structures, such as 3/1 twills, satins, and raised corduroys, reflect light preferentially along yarn alignment angles. A twill fabric measured parallel to the twill line produces different tristimulus values than when measured perpendicular to it.
Eliminating directional orientation errors demands a standardized rotational sample presentation routine.
- Mount the conditioned fabric specimen flat across an opaque, non-magnetic sample holder without applying tensile tension that distorts course or wale density.
- Position the sample holder over the Large Area View spectrophotometer port and execute the first spectral measurement scan.
- Rotate the sample holder ninety degrees clockwise in the specimen plane while maintaining flat surface contact against the aperture port.
- Execute the second spectral measurement scan and calculate the arithmetic average reflectance curve between the zero and ninety degree readings.
- Execute two additional rotations at 180 degrees and 270 degrees for heavy pile fabrics, averaging all four quadrant scans into a single composite spectral file.
Fabric translucency introduces another common measurement error. Lightweight materials, such as 40 gsm nylon ripstop or semi-sheer polyester organza, permit incident light to pass completely through a single layer to the backing plate, which reflects back through the cloth and distorts the detector’s readings.
Achieving true optical opacity requires stacking fabric layers until adding another layer produces no change in measured reflectance ~ a threshold known as optical infinity, or R-infinity. When material limits prevent multi-layer stacking, as in finished garment testing, single plies must be backed with a certified ceramic white tile or an inert black backing in accordance with ISO 105-J01 protocols. Using improvised backing materials leads to substantial measurement gaps between buyer laboratories and manufacturing mills.
Digital spectral files transmitted without aperture geometry specifications invalidate bulk shade guarantees under standard ISO 105-J01 dyehouse agreements.
Selecting small apertures on textured coarse-yarn fabrics produces false color variances up to 1.2 Delta E CMC, triggering unnecessary dyebath re-additions that strip tensile strength and waste processing hours.


Drift
Instrument performance gradually drifts under thermal swings, component aging, and surface contamination in production dyehouses. Spectrophotometers on the plant floor operate around shifting temperatures, variable humidity, and airborne dyestuff particles. This environmental drift shifts the physical alignment of optical benches and alters the electronic response of photodiode arrays, requiring tight environmental controls to prevent false shade approval calls.
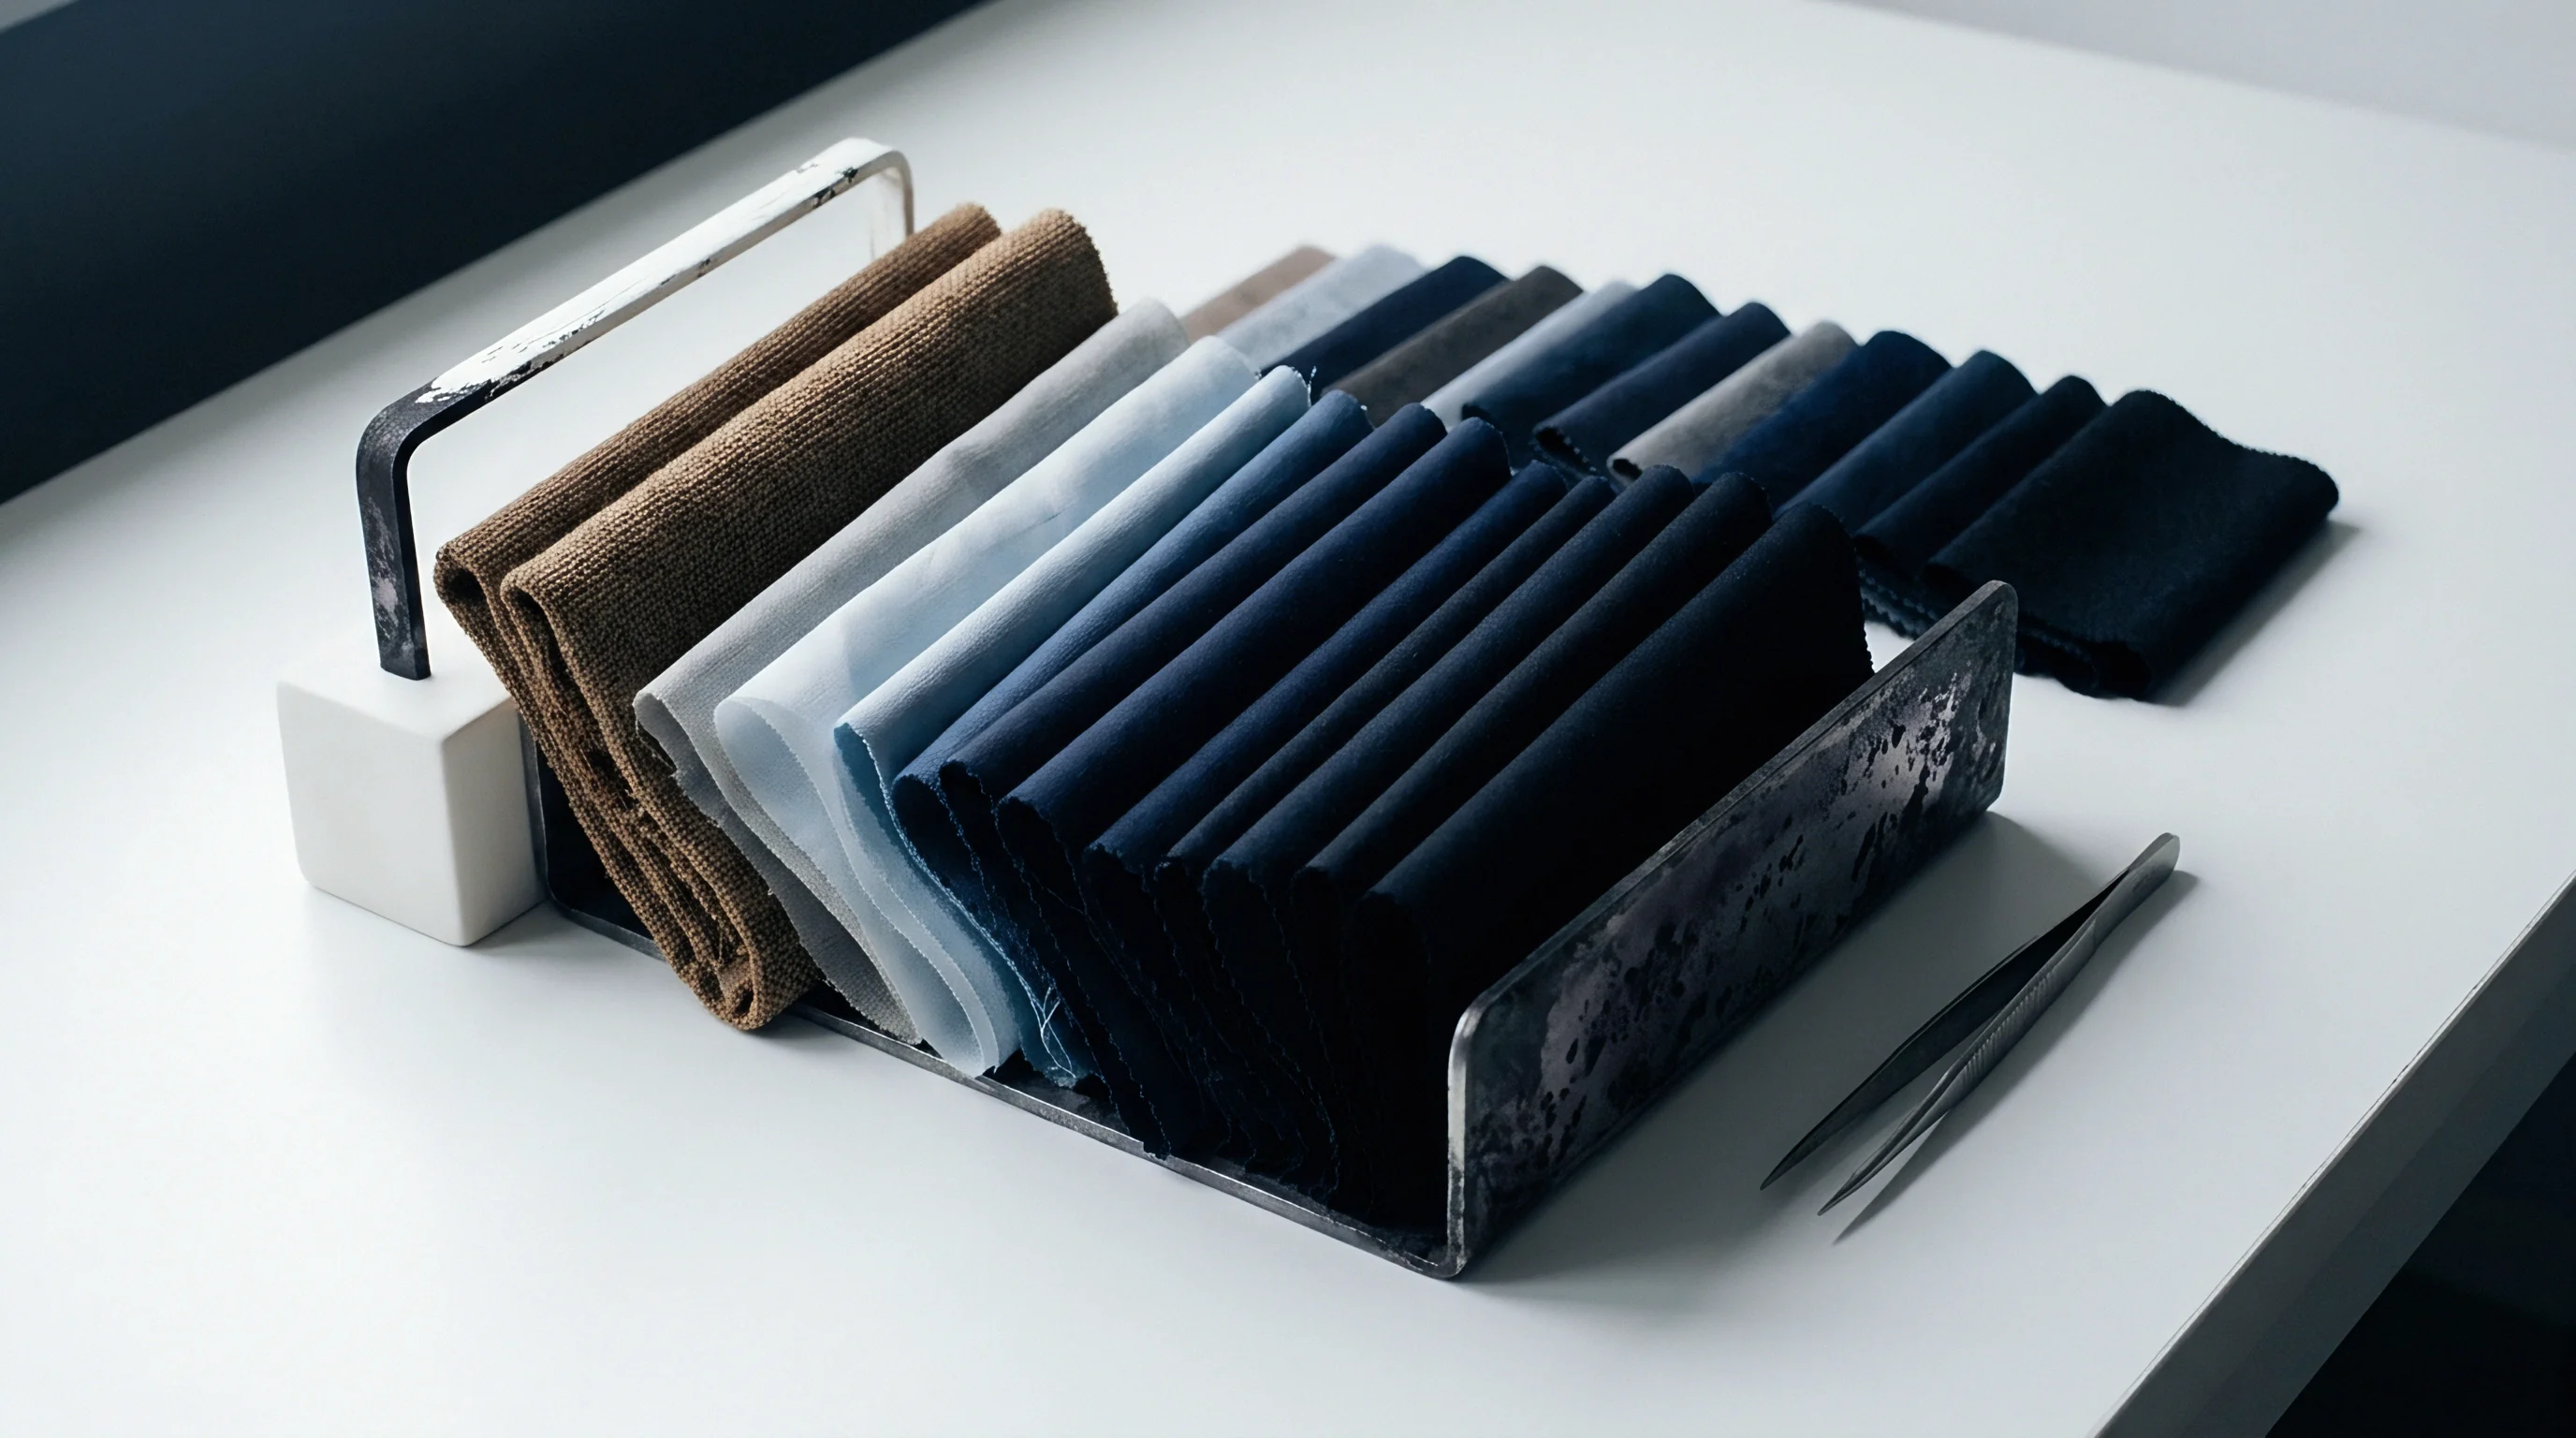
Temperature shifts have an immediate impact through thermochromism in both ceramic standards and textile substrates. Calibration tiles shift reflectance profiles as their surface temperature rises; green and orange diagnostic plates drift visibly toward darker, yellower coordinates when warm. Calibrating an instrument with a white plate kept near a warm stenter frame or in direct sun immediately throws off the optical baseline.
Environmental Factors and Standard Degradation
Maintaining stable ambient conditions in the testing laboratory protects physical reference standards. ISO 139 specifies testing environments held at 20 ± 2 degrees Celsius and 65 ± 4 percent relative humidity. Fabrics themselves are sensitive to temperature and moisture: cotton dyed with direct or reactive colorants shifts shade as it absorbs ambient moisture or cools after stenter drying.
Taking readings on warm, dry swatches straight off the frame yields invalid spectral data, so samples require conditioning in the standard atmosphere for at least four hours prior to measurement.
Tile contamination is another primary cause of baseline drift. Microscopic oil films from handling, settling dust, and vaporized finishing chemicals collect on white ceramic surfaces, where a single fingerprint absorbs ultraviolet and short-wavelength blue light. Technicians must clean ceramic plates weekly using pure isopropyl alcohol and non-abrasive, lint-free optical lens tissue, avoiding industrial solvents or mineral-bearing tap water.

Statistical Process Control and Maintenance Intervals
Tracking spectrophotometer stability requires plotting daily secondary reference readings against statistical limits on Shewhart control charts following baseline calibration. Upper and lower control limits sit at ± 0.15 Delta E CMC from the baseline mean. If daily checks exceed the upper limit on two consecutive days, the instrument is pulled from shade approval workflows for cleaning and recalibration.
Flash lamp output degrades over thousands of discharge cycles. Pulsed xenon arc lamps lose emission energy below 420 nanometers as electrodes erode and quartz envelopes darken. This drop in intensity lowers the signal-to-noise ratio at short wavelengths, introducing noise into reflectance curves for violet, blue, and fluorescent white shades.
Tracking flash counts alongside baseline noise levels indicates when a lamp requires replacement before lots run the risk of false rejections.
A nominal spectral reflectance drift rate of 0.02 Delta E units per 1,000 xenon flash cycles remains unreliable in practice because flash degradation rates vary with power supply quality, cooling airflow efficiency, and thermal cycling inside individual instrument casings. Given this operational variance, a fabric buyer must reject simple lamp-hour maintenance logs and mandate a BCRA diagnostic tile verification pass every 5,000 flashes or thirty operating days, whichever occurs first.
| Variable Parameter | Physical Impact | Standard Protocol | Control Threshold |
|---|---|---|---|
| Ambient Temperature | Causes ceramic tile thermochromism and photodiode thermal drift | Continuous HVAC climate control per ISO 139 | 20 ± 2 degrees Celsius |
| Relative Humidity | Alters moisture regain in hygroscopic cotton and viscose fibers | Desiccant dehumidification in conditioning room | 65 ± 4 percent RH |
| Tile Contamination | Attenuates UV and blue light reflectance through surface films | Isopropanol wipe with optical lens tissue | Zero visible residue |
| Xenon Lamp Decay | Reduces flash output at 360 to 420 nanometers wavelength band | Signal-to-noise ratio monitoring on dark tile | Replace at 500k flashes |
| Sample Temperature | Induces reversible dye thermochromic color shifts in swatches | Conditioning swatches prior to measurement | Minimum 4 hours tray rest |
| Methods note: Environmental specifications align with ISO 139 and ISO 105-J01 test conditions for industrial textile laboratories. | |||
Unordered set of operational failure modes triggered by unmanaged drift variables:
- Tile Thermochromism Shift where ceramic standard warming causes yellow-shift reflectance drift, corrupting baseline calibration arrays.
- Short Wavelength Lamp Noise caused by xenon bulb envelope darkening, generating inaccurate reflectance readings on fluorescent white goods.
- Substrate Hygrochromic Alteration occurring when dry fabric swatches absorb room moisture during measurement, shifting chromaticity coordinates mid-scan.
- Dirty Optical Window resulting from vaporized finishing oils condensing on internal sphere lenses, lowering photometric throughput across all bands.
Layered fabric samples mounted at optical opacity prevent background light reflection from warping target tristimulus calculations.
When ambient dyehouse temperatures rise, calibrate ceramic standard plates more frequently to prevent thermal reflectance shifts from corrupting production recipe matching.


Passband
Achieving visual and numerical alignment across dispersed spectrophotometers requires matching spatial tolerance volumes around standard color coordinates. In global textile supply chains, brand offices often issue digital color targets to remote dyehouses operating instruments of different vintages, models, or brands. Inter-instrument agreement determines how closely these separate units read the same physical swatch; poor alignment can lead a dyehouse to measure an approval while the buyer’s central laboratory records an actionable failure on the exact same lot.
Color difference equations convert raw spectral reflectance curves into three-dimensional numerical tolerances. Early CIELAB formulas used Euclidean distance models that did not align well with human vision, which tolerates broader variation in saturated shades than in neutral grays, and accepts greater lightness difference than hue shift. Modern shade approval uses elliptical tolerance models, primarily the CMC l:c formula developed by the Colour Measurement Committee of the Society of Dyers and Colourists, alongside CIEDE2000.

Inter Instrument Profiling and Spectral Equations
Aligning digital color standards between mill instruments and buyer laboratories depends on profiling algorithms. High-end benchtop spectrophotometers achieve inter-instrument agreement within 0.15 Delta E CIEDE2000 against a master instrument on smooth tiles, whereas portable or older sphere units frequently diverge by 0.30 to 0.50 Delta E. Profiling software offsets this variance by reading physical transfer tiles across target and master units, building a correction matrix that aligns local curves to the master laboratory’s coordinates.
The CMC l:c equation defines an ellipsoidal tolerance boundary around target coordinates in L a b space, with the l:c ratio weighting lightness variance against chroma variance. Commercial fabric approval typically uses a 2:1 ratio, written as CMC (2:1), which doubles the lightness tolerance axis relative to chroma to match visual acceptance in apparel. For dyebath recipe matching, a 1:1 ratio ~ CMC (1:1) ~ is used instead, placing equal weight on lightness and chroma to enforce strict chemical consistency.
Worked Calculation of Multi Illuminant Acceptance Windows
Evaluating a high-visibility 100 percent polyester twill fabric illustrates the application of tolerance envelopes under target illuminants. Take a 20,000-meter production bulk run dyed to a safety orange specification. Assume a target master digital reflectance file received in QTX file format with standard L a b tristimulus target values under primary illuminant D65 using the 10-degree standard observer.
The contract specifies a maximum allowable CMC (2:1) Delta E threshold of 0.80 under primary illuminant D65, with secondary illuminant evaluation under store light TL84 (F11) and home light Illuminant A to catch metamerism.
Spectral reflectance readings taken from roll number 45 on a benchtop d/8 sphere spectrophotometer using Large Area View Specular Component Included mode yield the following coordinate data:
Target Coordinates (D65 / 10 deg): L = 65.40, a = 48.20, b = 52.10
Roll 45 Measured Coordinates (D65 / 10 deg): L = 66.10, a = 47.50, b = 53.00
Calculating the scalar coordinate differences:
Delta L = +0.70 (Slightly lighter than target)
Delta a = -0.70 (Slightly less red / greener than target)
Delta b = +0.90 (Slightly yellower than target)
Applying the CMC (2:1) equation parameters for orange shades, where lightness weighting factor S_L = 1.15, chroma weighting factor S_C = 1.82, and hue weighting factor S_H = 0.94:
Calculated Delta E CMC (2:1) under D65 = 0.62 units.
Since 0.62 is below the 0.80 maximum threshold, roll 45 passes primary illuminant inspection.
Evaluating Roll 45 under secondary illuminant TL84 (F11 / 10 deg):
Target Coordinates (TL84): L = 64.80, a = 42.10, b = 50.30
Roll 45 Measured Coordinates (TL84): L = 65.80, a = 40.80, b = 51.90
Calculated Delta E CMC (2:1) under TL84 = 0.94 units.
Evaluating Roll 45 under tertiary illuminant A (A / 10 deg):
Target Coordinates (Illuminant A): L = 66.10, a = 52.30, b = 48.10
Roll 45 Measured Coordinates (Illuminant A): L = 67.20, a = 50.80, b = 50.10
Calculated Delta E CMC (2:1) under Illuminant A = 1.12 units.
The Metamerism Index, calculated as the change in color difference between primary illuminant D65 and secondary illuminant TL84, equals 0.48. Although Roll 45 passed under primary daylight D65, the shade flares significantly under store lighting TL84 and home lighting Illuminant A, exceeding the contract secondary limit of 0.85 Delta E CMC. The batch fails shade approval due to illuminant metamerism caused by improper dye selection at the dyehouse.
The inter-instrument agreement tolerance figure of 0.20 Delta E CMC (2:1) across production mills rests on identical benchtop sphere instruments using 25-millimeter Large Area View apertures, standardized sample rotation protocols, and verified digital tile profiling matrices. Comparing benchtop d/8 sphere units to portable 45/0 directional units, reducing aperture size to Small Area View, or allowing UV calibration filter positions to drift moves this inter-instrument variance up to 0.75 Delta E CMC, completely consuming the commercial pass window.
| Fabric End-Use Category | Primary Illuminant | Secondary Illuminant | Target Metric | Pass Threshold Window |
|---|---|---|---|---|
| High-Visibility Workwear | D65 / 10 deg | TL84 / F11 | Delta E CMC (2:1) | Primary ≤ 0.80 / MI ≤ 0.50 |
| Automotive Upholstery | D65 / 10 deg | A / 10 deg | CIEDE2000 (dE00) | Primary ≤ 0.50 / MI ≤ 0.30 |
| Military Uniform Twills | D65 / 10 deg | CWF / Horizon | Delta E CMC (1.5:1) | Primary ≤ 0.60 / MI ≤ 0.40 |
| Fast-Fashion Cotton Knits | D65 / 10 deg | TL84 / F11 | Delta E CMC (2:1) | Primary ≤ 1.20 / MI ≤ 0.80 |
| Technical Shell Outerwear | D65 / 10 deg | D50 / Incandescent | CIEDE2000 (dE00) | Primary ≤ 0.70 / MI ≤ 0.40 |
Decision considerations for establishing inter-instrument calibration workflows:
- Master Spectrophotometer Selection designating a single, benchtop spectrophotometer at buyer headquarters as the baseline reference against which all vendor instruments profile.
- Digital File Standardization enforcing the transmission of full spectral reflectance files in QTX or CxF3 formats rather than truncated L a b coordinate points.
- Aperture Alignment Rules mandating that both supplier and buyer laboratories use identical Large Area View aperture sizes and Specular Component Included modes.
- Secondary Illuminant Control setting strict mathematical limits on Metamerism Index values between daylight D65 and retail store illuminants like TL84 or CWF.
Dual benchtop spectrophotometers yield divergent spectral curves whenever UV cutoff filter alignment strays during optical brightener evaluation.
Whether digital profiling algorithms can completely eliminate inter-model spectral variance between older d/8 sphere benchtop units and modern multi-angle LED spectrophotometers remains a subject of ongoing field dispute.

Contract
Translating spectral reflectance measurements into enforceable procurement terms establishes the legal baseline between buyers and dyehouses. Where conventional shade approvals once took up to two weeks mailing physical cuttings, digital file transfers compress approvals into hours. To give digital submissions contractual weight, buyers and suppliers attach explicit optical calibration and shade approval protocols to the fabric purchase agreement.
Master digital standards must record raw spectral reflectance rather than isolated tristimulus coordinates for a single light source. Storing full reflectance data at 10-nanometer intervals preserves the optical profile of the substrate, allowing recalculation under alternative illuminants without re-reading physical swatches. Purchase contracts must define the file format version, aperture size, specular mode, and calibration log rules required for every submission.

Digital Shade Submissions and Master Data File Architecture
Eliminating physical swatch approvals shortens lab-dip sign-off schedules from weeks to hours. A mill reads a newly dyed lab dip or production bulk roll on an audited, calibrated spectrophotometer, attaches the instrument calibration certificate log file, and uploads the QTX dataset to the buyer server. Software instantly calculates Delta E CMC values across required illuminants.
If the numeric color difference falls inside the contractually agreed passband, the software issues an automated digital approval tag, allowing the mill to commence bulk tentering or roll packing immediately.
Requiring an embedded calibration log prevents data manipulation and highlights instrument drift before errors reach bulk production. A valid log details the timestamp, operator identity, white tile serial number, black trap confirmation, and recent BCRA drift data. Submissions without a valid calibration log are automatically held by procurement servers, stopping shipment approval until recalibration is recorded.
Shade Sorting Bins and Commercial Dispute Arbitration
Grouping bulk fabric production into uniform color blocks prevents panel shading across assembled garments. Minor shade shifts are routine across a 100,000-meter run, leading mills to apply 555 sorting algorithms that place rolls into three-dimensional color bins in L a b space. In this structure, 5 represents the central target, while 1 to 4 and 6 to 9 define offset bins across lightness, chroma, and hue.
Cutting rooms only mix rolls sharing identical 555 codes in a single marker to prevent mismatched panels in finished apparel.
Arbitration protocols govern scenarios where a buyer rejects a shipment that the mill cleared as a numerical pass, establishing clear procedural steps to resolve disputes before production stalls.
| Discrepancy Trigger | Commercial Consequence | Contractual Mitigation Clause |
|---|---|---|
| Uncalibrated UV Filter | Bulk pastel goods fail buyer visual daylight check | Mandate daily ISO 105-J02 fluorescent tile verification |
| Mismatched Aperture Size | Inter-lab Delta E discrepancy of 0.80 CMC units | Specify LAV port size on purchase order terms |
| Missing Calibration Log | System blocks digital roll release, delaying freight | Automated server quarantine for unverified QTX files |
| Uncontrolled Backing Plate | Translucency error skews light goods measurements | Specify four-layer opacity or standard white tile backing |
| Illuminant Metamerism | Garments shift shade under store retail lighting | Enforce strict Metamerism Index cap of ≤ 0.50 |
Contractual arbitration workflows follow a strict three-tier structure. First, the buyer re-tests physical swatch headers cut from the disputed fabric rolls using their calibrated master spectrophotometer. Second, if the buyer instrument confirms a failure while the mill instrument logged a pass, both parties run diagnostic BCRA tile sets to identify instrument calibration drift or aperture mismatch.
Third, if instrument calibration parity is verified, an independent accredited textile testing facility performs reference measurements. The third-party measurement serves as binding arbitration, determining whether the mill pays re-dyeing chargebacks or the buyer accepts roll delivery without financial penalty.
Inserting standard ISO 105-J01 compliance clauses requiring digital CxF3 spectral file exchange with verified tile calibration logs converts subjective color disputes into binding numeric audits.