Standardizing Spectrophotometric Reflectance Matrices across Independent Dyeing Facilities
Standardizing digital reflectance matrices demands locking aperture diameters, port glass usage, sample orientation, and UV profiles across all participating mills.


Bench
Spectrophotometric reflectance matrices fail across independent dyehouses because optical geometries, flash energy distributions, and sample presentation routines vary between mills. A numerical standard sent by digital communications to five separate dyehouses yields five distinct dye lots. The discrepancy traces directly to differences in hardware architecture, gloss trap mechanics, and sample conditioning environments.
When independent dyehouses measure the same dyed lot under ASTM E1331 using diffuse eight-degree spherical geometry, specular inclusion or exclusion modes generate diverging reflectance curves at thirty-one discrete wavelength intervals across the 400 to 700 nanometre range.
Inter-instrument agreement between modern benchtop spectrophotometers spans a Delta E CMC (2:1) range of 0.08 to 0.15 on polished ceramic tiles. The variance expands to 0.45 to 0.85 Delta E CMC once the target shifts to a 200 grams per square metre cotton single jersey. The knit structure compresses under the measurement port, introducing non-planar shadowing that the specular aperture registers as dye concentration variance.
Mills operating d/8 sphere geometries with pulsed xenon sources capture different surface scattering profiles than mills using dual-beam continuous tungsten-halogen illumination with 45/0 circumferential arrays governed by ASTM E1349. A buyer attempting to clear production lots against digital standards without locking aperture diameter, UV filtering, and backing substrate exposes the production programme to unresolvable commercial disputes.
A 0.15 Delta E variance on polished ceramic expands to 0.60 Delta E on a brushed circular knit under uncontrolled port pressure.
Sample orientation introduces directional reflectance shifts in woven and knitted goods. Twill weaves, satins, and brushed fleece present asymmetric micro-shadows relative to the illumination plane. ASTM E1164 dictates averaging four reads rotated ninety degrees to nullify directional structure bias.
A technician measuring a 3/1 twill in a single orientation introduces an artificial reflectance fluctuation of up to 1.2 percent at 550 nanometres. That measurement error changes the calculated batch addition in a recipe prediction model. The Dyehouse Auditor recognizes that physical measurement discipline dictates data validity long before dyeing mechanics enter the evaluation.
Glass plate placement over the measurement port alters the refractive index between the sample and the sphere cavity. Using port glass suppresses fabric surface hairiness and protects internal sphere optics from loose lint contamination. It also shifts the refractive index interface from air-fibre to air-glass-fibre.
This shift attenuates light return by approximately 4.0 percent across the entire visible spectrum. One facility testing behind optical glass and a sister facility testing with open apertures generate non-comparable matrices from identical fabric swatches.
Physical sample conditioning controls moisture equilibrium, a critical driver of reflectance curves in hygroscopic fibres. ISO 139 specifies conditioning at twenty degrees Celsius plus or minus two degrees, and sixty-five percent relative humidity plus or minus four percent. Cellulosic fibres lose apparent depth of shade as moisture content increases.
An under-conditioned cotton twill measured hot off the stenter frame reads significantly lighter and yellower than the same specimen rested for four hours under standard atmospheric conditions. Moisture absorption alters the refractive index of the cellulose matrix, suppressing interior light reflection and artificially shifting chromaticity coordinates.
The standard operating procedure in wet processing contracts often asserts that electronic colorimetric exchange replaces physical standard swatches entirely.

Aperture
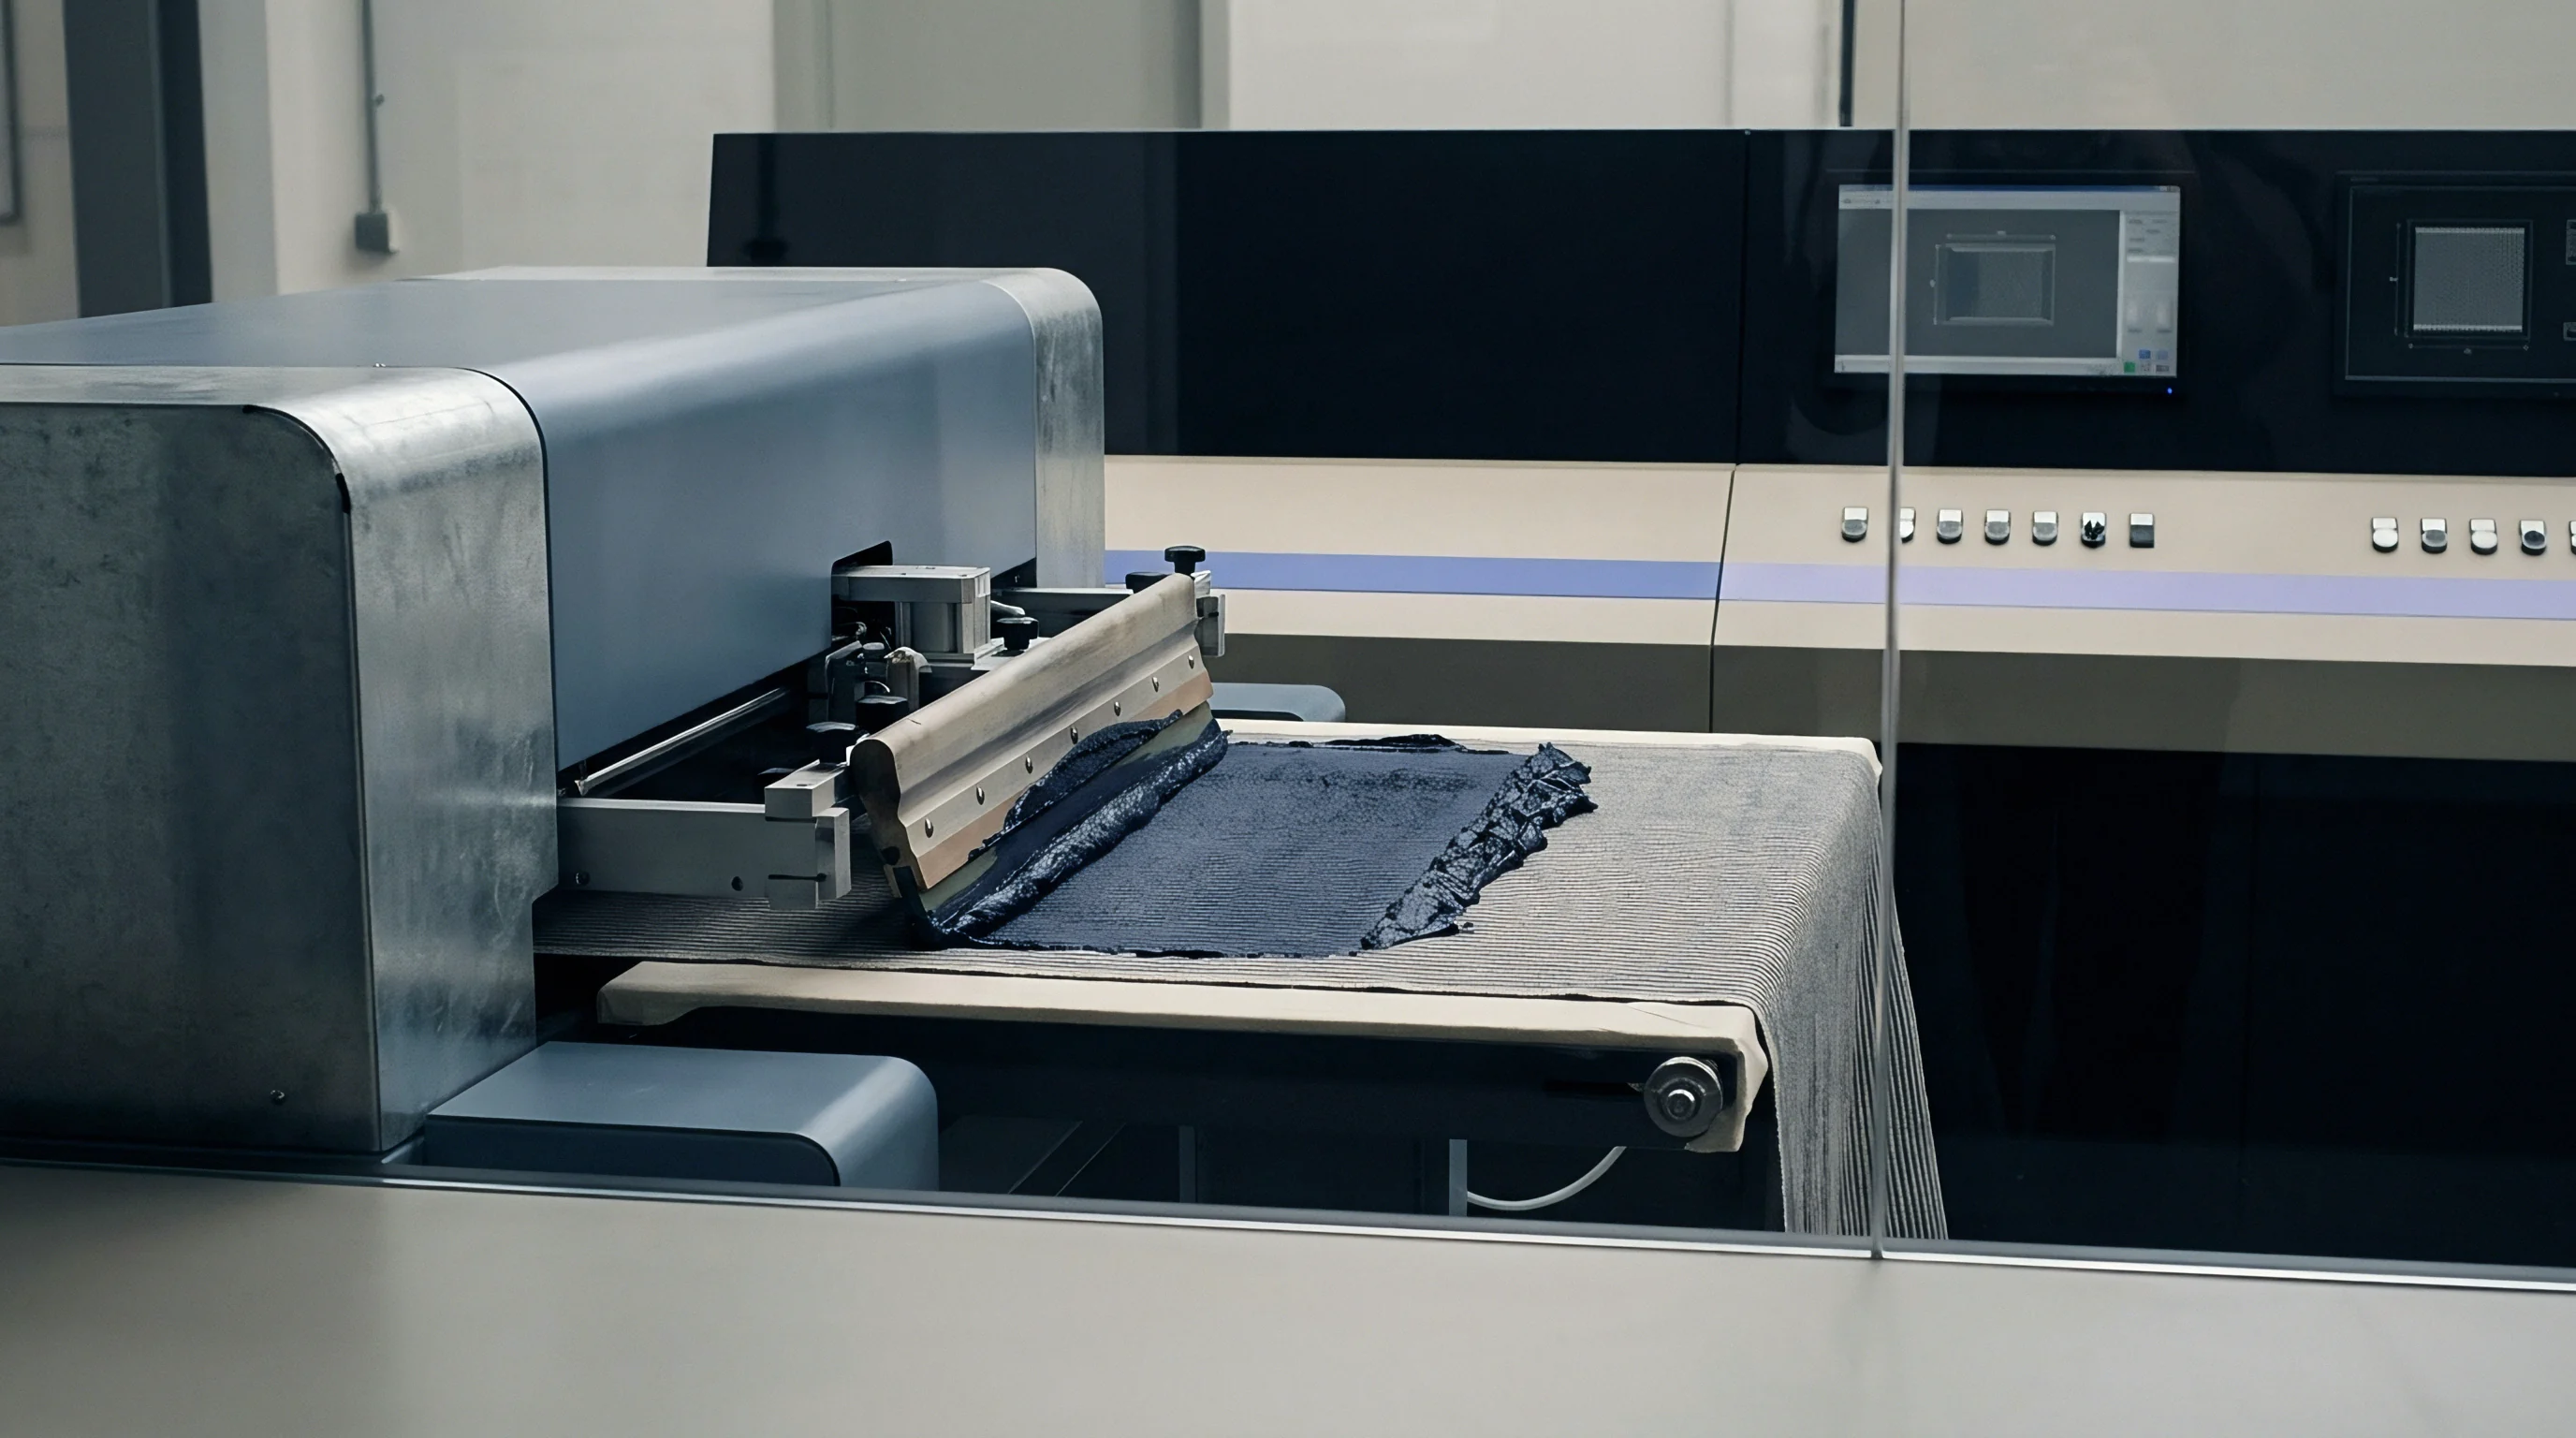
Optical ports interact mechanically with yarn cross-sections and loop densities. Selecting the port size determines the spatial sample size integrated by the spectrophotometer integrating sphere. Standard aperture plates range from small area view at three to six millimetres, through medium area view at ten to fourteen millimetres, to large area view at twenty-five to thirty millimetres.
Fine gauge fabrics like a 32-gauge filament polyester interlock produce stable reflectance data under medium area view ports. Low-gauge fabrics, coarse woolens, and open-sett linen structures demand large area view ports to capture representative yarn-to-interstice ratios.

Aperture Plate Dimensions across Fabric Structures
A smaller port diameter measures fewer warp and weft intersections. When the field of view covers fewer than twenty yarn crossings, structural variations dominate the reflectance signature. The spectrophotometer registers the interstitial void between yarns as pure absorption, falsifying the spectral reflectance factor R at each wavelength interval.
| Fabric Construction | Sett or Gauge | Finished Weight | Aperture Size | Rotation Requirement | Repeatability Tolerance |
|---|---|---|---|---|---|
| Plain Weave Combed Cotton | 133 x 72 yarns/inch | 115 g/m² | 25.4 mm (LAV) | 2 reads at 90 degrees | Delta E CMC under 0.08 |
| Single Jersey Combed Cotton | 28 gauge / 38 wales/inch | 160 g/m² | 25.4 mm (LAV) | 4 reads at 90 degrees | Delta E CMC under 0.12 |
| Twill Weave Cotton Chino | 108 x 56 yarns/inch | 245 g/m² | 25.4 mm (LAV) | 4 reads at 90 degrees | Delta E CMC under 0.10 |
| Circular Knit Brushed Fleece | 20 gauge / 28 wales/inch | 320 g/m² | 30.0 mm (XAV) | 4 reads at 90 degrees | Delta E CMC under 0.20 |
| Filament Nylon Plain Ripstop | 120 x 120 yarns/inch | 45 g/m² | 15.0 mm (MAV) | 2 reads at 90 degrees | Delta E CMC under 0.06 |
| Worsted Wool 2/2 Twill Suiting | 78 x 70 yarns/inch | 280 g/m² | 25.4 mm (LAV) | 4 reads at 90 degrees | Delta E CMC under 0.14 |
Pillowing degrades spectrophotometric repeatability when measuring pliable structures. When pneumatic sample holders clamp soft circular knits against an open port, the cloth protrudes into the integrating sphere cavity. This physical intrusion alters the internal sphere geometry and absorbs diffuse light before it reaches the photodiode array.
Protrusion of 1.5 millimetres into the sphere shifts absolute reflectance values downward by 0.8 to 1.5 percent, falsely signaling a deeper shade to the colour formulation engine. Controlling clamp pressure through calibrated spring arms or regulated pneumatic rams prevents structural distortion.
Sample thickness and layer stacking dictate optical opacity. ISO 105-J01 dictates folding the test specimen until additional layers produce zero measurable change in spectral reflectance across all wavelengths. Lightweight sheer fabrics, including 40 grams per square metre filament voiles, demand up to eight layers to achieve opacity.
Heavy bottom-weight twills achieve optical opacity with two layers. Placing an uncalibrated white backing tile behind a translucent sample corrupts the matrix through background reflectance transmission. A standardized white backing ceramic tile or a light-trapping black cavity with certified reflectance below 0.5 percent stabilizes readings across decentralized supply operations.
Specular component inclusion captures total light reflection, encompassing both diffuse scattering from within the fibre substrate and gloss reflection from the yarn surface. The specular component excluded mode isolates diffuse colour by deflecting surface gloss out through a specular exit port. Dyehouses measuring resin-treated, calendered, or water-repellent fabrics must lock the specular component mode.
Calendering flattens surface yarns, increasing specular reflection while leaving dye mass intact. A specular included reading records identical values before and after calendering, whereas a specular excluded reading detects a false shade change of 1.5 Delta E CMC. Failure to align the specular trap mode across plants destroys spectral matrix parity.
Ignoring port mechanics and sample presentation variables invalidates inter-mill spectral parity regardless of subsequent mathematical harmonization.

Drift
Instrument maintenance regimes govern long-term spectral integrity across dispersed dyehouses. Integrating spheres undergo progressive degradation as airborne finish mists, vaporized acetic acid, and particulate lint deposit onto internal barium sulfate coatings. A decline in sphere wall reflectance reduces measurement signal-to-noise ratios, disproportionately skewing the short-wavelength blue region between 400 and 460 nanometres.
Spectrophotometers run calibration routines against working ceramic white tiles daily, but the tiles themselves accumulate micro-abrasions and grease films that distort baseline zero-and-hundred percent lines.
UV energy emitted by spectrophotometer flash sources decays as xenon lamps age. This decay directly undermines colour assessment on substrates treated with optical brightening agents or dyed with fluorescent chemistry. Standard white calibration tiles lack fluorescent properties and fail to register UV component decay.
Controlling the UV illumination profile requires calibrating the light engine against fluorescent plastic or textile transfer standards with certified whiteness values, such as the Hohenstein or Ganz-Griesser standards described in ISO 105-J02. Operating uncalibrated UV filters causes two sister mills reading the same optically brightened white cotton interlock to register a Ganz whiteness divergence exceeding twelve points.
A working calibration tile cleaned with unapproved solvents loses surface micro-topography and alters baseline readings across thirty-one wavelength bands.
Diagnostic profiling across separate facilities relies on circulating physical diagnostic tile sets. Calibrated green tiles provide high spectral sensitivity in the mid-band region where chromatic shifts manifest rapidly. Standardized diagnostic sets, like the British Ceramic Research Association (BCRA) Series II tiles, map wavelength accuracy, photometric scale linearity, and stray light levels across thirty-one bins.
Profiling ten spectrophotometers across four processing facilities with a BCRA tile set reveals inter-instrument variability before fabric lots arrive at the dyehouse.
Temperature fluctuations inside the spectrophotometer chassis cause electronic sensor drift. Silicon photodiode arrays exhibit temperature-dependent dark current responses. An instrument operating in an unconditioned dyehouse laboratory where ambient temperatures swing from eighteen to thirty-four degrees Celsius experiences photometric scale drift.
The resulting spectral reflectance reads deviate by up to 0.35 Delta E CMC on medium neutral grey shades. Environmental isolation units or strict temperature-controlled laboratory envelopes keep the benchtop within a two-degree operating envelope, preserving matrix fidelity.
Hardware aging combined with inconsistent cleaning protocols guarantees that unmonitored instruments drift out of acceptable calibration bounds within six months of deployment.


Profile
Transforming raw reflectance factors into cross-facility production matches requires profiling mathematical differences between instruments. Even pristine instruments of identical make and model yield minor variations due to manufacturing tolerances in holographic diffraction gratings and sphere manufacturing. When independent supply chains feature diverse hardware fleets, mathematical profiling harmonizes disparate 31-point spectral vectors.
This profiling constructs profiling matrices that map slave instrument outputs onto a master spectrophotometer standard.
Are Mathematical Profiling Matrices Sufficient for Mill Certification?
Profiling transforms raw spectral data through linear and polynomial regression matrices. The master instrument measures a comprehensive set of physical diagnostic standards, generating target vector R_master(lambda). The secondary instrument measures the identical standard set, generating vector R_slave(lambda).
A transformation matrix, derived through least-squares optimization, bridges the spectral gap across the visible wavelengths.
Linear profiling models correct small baseline and slope shifts in reflectance factors:
R_corrected(lambda) = A(lambda) multiplied by R_slave(lambda) plus B(lambda)
Where A represents the wavelength-specific photometric gain coefficient and B represents the offset baseline coefficient. Gain and offset parameters resolve small, uniform discrepancies across mid-depth tones. They collapse when handling saturated dyeings where absorption approaches 99.0 percent at peak absorption bands, pushing reflectance down toward 1.0 percent.
Saturated reactive dyed shades, such as deep navy and sulphur black on heavyweight twills, require polynomial or multi-dimensional interpolation transforms to prevent spectral compression at low reflectance levels.
Transformation matrices fail when secondary instruments suffer from wavelength scale errors, where diffraction gratings misalign by one or two nanometres. A two-nanometre shift at a steep spectral slope introduces vast errors in calculated tristimulus values X, Y, and Z. The calculation of CIELAB colour coordinates L , a , b relies on weighted spectral integration tables defined in ASTM E308. If the wavelength alignment drifts, mathematical transformation models amplify noise rather than eliminating error.
Physical hardware alignment must precede software profiling.
Standardizing matrix exchanges between different operating architectures involves discrete computational steps:
- Baseline Spectral Validation establishes inter-instrument agreement on non-fluorescent BCRA ceramic tiles, rejecting any slave spectrophotometer displaying a raw Delta E CMC exceeding 0.20 against master hardware.
- Wavelength Scale Alignment verifies peak absorption bands using holmium oxide or didymium optical filters, correcting grating positions if band shifts exceed 0.5 nanometres.
- Substrate-Specific Profiling measures master diagnostic fabric swatches representing target builds, generating discrete transformation vectors for knits, wovens, and texturized goods.
- Matrix Implementation loads calibration matrices into local formulation and quality control software engines, locking output data against secondary tampering.
- Blind Verification measures a fresh set of control dyed swatches, verifying that corrected slave data tracks master readings within an operational threshold of 0.15 Delta E CMC.
A transformation profile calibrated exclusively on flat woven fabrics fails when applied to circular knits or pile fabrics. Surface geometry changes the angular distribution of reflected light within the integrating sphere. A mathematical transfer function must be generated for each distinct substrate class to maintain consistency across independent processing plants.
The Dyehouse Auditor observes that profiling profiles the optical system, not the operator, and human error at the loading port breaks the most precise transformation matrix.

Recipe
Translating unified spectrophotometric matrices into production dyeings occurs through computer colour matching systems governed by Kubelka-Munk single-constant or multi-constant theory. The classic single-constant relationship balances absorption K and scattering S through the measured reflectance factor R of an optically opaque layer:
K over S equals the square of the difference between one and R, divided by two multiplied by R
Where K/S is directly proportional to dyestuff concentration on the fibre substrate, assuming the textile substrate dictates overall scattering. The assumption holds for opaque, un-brightened woven fabrics dyed to pale and medium depths with soluble dyestuffs. It fails when applied to lightweight micro-denier polyester or heavily texturized knits where internal fiber-air boundaries scatter light non-linearly.

Predictive Dyestuff Formulations under Multi-Facility Operations
Disperse dyes applied to synthetic yarns migrate across the polymer cross-section during high-temperature beam or jet dyeing. High-filament micro-denier yarns possess vastly greater specific surface areas than standard denier yarns. A 50-denier, 72-filament yarn scatters light far more aggressively than a 50-denier, 24-filament yarn.
When dyed with an identical absolute mass of dyestuff per unit fabric weight, the micro-denier construction reads visually lighter. The spectrophotometer detects this elevated scattering as an apparent drop in K/S value. Recipe formulation engines operating across independent facilities must maintain substrate-specific K/S calibration curves.
Relying on generic fiber database files causes off-shade first-pass lab dips across external mills.
A thirty percent increase in yarn filament count cuts apparent optical depth in half, demanding substantial recipe mass adjustments to achieve target spectral reflectance.
The dyehouse team encounters continuous metameric risks when formulating target matrices. Metamerism occurs when two specimens match under one illuminant, such as CIE Standard Illuminant D65, but diverge radically under Illuminant A or Illuminant F11. When independent dyehouses formulate recipes using different dye classes or mismatched trichromatic dyestuff combinations to hit the same digital target, metamerism index values climb.
| Dyestuff Combination | Dye Class | D65 Delta E CMC | A Delta E CMC | F11 Delta E CMC | Metameric Risk |
|---|---|---|---|---|---|
| Reactive Blue 21 / Red 195 / Yellow 145 | Vinyl Sulfone / Monochlorotriazine | 0.20 | 0.35 | 0.40 | Acceptable commercial match |
| Reactive Blue 222 / Red 223 / Yellow 145 | Polyfunctional Reactive | 0.15 | 0.25 | 0.30 | Tight commercial match |
| Direct Blue 86 / Red 80 / Yellow 106 | Direct Metallized | 0.22 | 1.45 | 1.80 | Severe metameric flare |
| Vat Blue 6 / Red 15 / Yellow 33 | Anthraquinone Vat | 0.30 | 0.85 | 0.95 | Moderate flare under store lighting |
| Sulphur Black 1 / Reactive Red Mix | Sulphur / Reactive Hybrid | 0.40 | 1.60 | 2.10 | Catastrophic retail mismatch |
Dye selection impacts chemical build-up limits. When pushing reactive dyes on cotton beyond four percent total dye on weight of fabric, internal absorption channels saturate. Adding additional dye chemistry alters the mechanical hand of the finished goods and elevates washing-off cycles without moving the measured spectral curve.
Unstandardized facilities often attempt to force a digital match by loading extra dyestuff into the bath. This practice leaves unreacted hydrolyzed dye loosely bound to the surface, causing failed colour fastness ratings under ISO 105-C06 wash protocols and ISO 105-X12 crocking tests.
A supplier explains the resulting variance by pointing out that the customer provided a spectral target rather than a dyestuff recipe, leaving the chemistry selection to plant discretion.


Wash
Reflectance curves undergo dramatic shifts during wet and dry finishing procedures downstream from the dye vat. Fabric leaving a jet dyeing machine does not exhibit its permanent optical identity. Subsequent passes through stenter drying, mechanical compacting, resin curing, or softening treatments alter yarn geometry and fibre surface chemistry.
These alterations permanently modify how light enters the structure and reflects back to the spectrophotometer port.

Does Finishing Chemistry Alter the Reflectance Matrix?
Topical finishing agents alter the boundary refractive index of the textile assembly. Applying cationic polysiloxane micro-emulsion softeners to cotton goods lowers surface scattering, rendering the fabric visibly darker and more chromatic. An unsoftened sample read against a softened batch shows an artificial Delta E CMC difference of 0.40 to 0.75, weighted heavily toward the L lightness coordinate.
Fluorocarbon water-repellent polymers coat exterior filaments with a low-surface-energy film that introduces slight spectral hazing, depressing deep shade saturations. The Route Strategist identifies that omitting finishing chemistry parameters from the central colour dossier invalidates inter-mill spectral alignment.
Chemical resin treatments applied to woven cotton for crease recovery, like dimethyloldihydroxyethyleneurea (DMDHEU), react with cellulosic hydroxyl groups under high-temperature acidic curing. This acid-catalyzed thermal process causes yellowing of the base substrate, raising reflectance between 580 and 700 nanometres while depressing reflectance in the violet-blue spectrum. A facility measuring shades after stenter drying without curing the DMDHEU crosslinking agent transmits an unrepresentative reflectance matrix to central quality databases.
Once cured at 160 degrees Celsius for three minutes, the batch shifts permanently out of spec.
Thermal shade change alters measurements taken directly from finishing machinery. Thermochromism in specific dye chemistries, such as turquoise reactive dyes and disperse red pigments on polyester, causes temporary colour shifts at elevated temperatures. A hot roll measured immediately off the stenter exit reads redder and duller than its fully conditioned state.
If the inspection frame operator tests the fabric without cooling and conditioning to ISO 139 standards, the reading reflects transient thermal excitation rather than true bulk shade.
Mechanical fabric relaxation through open-width washing and sanforizing alters stitch and yarn settlements. Sanforization compacts woven goods along the warp axis, driving the pick count upward. A twill shifting from 56 picks per inch to 62 picks per inch increases yarn surface density per unit area.
This compression decreases macro-porosity, reducing light trapping within the structure and lifting overall reflectance factors by up to 2.0 percent. The Dyehouse Auditor monitors compaction parameters closely to prevent false shade rejections during final roll packaging.
Post-dyeing processes move the measured reflectance curves sufficiently to fail lots that hit perfect spectrophotometric numbers right out of the dye bath.
Freight
Spectral matrix standardization across independent dyehouses operates under direct commercial and operational constraints. Deploying decentralized production networks allows apparel buyers to bypass vertical supply single-source bottlenecks. It simultaneously introduces logistical friction, equipment audits, and legal accountability boundaries.
Aligning spectrophotometers across independent mills across distinct geographic territories requires binding quality service agreements with defined financial obligations for off-spec production.
The landed cost of an off-shade bulk run encompasses far more than the dyehouse re-dyeing penalty. If a mill ships fifteen thousand metres of single jersey dyed out of spectral tolerance against an approved digital target, stripping and re-dyeing causes structural degradation. Stripping reactive dyes from cotton via sodium hydrosulphite and caustic soda weakens tensile strength, dropping values under ISO 13934-1 by twelve to twenty percent.
Pilling ratings under ISO 12945-2 drop from a grade 4 to a borderline grade 2-3 due to chemical damage to surface fibers. Re-dyeing turns prime-grade fabric into factory off-cuts, disrupting assembly schedules in sewing facilities three borders away.
Independent dyehouses often push back against tight digital tolerance mandates, arguing that physical lab dip approvals hold legal primacy. Lab dip swatches sent through air courier take seven to ten business days to cycle through submission, physical light box evaluation, and written commercial sign-off. A completely standardized digital spectrophotometric matrix network cuts this submission cycle down to twelve minutes via encrypted data exchange.
The table below illustrates the operational lead time and capital differences across differing colour clearance pathways.
| Approval Pathway | Average Lead Time | Air Courier Cost per Batch | Standard Tolerance Target | Re-Dyeing Commercial Exposure |
|---|---|---|---|---|
| Physical Swatch Air Courier | 10 to 14 business days | 120 to 180 USD | Visual Grade 4-5 Under D65 | Buyer assumes risk after physical sign-off |
| Hybrid Swatch and Local Spectro | 4 to 6 business days | 60 to 90 USD | Delta E CMC under 0.80 | Split liability based on mill lab test sheet |
| Harmonized Digital Matrix Fleet | 1 to 2 business hours | Zero direct transport | Delta E CMC under 0.50 (D65, A, F11) | Full mill liability based on logged spectral data |
| Uncalibrated Independent Digital | 1 to 2 business hours | Zero direct transport | Nominal Delta E CMC under 0.60 | Unresolvable vendor dispute on instrument variance |
Managing an independent supply network requires establishing minimum batch parameters alongside digital matrices. An independent mill accepting small orders below minimum colour quantities (MCQs) of 500 kilograms relies on atmospheric sample jets. These sample jets use liquor ratios of 1:8 to 1:10, whereas full-scale production jet dyeing machines operate at 1:4 to 1:6.
Liquor ratio shifts dictate dyestuff exhaustion rates, changing the final reflectance spectrum. The buyer must enforce identical production liquor parameters regardless of whether a dyehouse executes a prototype run or a fifteen-tonne commercial dye lot.
Standardizing spectrophotometric reflectance matrices across independent dyehouses demands continuous technical auditing, precise sample presentation protocols, mathematical profile management, and unyielding contractual governance. Technology platforms facilitate real-time mathematical harmonization, but physical control over fabric conditioning, port presentation, UV lamp output, and finishing chemistry establishes whether the cloth cut in the garment factory matches the panels cut beside it.
The contract clause specifying that electronic data upload constitutes final lot approval shifts all subsequent visual shade risk entirely to the manufacturing buyer.