Predictive Aerodynamic and Tribological Modeling for Binary Staple Fiber Phase Segregation Prevention
Coupled aerodynamic and tribological modeling prevents binary staple segregation during pneumatic convey, securing blend accuracy and avoiding tariff reclassification.


Draft
Processing binary staple fibers relies on moving mixed polymers through high-velocity air streams without separating them. When short synthetic fibers join natural or regenerated cellulosics in pneumatic lines, fluid dynamics act differently on each fiber type. High-speed blowroom transport ducts move fiber tufts and loose staples at speeds between twelve and twenty-five meters per second.
Velocity gradients across these channels generate uneven drag on fibers with different linear densities, cross-sectional shapes, and crimp profiles. Segregation inside the ducting can permanently skew the blend ratio ~ both lengthways and across the width ~ well before the material ever reaches the carding chute.
Airflow geometry dictates phase separation. In a standard mix of one point five decitex polyester staple and combed cotton with a four point zero average micronaire, the two fibers behave very differently under the same static pressure gradient.

Differential Aerodynamic Drag in Pneumatic Ducting
Conveying raw tufts requires keeping them evenly suspended in the turbulent core of the air stream. Momentum transfer between the air and a single fiber depends on its dimensionless drag coefficient, which changes with aspect ratio, cross-sectional shape, and crimp frequency per unit length. Circular synthetic fibers face lower form drag than kidney-bean cotton or trilobal filaments.
As a result, the air stream carries smooth synthetics faster down the centerline, while rougher, crimped fibers slow down in the boundary layer near the pipe walls.
Differences in polymer density make this separation worse. Polyethylene terephthalate has a density of one point three eight grams per cubic centimeter, compared to one point five four for scoured cotton and one point five two for regenerated viscose staple. Even when two fibers share the exact same cut length, their settling velocities and inertia differ.
Light, fine synthetic fibers get pulled into low-pressure eddies around duct turns, while denser fibers keep their straight-line momentum, striking duct walls and gathering along the outer bends.
Boundary Layer Separation in Chute Feed Geometry
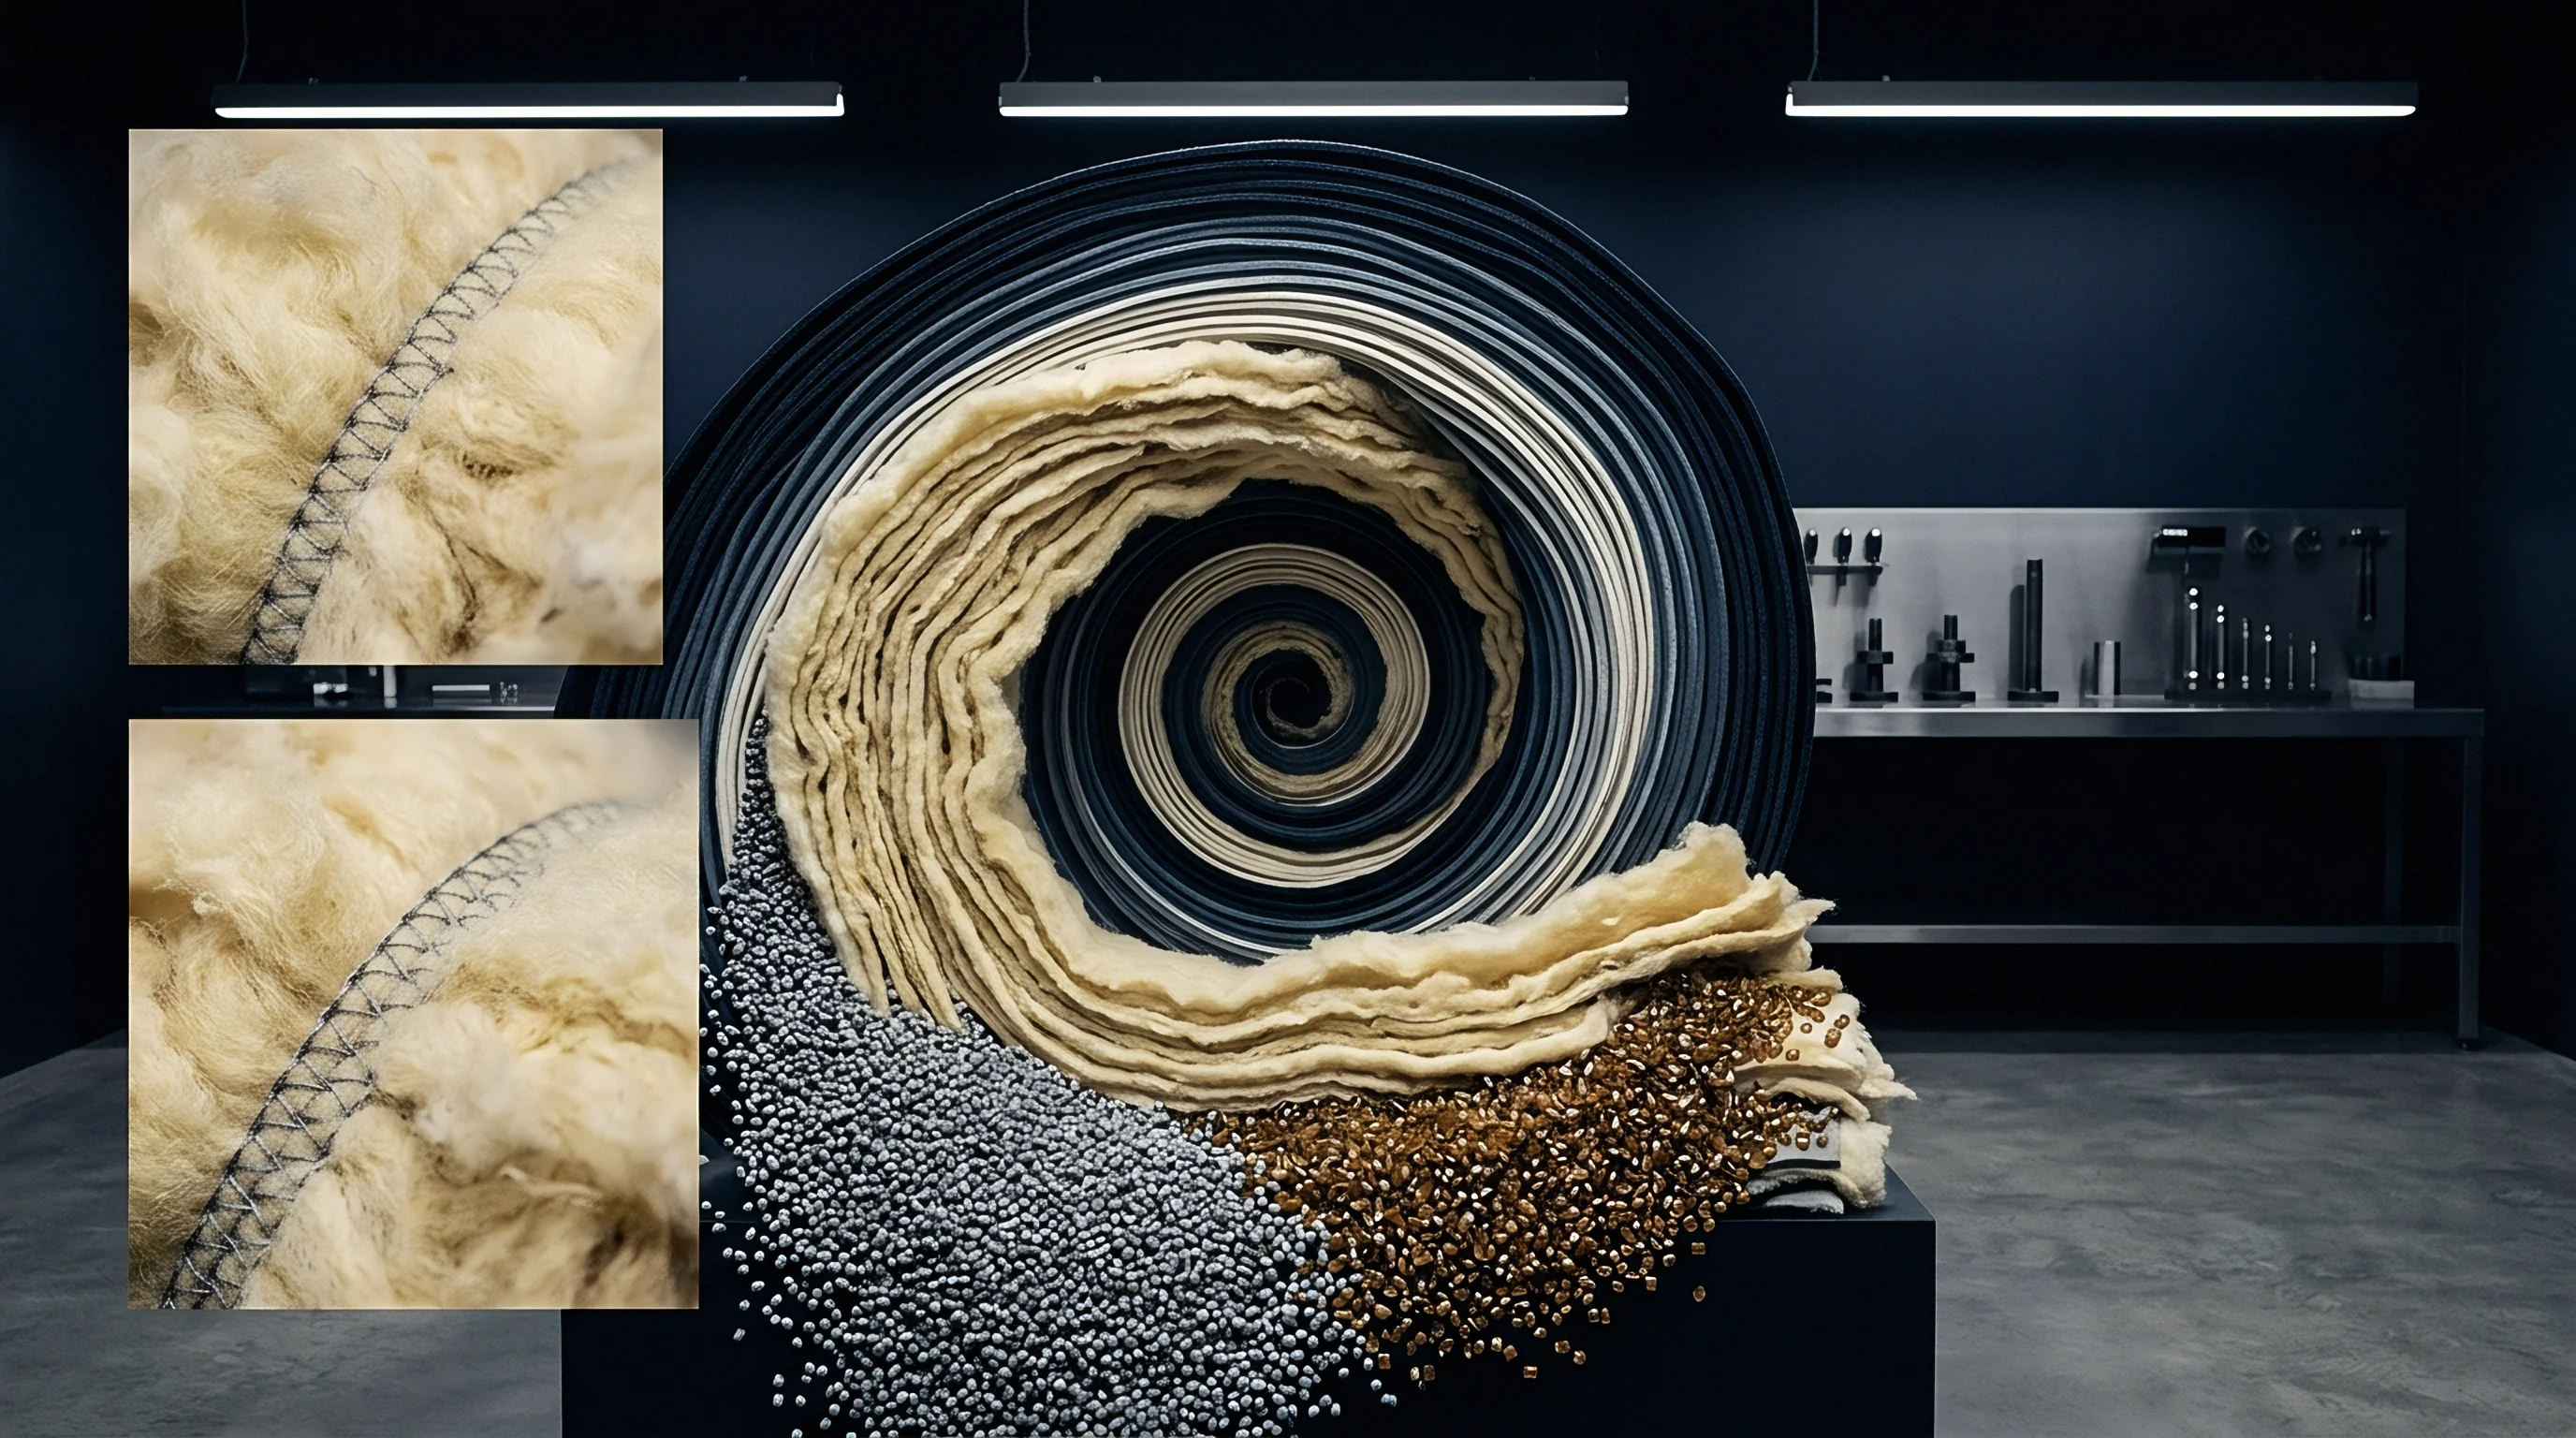
Pneumatic distribution chutes convert fast duct transport into slow, dense fiber batts. As the duct widens into the upper hopper, air speed drops sharply from twenty meters per second to under two meters per second. This rapid deceleration causes immediate boundary layer separation along the expanding hopper walls.
Fibers with lower terminal velocities stay airborne longer, drifting toward static exhaust screens, while heavier fibers fall straight into the main compaction zone.
In high-speed chute feeds, differential settling transforms a homogeneous sixty-five percent polyester and thirty-five percent cotton bale-room blend into a stratified fiber column. Fine polyester collects near the top of the reserve chute, while coarse, dense cotton concentrates in the center of the batt. This spatial separation produces cyclic waves in the blend ratio along the card sliver, leading to severe periodic yarn count variation downstream.
Terminal Velocity Disparity across Density and Crimp Profiles
Free-fall velocity in a low-turbulence air column determines how quickly fibers separate once kinetic transport energy dissipates. A fiber falling through air reaches terminal velocity when gravity balances aerodynamic drag. For flexible, non-spherical fibers, crimp amplitude increases the effective surface area, adding drag and slowing the drop rate.
Table 1 outlines the measured aerodynamic parameters and calculated terminal velocities for representative binary staple pairings under standard laboratory conditions.
| Fiber Polymer & Morphology | Linear Density (dtex) | Cut Length (mm) | Polymer Density (g/cm³) | Crimp Index (%) | Drag Coefficient (Cd) | Terminal Velocity (m/s) |
|---|---|---|---|---|---|---|
| Polyester Semi-Dull Round | 1.30 | 38.0 | 1.38 | 12.5 | 1.12 | 0.82 |
| Combed Upland Cotton | 1.55 | 28.5 | 1.54 | 18.0 | 1.68 | 1.24 |
| Viscose Bright Circular | 1.70 | 38.0 | 1.52 | 4.0 | 0.98 | 1.08 |
| Nylon 6,6 Round | 1.40 | 44.0 | 1.14 | 14.0 | 1.25 | 0.74 |
| Recycled PET Crimp-Heavy | 1.65 | 38.0 | 1.38 | 22.0 | 1.85 | 0.68 |
| Para-Aramid High Modulus | 1.70 | 50.0 | 1.44 | 6.0 | 1.05 | 1.15 |
Calculating the gap in terminal velocity explains why certain fiber pairs separate so quickly in low-velocity hoppers. A difference greater than zero point three meters per second causes phase separation within forty-five seconds inside an active pneumatic reserve chamber.
Air drag separates unequal fibers during pneumatic conveyance long before mechanical carding elements make physical contact with the blend.
If aerodynamic drift goes uncorrected in the ductwork, the fiber batt enters the carding machine with severe cross-sectional variation. The carding cylinder then works on an uneven mix across its width, leaving areas high in synthetics right next to areas dominated by natural fibers. Subsequent drawing cannot fully remove lateral blend separation formed at the chute feed, resulting in streakiness in dyed woven fabrics, erratic pilling, and unexpected strength variation across the finished yarn.

Friction
Inter-fiber contact mechanics dictate whether staple assemblies hold together or slide past each other during processing. When two polymer types mingle in a carding web or drafting zone, their boundary shear strength determines if they move cohesively or split into separate single-fiber clusters. Polymeric friction does not follow classical Amontons-Coulomb laws where force is directly proportional to normal load.
Instead, staple fibers exhibit non-linear friction driven by viscoelastic deformation and surface energy, causing the friction coefficient to drop as normal loading increases.

Polymeric Surface Energy and Non-Coulomb Boundary Dynamics
Contact points between flexible fibers form micro-scale boundary junctions. Real contact area is only a fraction of apparent contact area, depending on fiber diameter, elastic modulus, and surface roughness. Polyethylene terephthalate fibers have a surface energy of thirty-nine millinodes per meter, while untreated cotton surfaces sit near forty-four millinodes per meter because of exposed hydroxyl groups.
This difference drives variations in adhesion when fibers rub against each other or steel machine parts.
The relationship between normal force and frictional resistance in synthetic staples follows a power-law equation, where friction force equals a scaling constant times normal force raised to an exponent under one. For smooth synthetics, this exponent typically ranges from zero point seven zero to zero point eight five. As drafting rolls squeeze the fiber web, synthetic-to-synthetic contacts lose friction coefficient while natural-to-natural contacts retain higher shear resistance.
This friction mismatch lets smooth synthetics slip forward out of the drafting zone faster than natural fibers, causing localized separation known as drafting wave segregation.
Spin Finish Extraction and Dynamic Coefficient Variance
Synthetic fiber makers apply liquid surface finishes containing lubricants, antistatic agents, and emulsifiers to control friction at high spinning speeds. Total extractable finish, measured as a weight percentage of dry fiber, sets the balance between static and dynamic friction coefficients. Dropping below zero point ten percent by weight causes high static friction and severe charge buildup.
Exceeding zero point forty-five percent by weight causes liquid bridging between fibers, generating heavy hydrodynamic drag at high drafting speeds.
Finish components migrate between fiber surfaces during mechanical blending. When dry, absorbent cotton touches wet, finish-coated synthetic fibers in the blowroom, the cotton draws in liquid finish components through capillary action. This uncontrolled lubricant transfer alters the engineered friction coefficients of both fibers.
Synthetic fibers lose their protective lubricant layer, raising static friction, while cotton acquires an uneven coating that reduces cohesive shear strength.

Triboelectric Charge Accumulation in High-Speed Conduit Dynamics
Contact electrification occurs whenever dissimilar dielectric materials touch and separate inside high-speed pneumatic conduits. The triboelectric series governs the polarity and magnitude of the charge exchanged. Nylon acquires a positive charge when colliding with aluminum ducting, whereas polyester takes on a negative charge under the same impact conditions.
Cotton sits near the middle of the triboelectric scale, picking up a slight positive charge in dry environments.
Electrostatic charges create localized attractive and repulsive forces between entrained fibers. Like-charged synthetic fibers repel one another, spreading toward grounded duct walls, while oppositely charged natural and synthetic fibers cling together in tight, unblendable clumps. Static charges aggravate mechanical drift.
When relative humidity drops below forty percent, electrostatic attraction binds fine synthetics to metallic duct walls; these stationary coatings periodically break free as massive, unblended slubs, corrupting sliver purity.
- Spin Finish Strip-Off occurs when excessive air velocity strips finish components from synthetic fibers, leaving raw polymer exposed to metal friction and triggering sudden spikes in dynamic boundary shear.
- Electrostatic Repulsive Segregation happens when identical synthetic filaments build up high net charges of the same polarity, driving them away from the main fiber core toward duct walls.
- Differential Boundary Stick-Slip develops when natural fibers exhibit sticky stick-slip behavior while smooth synthetic fibers maintain continuous slip, causing temporal separation under cyclic drafting tension.
- Compressive Finish Migration arises when heavy nip roll loads force liquid finish out of synthetic fiber pores onto adjacent natural fibers, destabilizing friction throughout the sliver matrix.
Managing surface interactions requires continuous monitoring of spin finish stability and ambient conditions. Synthetic fibers supplied with inconsistent finish coverage show erratic friction changes across varying humidity levels. If finish formulations lack durable antistatic agents, static charges build up rapidly at air speeds above fifteen meters per second.
Spin finish chemistry dictates inter-fiber shear strength and prevents electrostatic segregation during high-speed drafting.
Blend segregation attributed to raw material variance often stems instead from improper finish selection or finish stripping during pneumatic transport. Staple length variation is frequently cited when the real issue is unmanaged surface lubrication and electrostatics. Adjusting machine settings without dealing with surface tribology will not solve blend segregation.
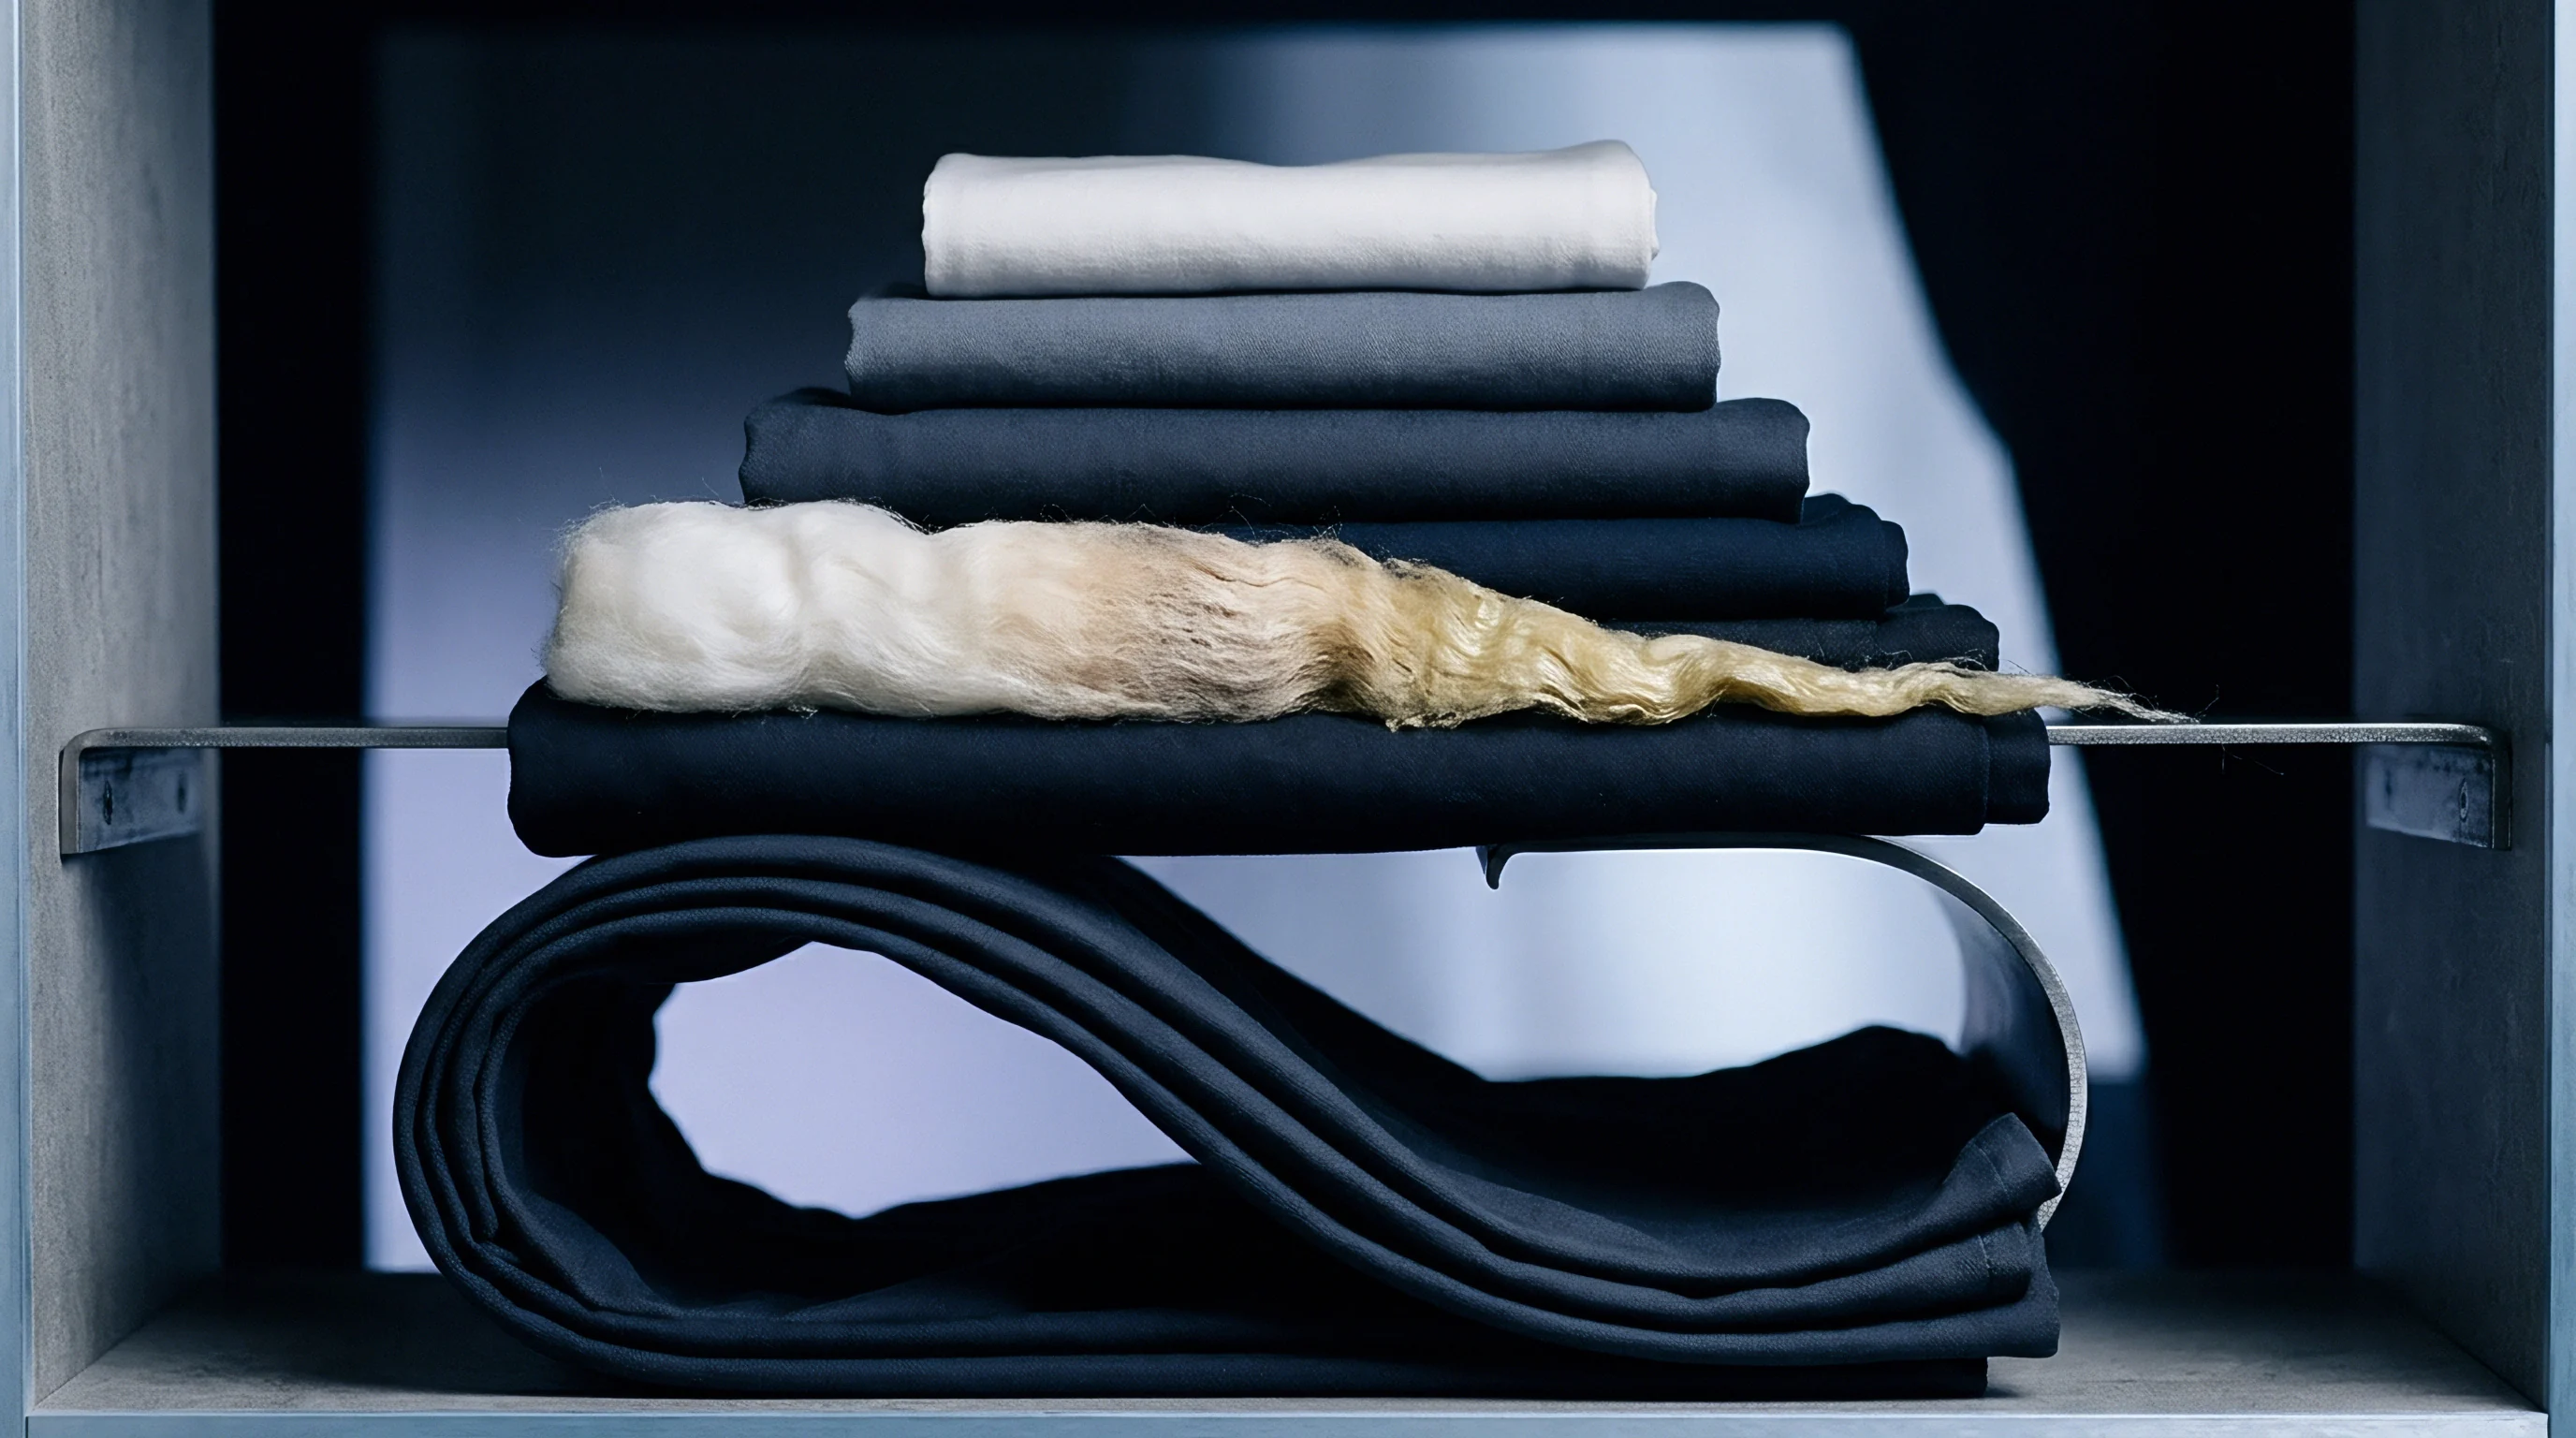

Computation
Simulating coupled fluid dynamics and discrete particle mechanics offers a predictive framework to prevent phase segregation. Numerical modeling of binary staple mixtures requires resolving turbulent velocity fields while tracking the translation, rotation, deformation, and contact tribology of thousands of flexible fibers. Eulerian-Lagrangian multi-physics solvers combine Computational Fluid Dynamics with the Discrete Element Method to calculate fiber trajectories within complex processing geometries.
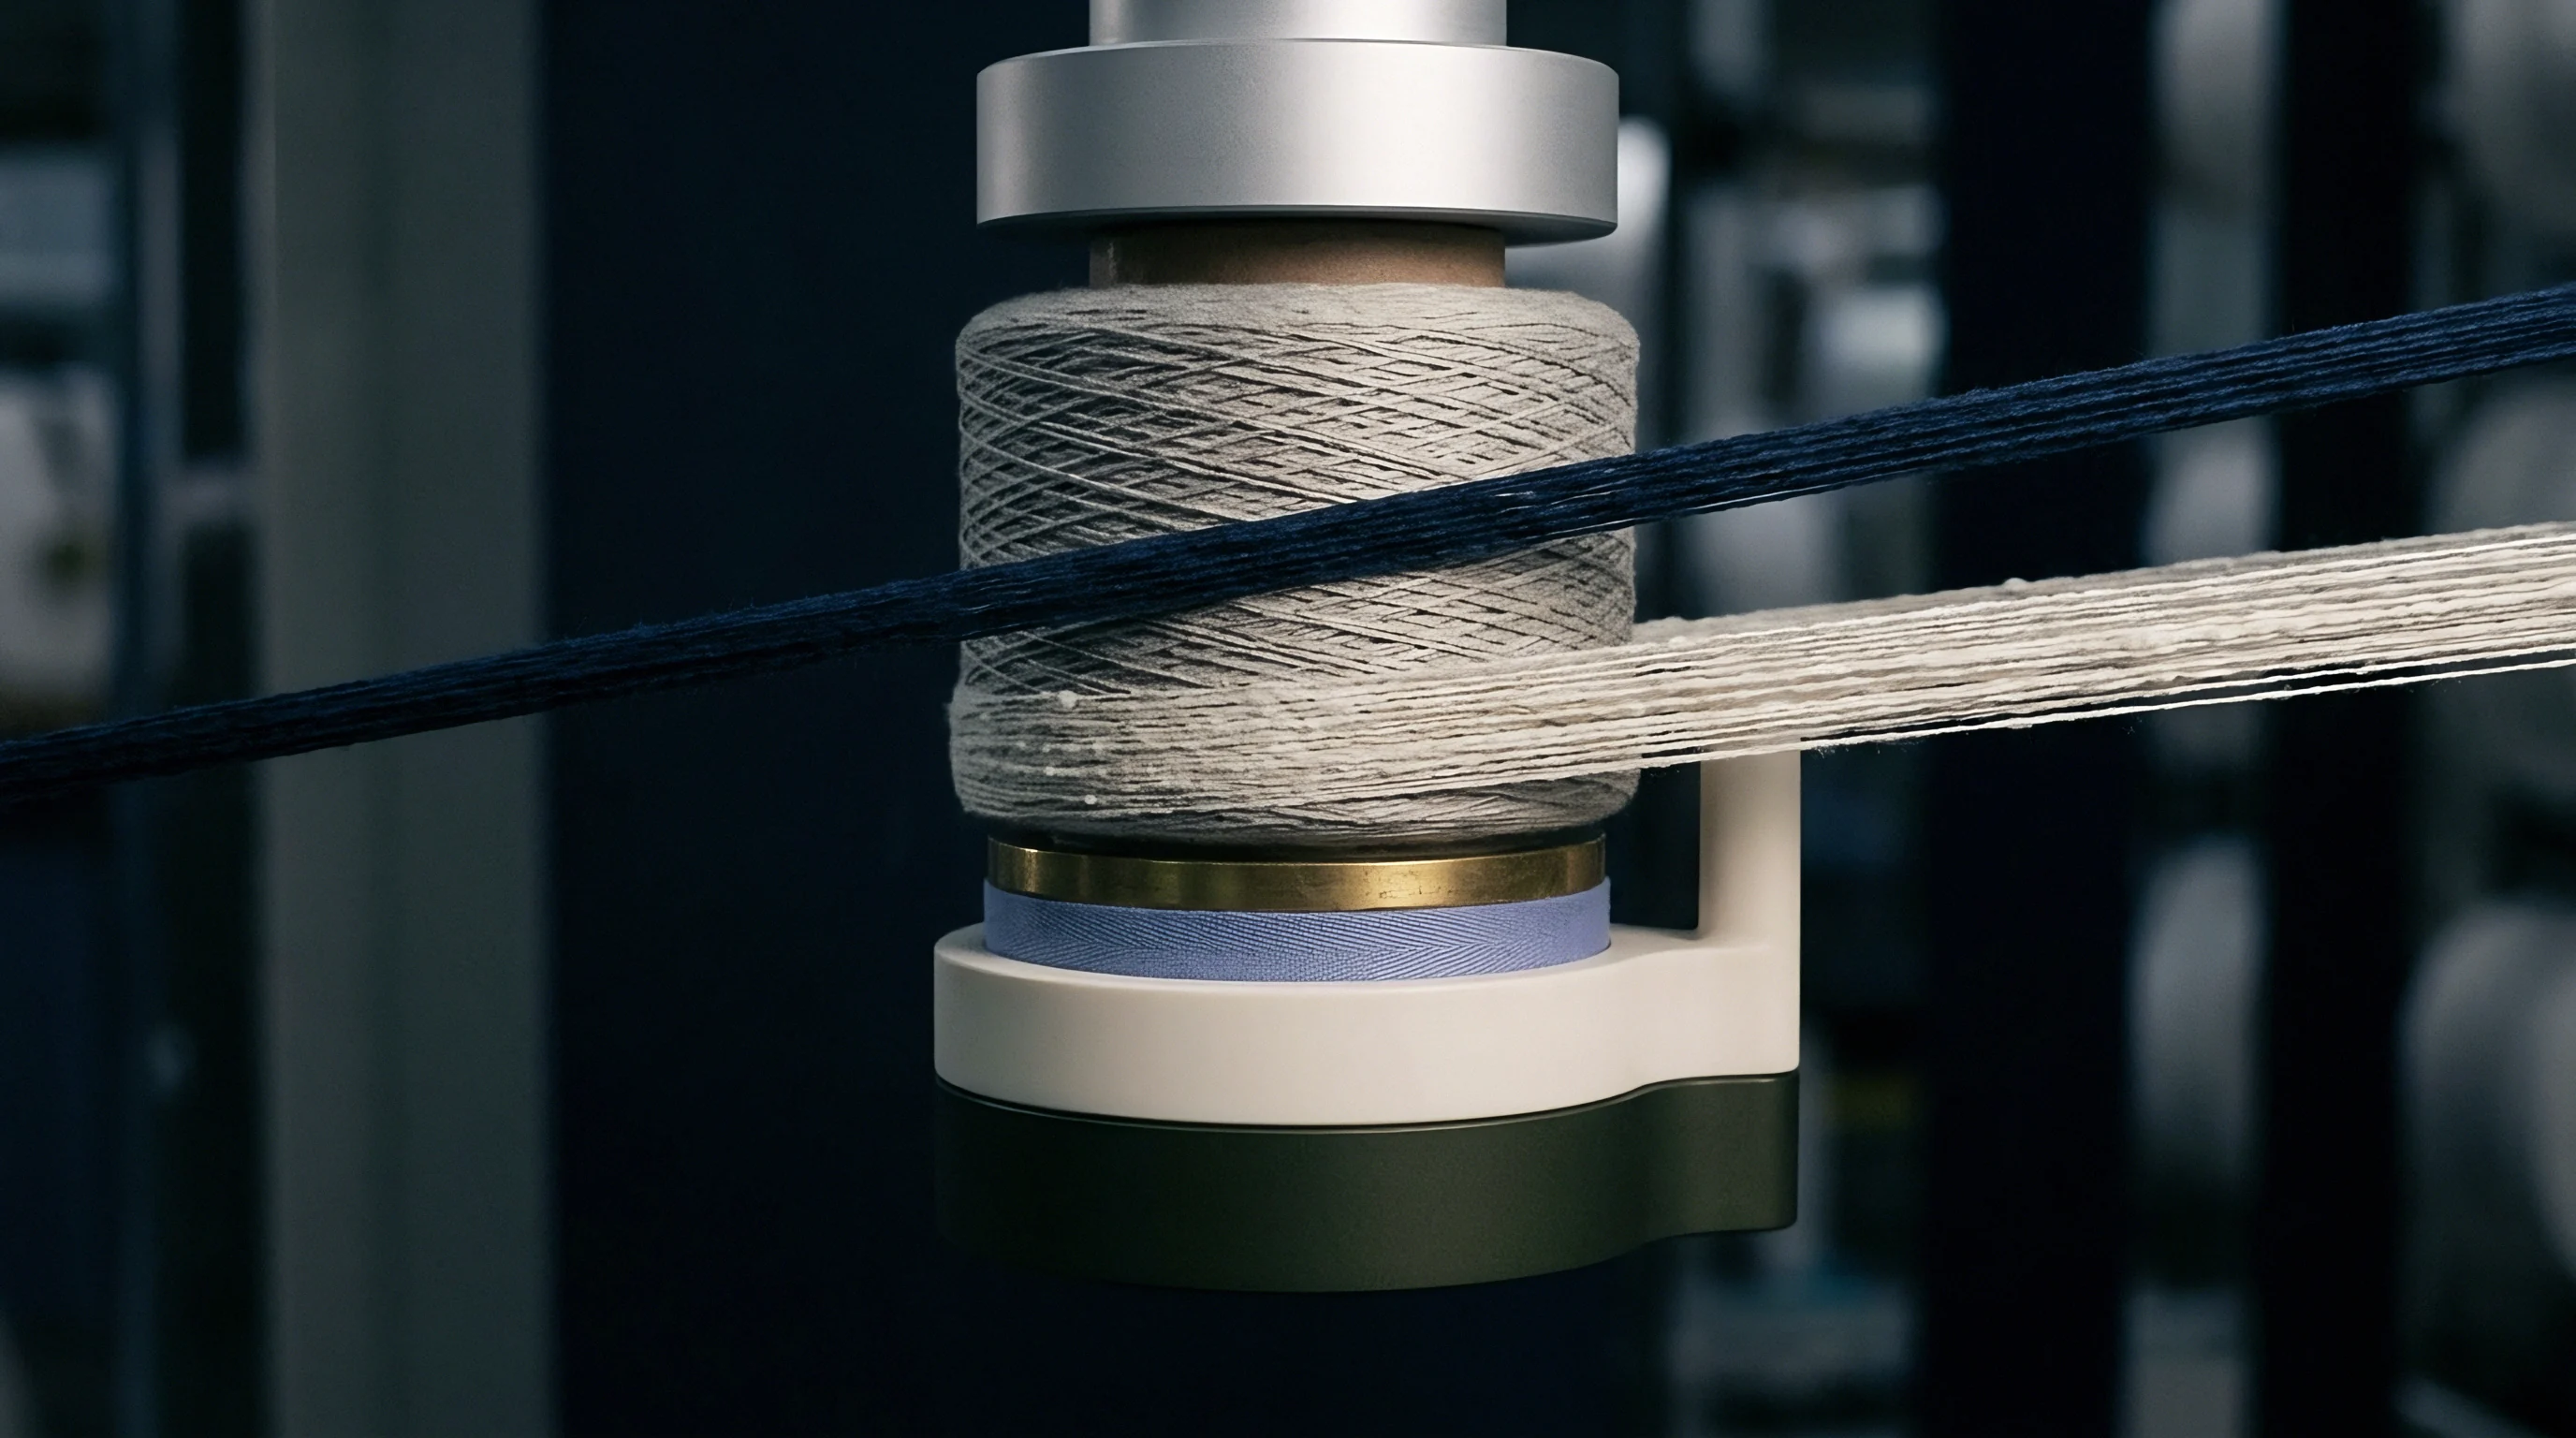
Eulerian-Lagrangian Multi-Physics Governing Equations
Airflow modeling treats the gas phase as a continuous medium using the Navier-Stokes equations supplemented by shear stress transport turbulence models. Fluid dynamics dictate local pressure fields, kinetic energy dissipation, and velocity vector profiles in pneumatic ducts and chute hoppers. Mass and momentum balance equations for the incompressible fluid phase include a momentum exchange term accounting for two-way drag between suspended fibers and the air stream.
Particle modeling tracks every staple fiber as a discrete body moving through the fluid grid. Segment translation obeys Newton’s second law, where mass times acceleration equals the sum of gravity, aerodynamic drag, pressure gradient, electrostatic, and inter-fiber contact forces. Dynamic drag equations apply non-spherical correction functions that adjust drag based on local fiber orientation relative to the instantaneous air velocity vector.

Discrete Element Modeling of Flexible Staple Geometry
Representing flexible, crimped staples in a Discrete Element Method framework requires multi-sphere bonded models or multi-segment sphero-cylinder chains. A single staple fiber is built as a chain of spherical elements joined by internal beam bonds that resist tension, bending moments, and torsion. This allows the virtual fiber to buckle, flex, and recover its crimp shape under hydrodynamic shear or mechanical compression.
Contact mechanics between virtual fibers use the Johnson-Kendall-Roberts adhesive contact model with Coulomb friction limits. When two fiber segments touch, normal repulsion is calculated from polymer elastic modulus and surface energy adhesion, while tangential calculations track micro-slip friction hysteresis. Electrostatic interactions are calculated using Coulomb’s law for point charges assigned to fiber nodes, updated at every timestep based on friction history and local humidity.

Segregation Index Formulation for Binary Fiber Mixtures
Quantifying segregation severity in a multi-physics simulation requires a metric that measures local composition variance against the nominal blend ratio. The segregation index evaluates spatial distribution by dividing the simulation domain into discrete sampling volumes. Table 2 details the mathematical formulations, physical parameters, and critical simulation thresholds used in predictive binary models.
| Parameter / Metric | Mathematical Symbol | Physical Unit | Governing Equation / Basis | Critical Segregation Threshold |
|---|---|---|---|---|
| Fluid Phase Turbulence | Re_d | Dimensionless | Navier-Stokes SST k-omega | Re > 45,000 (Duct Turbulence) |
| Particle Drag Coefficient | C_d | Dimensionless | Haider-Levenspiel non-spherical model | Delta C_d > 0.45 between species |
| Fiber Bending Rigidity | E_b | N·mm² | Euler-Bernoulli beam bond friction | Ratio > 2.5 between component polymers |
| Inter-Fiber Cohesion | Gamma | mJ/m² | JKR Surface Energy Adhesion | Delta Gamma > 12 mJ/m² |
| Electrostatic Charge Density | q_s | nC/g | Triboelectric contact model | |
| Binary Segregation Index | I_s | Dimensionless | Variance ratio to random mixture | I_s > 0.08 indicates severe segregation |
Calculating the segregation index across domain cross-sections highlights specific duct elbows, diffuser angles, and chute exhaust ports where phase decoupling begins. When the segregation index exceeds zero point zero eight, the model predicts visible blend drift in the physical card sliver.
CFD-DEM simulations predict local segregation hotspots in pneumatic ducting before physical carding machinery is commissioned.
Integrating these complex mathematical models into real-time production monitoring systems runs into computational limits because of the time required to track thousands of flexible multi-node fibers. Simulating one second of processing in a high-speed carding chute currently takes several days on high-performance computing clusters. How can mathematical models simplify flexible fiber physics to run real-time predictive control algorithms without losing accuracy in segregation prediction?
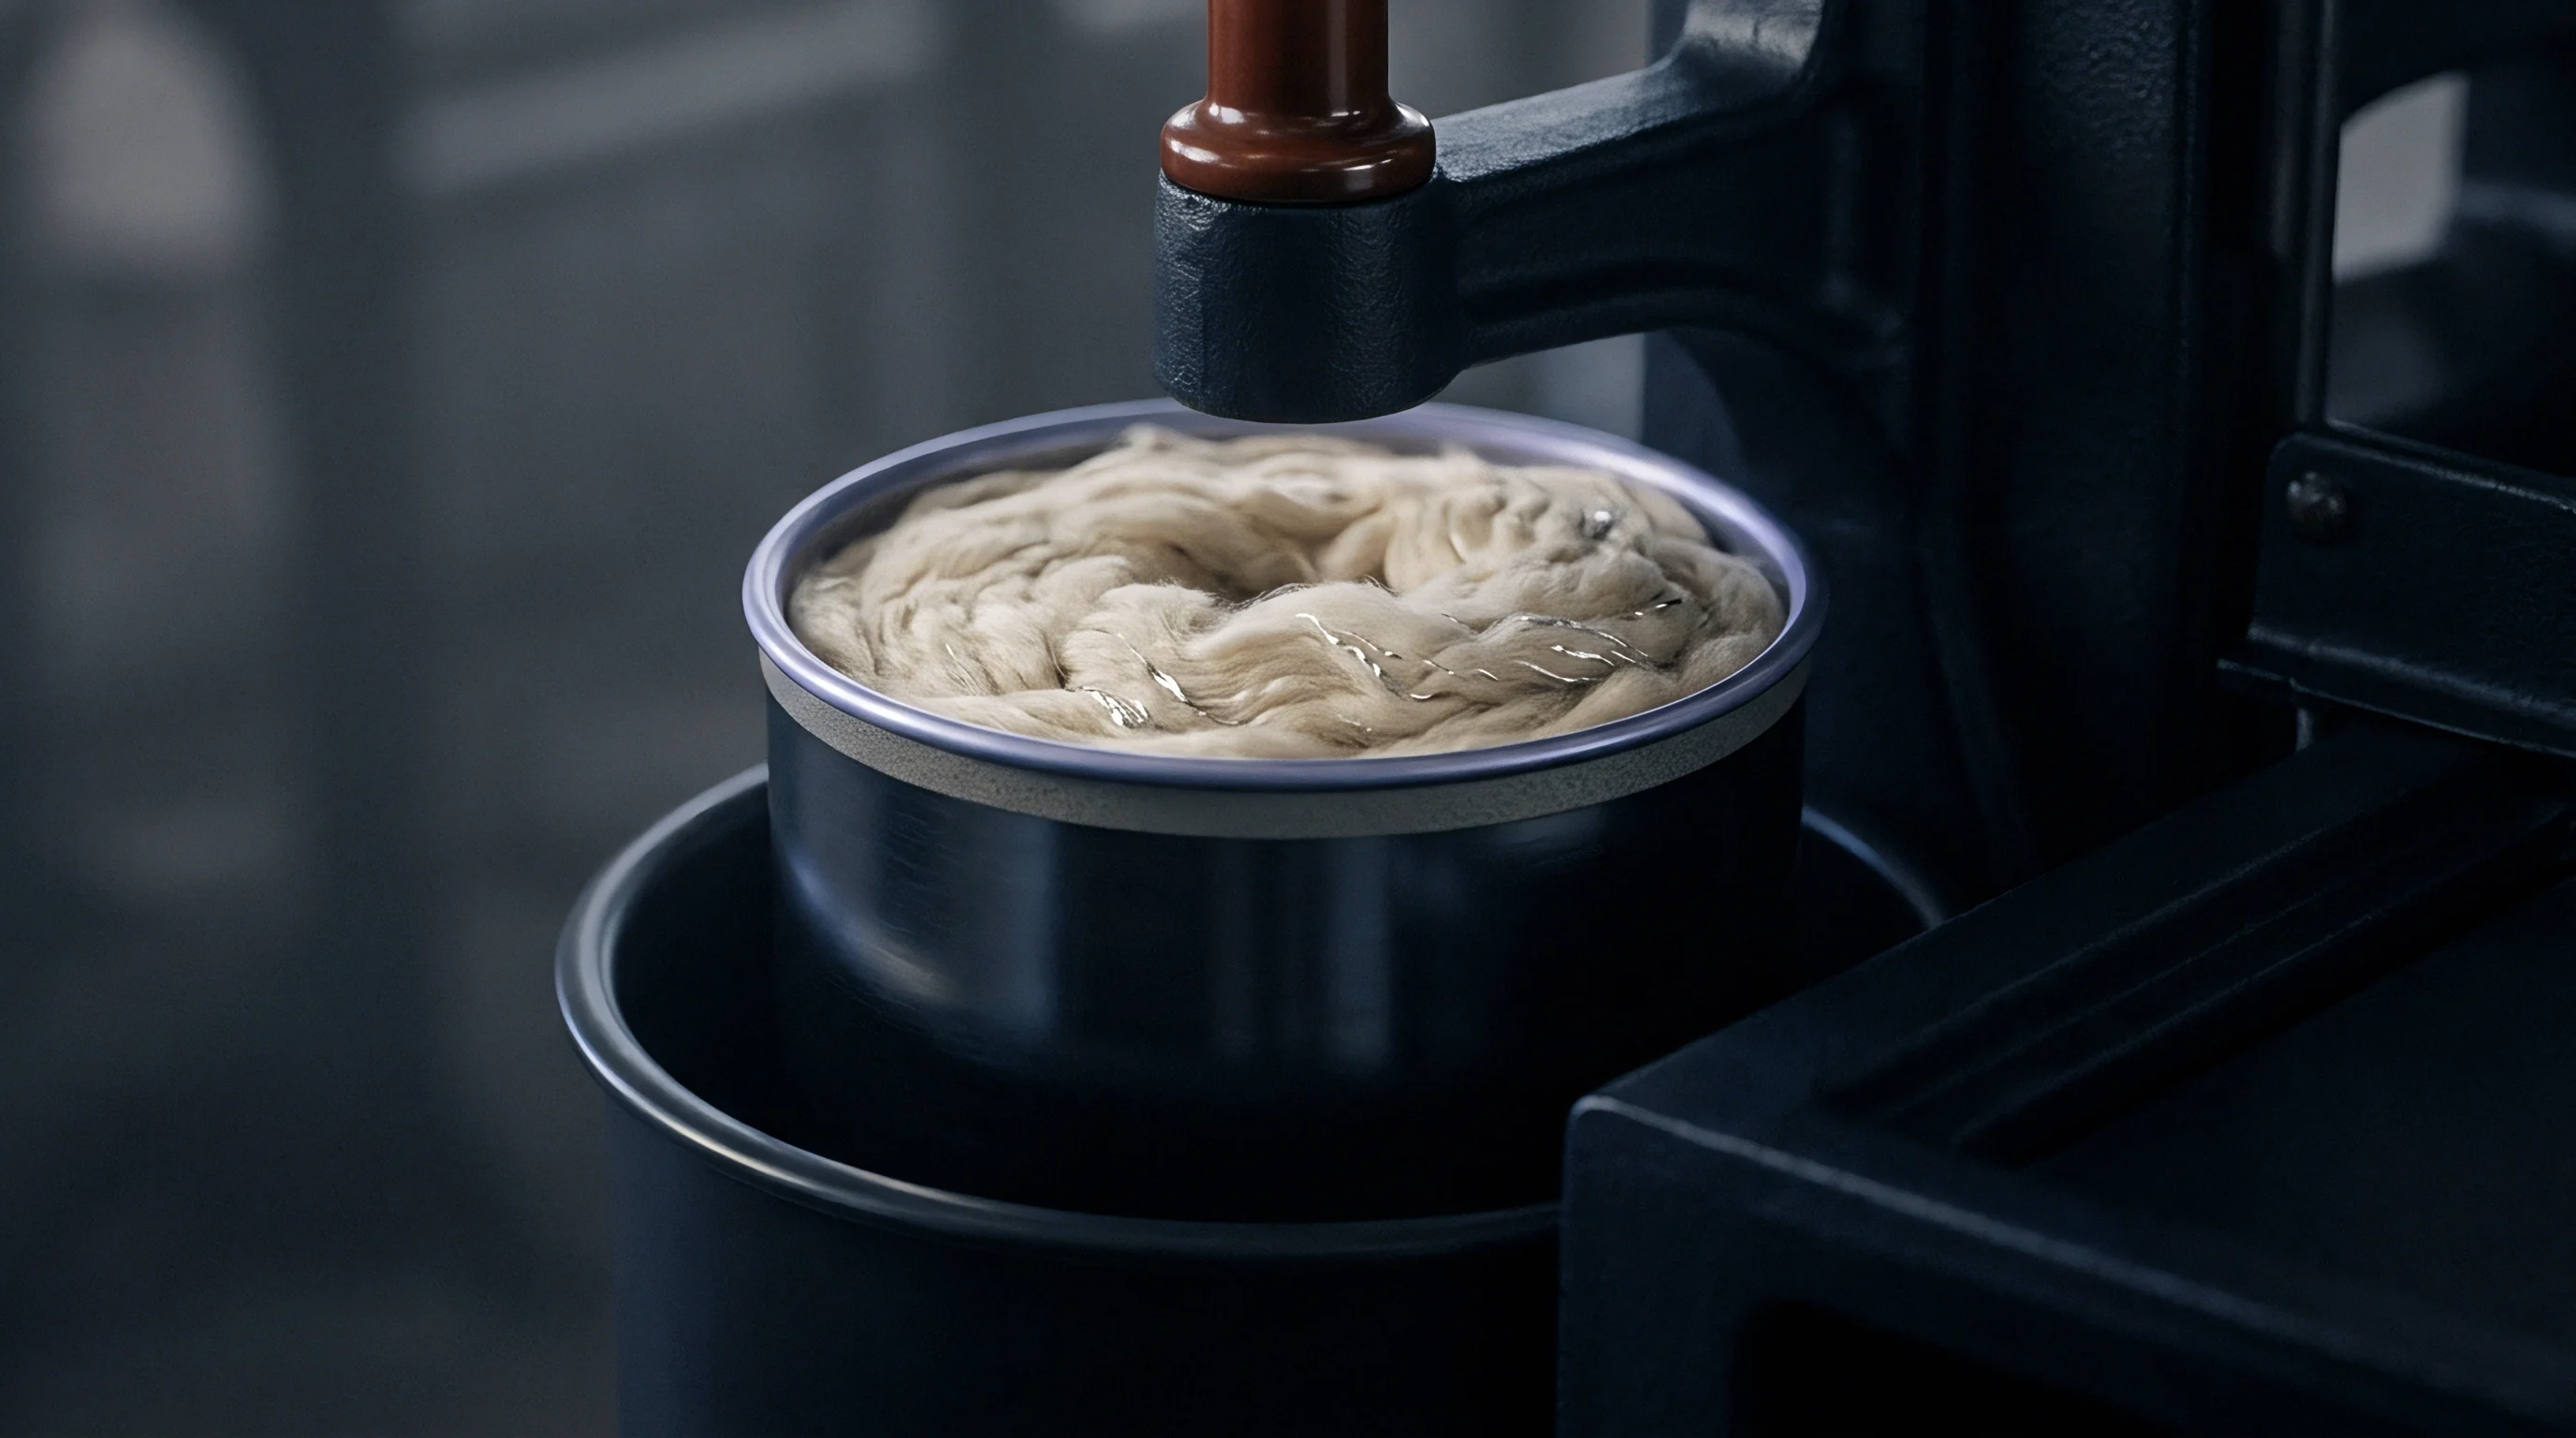

Carding
Preventing phase segregation in industrial yarn manufacturing means translating simulation insights into mechanical and environmental control protocols. High-speed carding lines are the final stage where fiber orientation, blend homogeneity, and web density are set before drawing. Optimizing pneumatic pressure, wire clothing geometry, and ambient conditions eliminates phase separation across the card width and stops longitudinal blend drift.
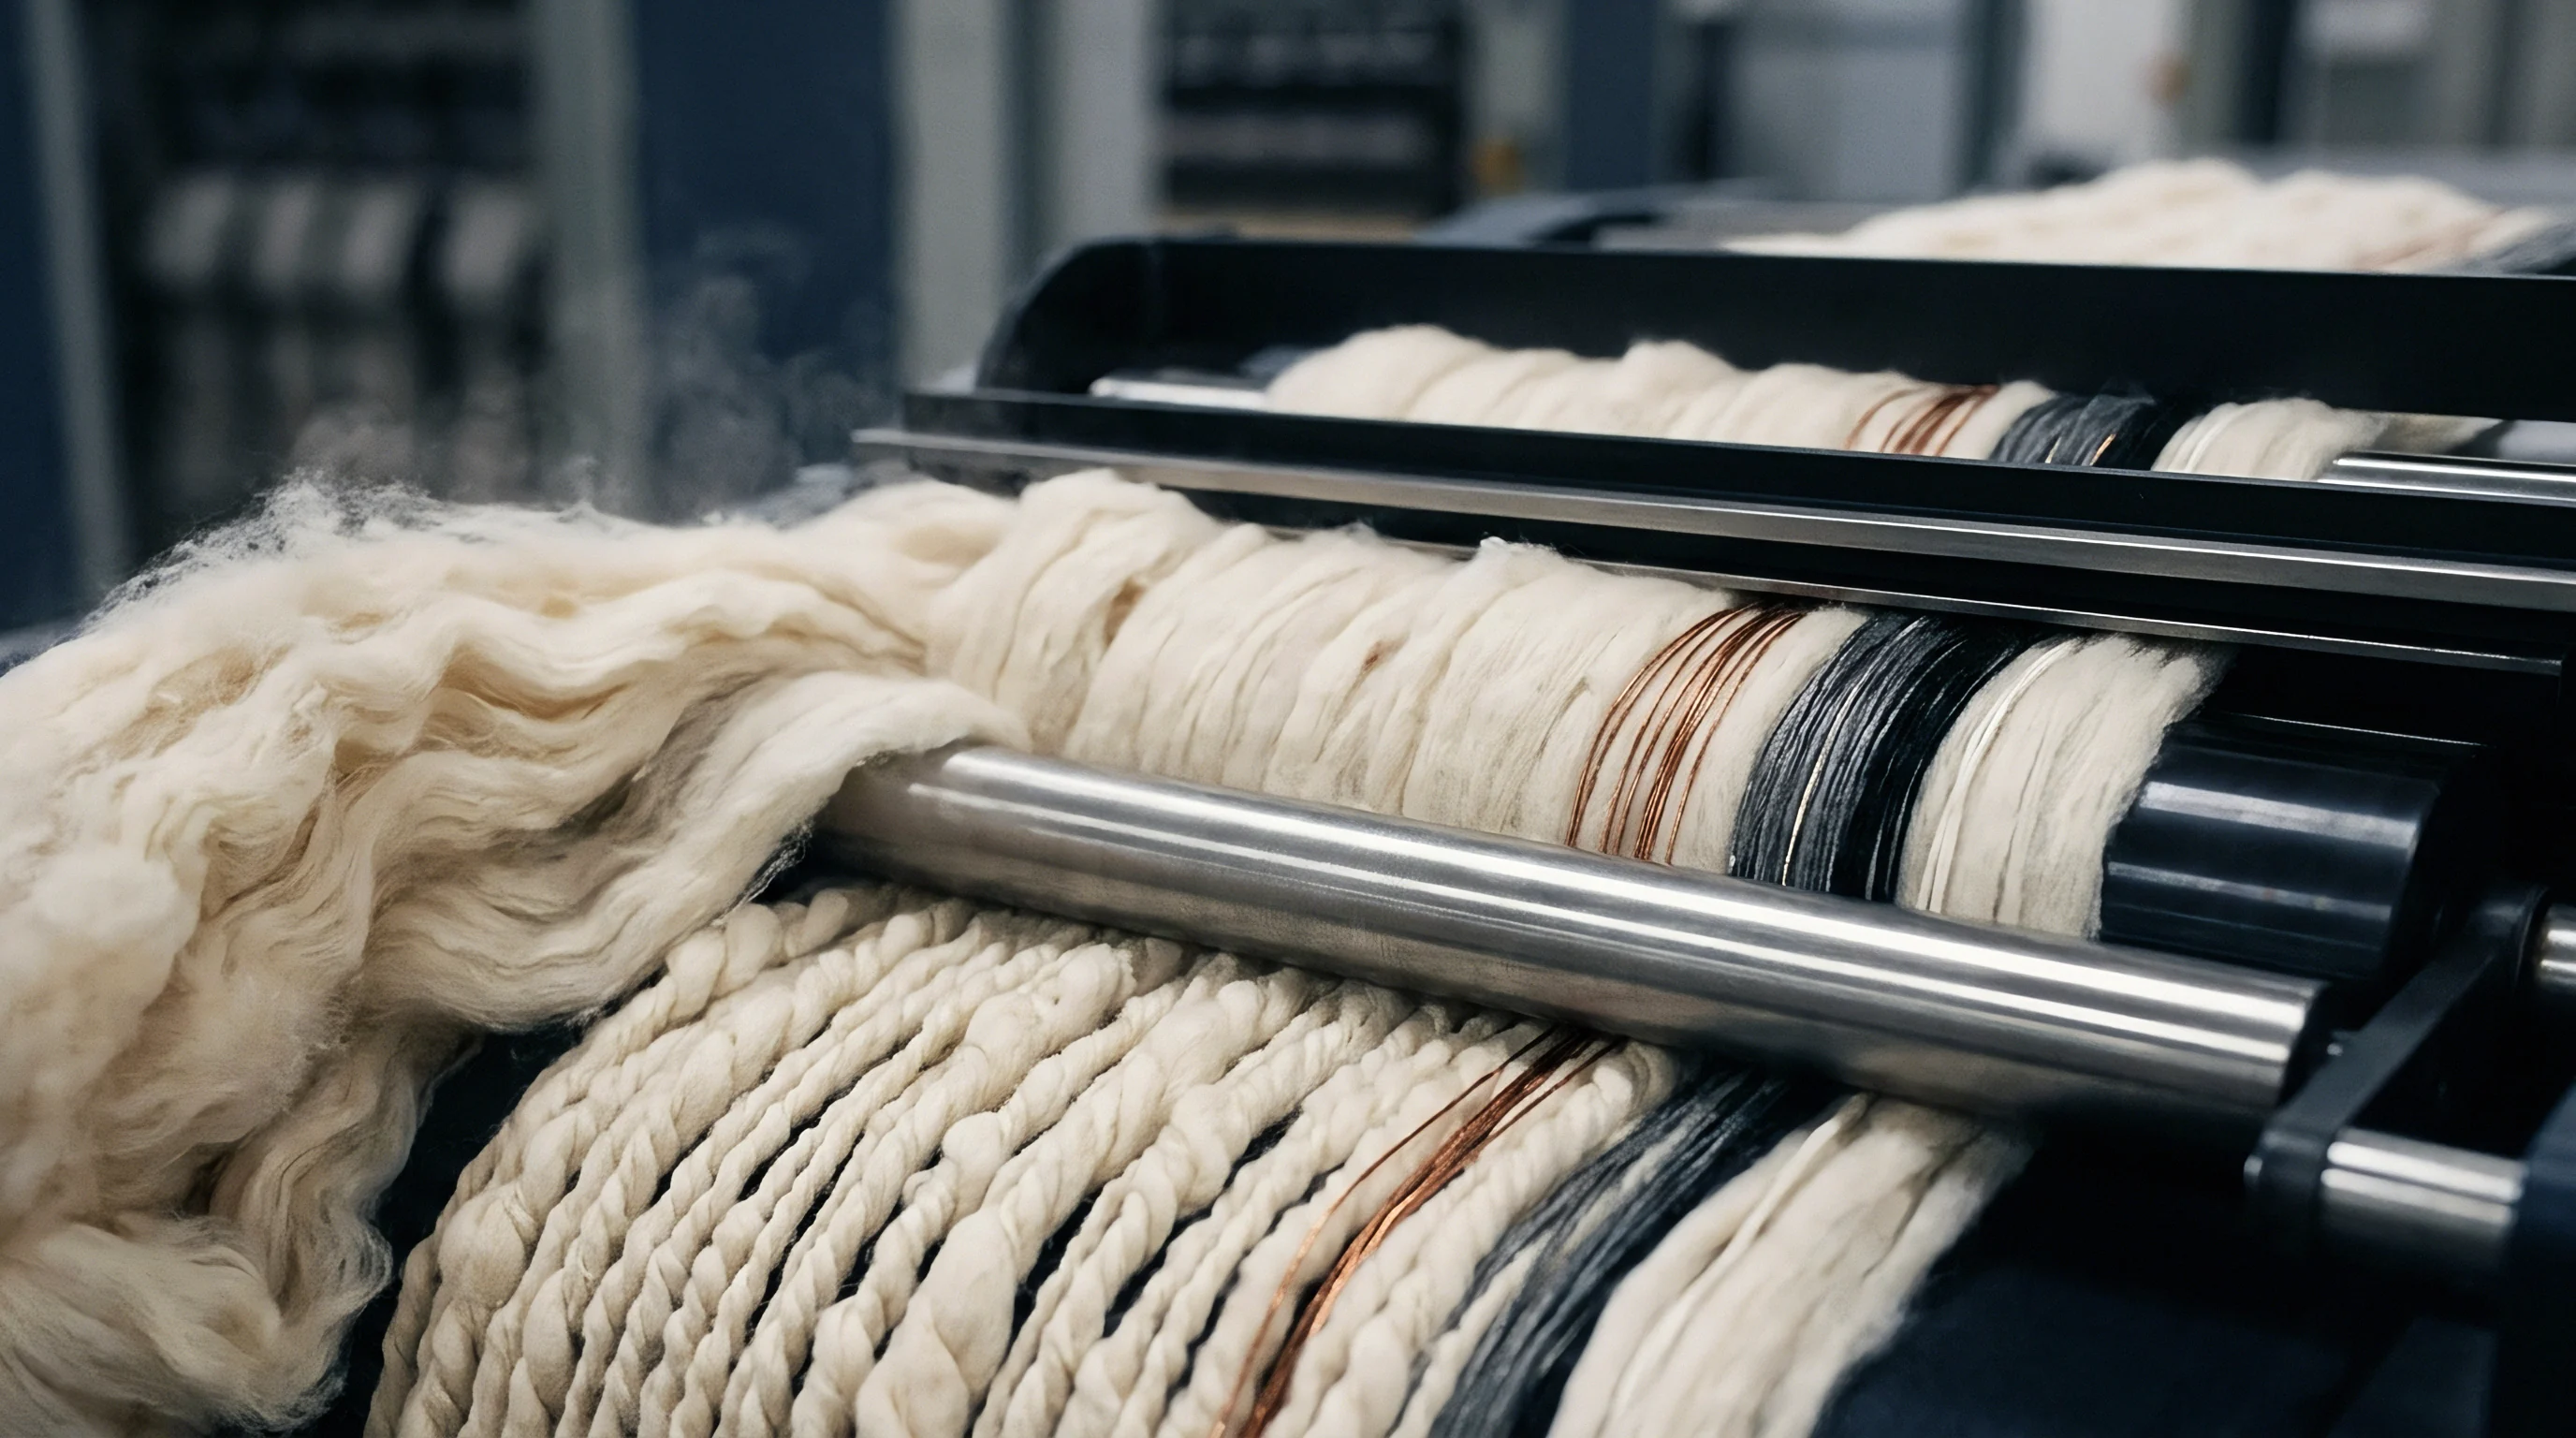
Pneumatic Chute Balance and Exhaust Flow Optimization
Modern card chute feeds use continuous over-pressure or controlled intermittent air evacuation to form a dense fiber batt. Getting a uniform blend requires balancing exhaust air volume with the incoming feed rate. If fan speed is too high, lightweight synthetics are pulled hard against static filter screens, forming dense mats that resist compaction while heavier natural fibers drop to the bottom of the reserve trunk.
Differential pressure sensors across the lower hopper allow real-time regulation of air bleed valves. Keeping hopper static air pressure between eighty and one hundred twenty Pascals creates a gentle air cushion that slows the descent of dense fibers while preventing light fibers from drifting toward exhaust ports. Below eighty Pascals, lighter synthetic filaments float.
Maintaining precise pressure equilibrium eliminates density-driven separation in the chute column.

What Reynolds Number Triggers Segregation in Ducting?
Air velocity in transport ducting must stay within a narrow window to avoid fiber settling and severe aerodynamic segregation. Running at a duct Reynolds number above forty-five thousand generates intense turbulent eddies that throw light fibers outward against pipe walls, triggering phase decoupling. Reducing transport air speed from twenty-two meters per second to sixteen meters per second lowers turbulence below critical thresholds while keeping enough momentum to move high-dtex natural fibers without clogging.
Duct design plays an equally vital role in preserving blend distribution. Bends and elbows require a minimum radius-to-diameter ratio of three point five to minimize centrifugal separation forces on dense fibers. Expanding transitions must keep an inclusion angle under seven degrees to prevent boundary layer separation and reverse flow eddies.
Preventing flow separation maintains uniform particle suspension throughout the duct network.

Mechanical Wire Selection and Drafting Zone Pressure Maps
Carding cylinder wire angle, point density, and flat settings govern how binary fiber mixtures are combed and blended at the micro-scale. When processing a mix of fine synthetics and coarse natural fibers, standard wire geometries perform differently on each component. Table 3 outlines optimized mechanical settings for carding machines processing binary blends.
- Reduce card chute transport air speed to sixteen meters per second to lower the duct Reynolds number and prevent turbulent phase separation.
- Adjust chute hopper static exhaust pressure to one hundred Pascals to maintain balanced settling velocities across both fiber species.
- Install cylinder clothing with a seventy-five degree front angle and a point density of eight hundred sixty points per square inch to ensure equal tooth engagement across fine and coarse fibers.
- Set cylinder-to-flat gauge clearance to zero point two zero millimeters to maximize inter-fiber combing while preventing selective fiber loading on flat clothing.
- Raise blowroom and carding room relative humidity to sixty percent at twenty-two degrees Celsius to dissipate static charges and stabilize boundary friction coefficients.
- Re-apply top-up spin finish emulsion at zero point fifteen weight percent active finish during bale opening to restore surface lubrication lost during pneumatic transport.
Controlling relative humidity within narrow limits remains the most effective defense against electrostatic segregation. Moisture alters surface conductivity: viscose absorbs water rapidly, raising its dielectric constant and discharging static within milliseconds, while polyester holds charge in dry air, generating surface potentials that stick fibers to metallic feed plates and draft rolls.
Operating blowroom and carding environments at sixty percent relative humidity prevents static charge accumulation and stabilizes dynamic fiber friction coefficients.
Technical specifications for high-speed spinning machinery include strict compliance clauses covering environmental control and pneumatic balancing tolerances. Equipment contracts often specify that delivered card sliver maintain a blend ratio coefficient of variation below one point two percent across twenty consecutive five-meter samples. Failing to meet this threshold shifts financial liability for off-spec sliver straight to the machinery vendor.


Assay
Verifying blend homogeneity requires analytical testing across raw materials, intermediate slivers, and finished yarns. Off-spec blend ratios alter fabric hand, cause dye shade variation, and trigger severe customs penalties when shipments fail composition audits. Quantitative chemical separation, optical microscopy, and gravimetric mass balance protocols form the technical dossier needed to prove compliance with international trade standards.

Quantitative Chemical Dissolution and Mass Balance Protocols
Standard laboratory methods for quantitative fiber analysis rely on selective chemical dissolution under ISO 1833 standards. For a binary mix of polyester and cotton, technicians use seventy-five percent concentration sulfuric acid at twenty degrees Celsius to dissolve the cotton while leaving the polyester intact. The remaining polyester residue is washed, dried in a vented oven at one hundred five degrees Celsius, and weighed to four decimal places on an analytical balance.
Chemical separation requires applying precise moisture regain correction factors to calculate true commercial mass. Scoured cotton carries a commercial moisture regain allowance of eight point five percent, compared to zero point four percent for polyester. Failing to adjust dry mass for standardized moisture regain creates a systematic error of about two point five percentage points in declared polyester content.

Cross-Sliver Variance Measurement and Statistical Tolerances
Detecting phase segregation in intermediate card and drawframe sliver requires regular sampling. Standard laboratory testing mandates taking ten one-meter sliver specimens across the card width and along the production run. Each specimen undergoes chemical dissolution to establish its component weight fraction, yielding a dataset evaluated for mean composition and coefficient of variation.
Commercial acceptance limits for blend variance differ between internal mill standards and regulatory trade declarations. International apparel labeling regulations permit a maximum composition tolerance of plus or minus three percent of declared fiber weight, whereas high-performance technical fabric contracts mandate a tight band of plus or minus one point zero percent. Table 4 shows the commercial and customs consequences of blend segregation across typical binary fiber import categories.
| Declared Fiber Blend & Ratio | Observed Segregation Range (%) | Analytical Method & Standard | Declared HS Tariff Code | Reclassified HS Tariff Code | Duty Impact & Tariff Exposure |
|---|---|---|---|---|---|
| 55% Polyester / 45% Cotton | 49.5% PET / 50.5% Cotton | ISO 1833-11 (Sulfuric Acid) | 5509.53 (Synthetic Yarn) | 5206.12 (Cotton Yarn) | Duty rises from 6.5% to 12.0% |
| 65% Polyester / 35% Viscose | 58.0% PET / 42.0% Viscose | ISO 1833-6 (Formic Acid/Zinc) | 5509.51 (Polyester Blend) | 5509.51 (No Chapter Shift) | Shade variance, zero tariff penalty |
| 50% Nylon 6,6 / 50% Wool | 44.0% Nylon / 56.0% Wool | ISO 1833-4 (Formic Acid) | 5509.80 (Synthetic Fiber) | 5107.10 (Combed Wool) | Duty rises from 8.0% to 14.5% |
| 85% Polyester / 15% Para-Aramid | 88.5% PET / 11.5% Aramid | ISO 1833-1 (Solvent Density) | 5509.59 (Specialty Blend) | 5509.59 (No Chapter Shift) | Flame resistance failure, batch scrap |
Under World Customs Organization Harmonized System rules, classification of mixed fiber yarns turns on whichever material predominates by weight. If aerodynamic or tribological segregation shifts a declared fifty-two percent polyester and forty-eight percent cotton yarn down to forty-nine percent polyester at the draw frame, classification jumps from Chapter 55 synthetic yarns to Chapter 52 cotton yarns ~ doubling landed duty rates and risking seizure for misdeclaration.
Preventing these losses requires building complete laboratory audit dossiers for every production lot. A full qualification dossier contains raw material certifications, chute static pressure logs, relative humidity records, spin finish extractable reports, and chemical dissolution test results for every sliver package delivered to the spinning frame. Implementing predictive aerodynamic and tribological modeling upstream ensures that physical phase segregation never develops, protecting yarn mass uniformity and securing landed cost calculations.
A reliable rule of thumb for cross-border sourcing: any binary staple blend operating within two percentage points of a major tariff classification boundary needs double the daily chemical dissolution sampling to catch segregation drift before goods reach the shipping container.