Quantitative Optical Identification of Fiber Composition in Mixed Textile Bales
Diffuse reflectance spectroscopy provides rapid non-destructive fiber identification in mixed bales when multivariate models correct for moisture and density.


Probe
Bale ties snap under forty kilonewtons of tension when the sampling crew cuts the wire strapping on incoming raw stock. The detector reads the signal. Uncompressed fiber expands instantly, exposing packed layers of post-industrial clippings, shredded garment waste, or virgin staple.
When whole truckloads arrive at the unbaling hall, mill managers cannot wait seventy-two hours for external wet chemical dissolution reports before feeding inventory into automated opening lines. Optical interrogation bridges that operational void, projecting near-infrared and visible radiation directly against the raw lot to establish fiber ratios within seconds of dock receiving.

Rapid Interrogation at the Receiving Dock
Incoming containers unload compressed bales under strict demurrage clocks. Bale ties snap under tension. Manual extraction of grab samples followed by solvent separation under ISO 1833 ties up working capital and delays production scheduling.
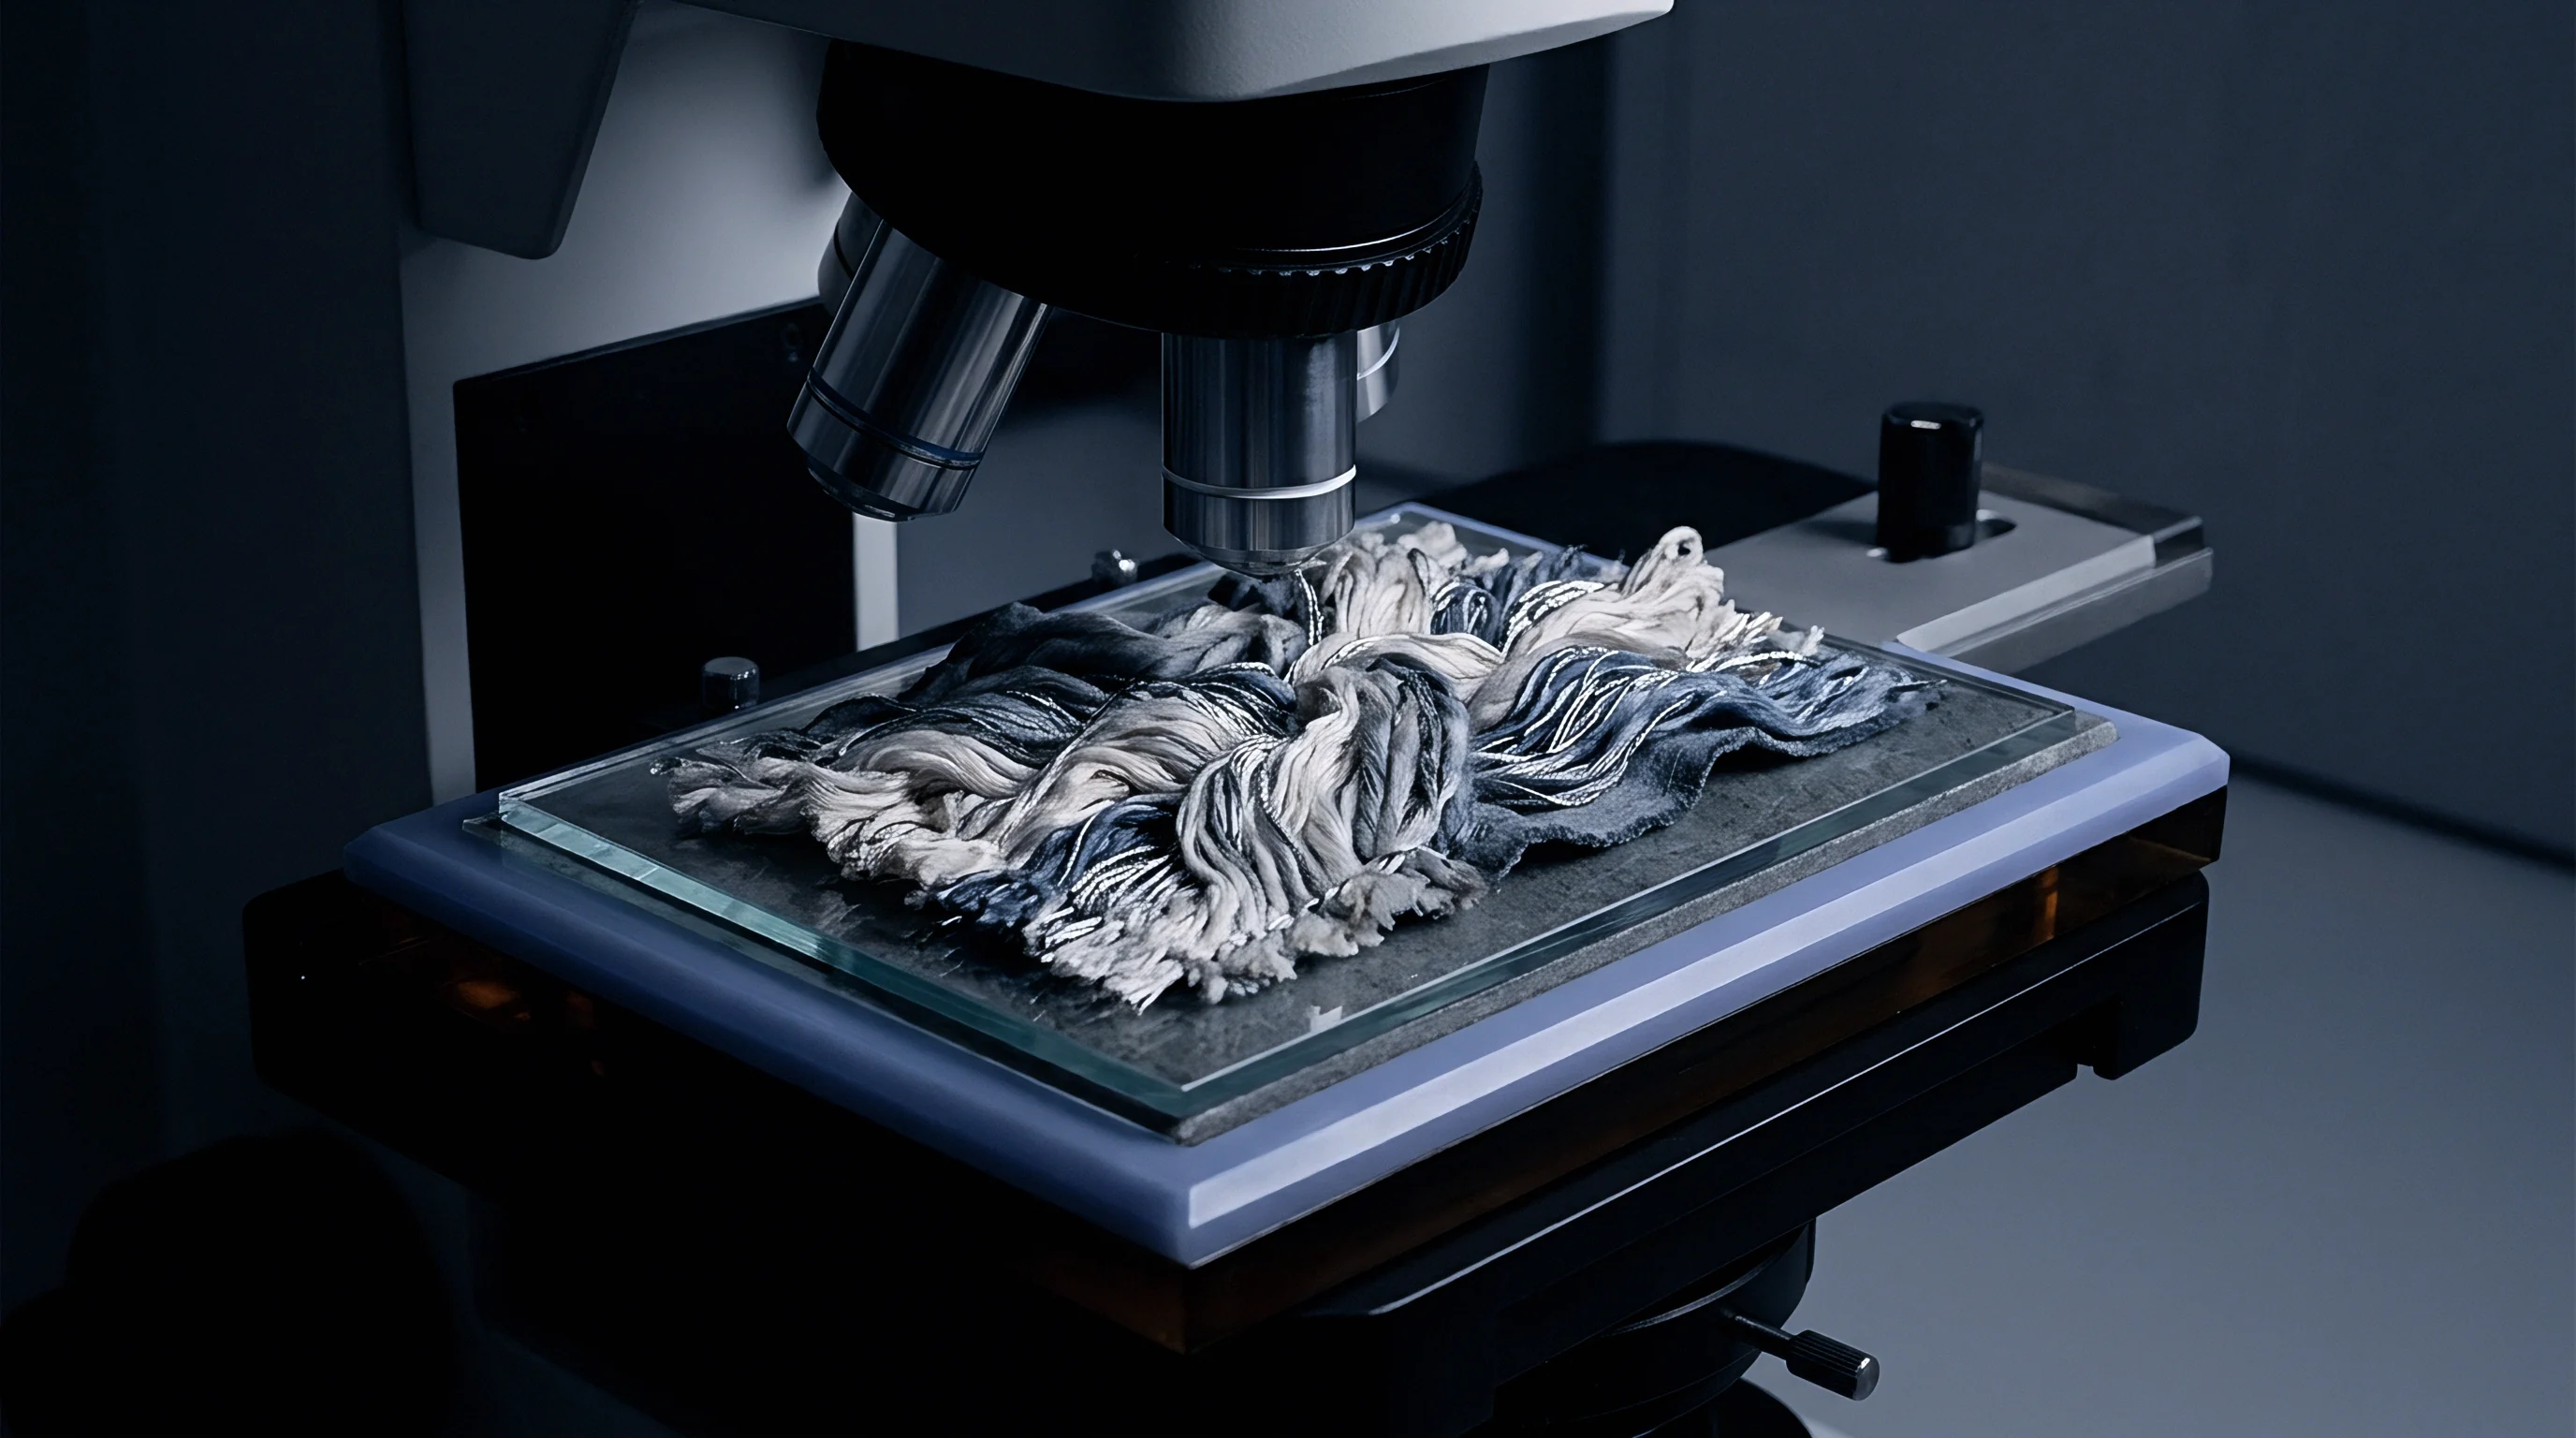
Optical spectroscopy uses diffuse reflectance, bouncing targeted light into the fibrous mass and capturing scattered photons through high-sensitivity indium gallium arsenide arrays. The resulting spectral curve captures fundamental molecular bonds, distinguishing polyester ester groups from cotton cellulosic backbones without destroying sample mass.
Direct optical testing avoids solvent digestion. Mill receiving areas deploy these optical tools directly at the bale plucker or across stationary staging tables. Surface scanning encounters immediate hurdles: bale wrap residue, surface dirt, oxidative yellowing from ocean transit, and oil contamination from baling presses.
Reliable inspection protocols dictate stripping the outer three centimeters of compacted fiber before presenting the interrogation window. A clean surface presentation produces clean spectral baselines.
Surface scanning captures only outer packaging layers unless pneumatic probes expose inner material.
The beam illuminates the raw stock. Handheld optical guns and gantry-mounted sensor heads interrogate the stock through quartz glass contact windows. Contact pressure alters bulk density, changing photon penetration depth from two millimeters in lightly fluffed fiber to less than five hundred micrometers in compressed bale strata.
Technicians standardize contact force using spring-loaded optical barrels, ensuring consistent optical path lengths across disparate lots.

Sensor Configurations across Commercial Sorting Systems
Commercial hardware mounts stationary spectrometer heads above high-speed conveyor belts or portable optics against raw bales. Fiber sorting facilities select sensor geometries based on material velocity and spatial presentation across the receiving staging floor.
- Point Spectrometers gather discrete spectral signatures across spot sizes between five and ten millimeters. The operator records multiple contact points across the bale perimeter to build a composite identification average.
- Hyperspectral Line Imagers collect contiguous spatial and spectral data across moving conveyors at speeds exceeding two meters per second. This arrangement flags rogue synthetic patches nested inside natural fiber streams before mechanical tearing heads engage.
- Pneumatic Insertion Probes drive light guides deep into unopened bales through hollow stainless steel lances. Fiber composition reads directly from interior core zones, avoiding bale de-strapping entirely.
Sellers routinely argue that surface dirt and packaging scuffs created false polyester readings during initial optical scanning.

Scatter
Photons directed into tangled staple masses follow tortuous paths dictated by boundary interfaces. Dense bales alter photon paths. An incoming near-infrared beam encounters hundreds of air-to-polymer refractive index transitions within each cubic millimeter of compacted raw material.
Rayleigh scattering dominates at shorter wavelengths, while anisotropic Mie scattering governs photon travel through fibers whose diameters match the interrogation wavelength. This physical scattering masks chemical absorption signals unless pre-processing algorithms untangle optical path variations from true molecular absorption.

Molecular Absorption across Infrared Bands
Cellulose chains absorb characteristic energy in the short-wave infrared region through carbon-oxygen and oxygen-hydrogen overtone stretching. The primary overtone of the cellulose hydroxyl group produces a diagnostic absorption band centered near 1490 nanometers. Polyester produces distinctive aromatic carbon-hydrogen stretching overtones near 1660 nanometers and carbonyl ester combination bands at 1900 to 1950 nanometers.
Polyamide polymers reveal themselves through nitrogen-hydrogen stretching overtones near 1530 nanometers and secondary amide bands at 2180 nanometers. Protein fibers such as wool and cashmere show pronounced amide combinations across the 2050 to 2200 nanometer window.
Specular reflection degrades accuracy. When raw fiber surfaces carry residual spinning lubricants, silicone softeners, or processing finishes, incoming light reflects directly off the fiber exterior without entering the polymer matrix. Diffuse reflection accessories isolate subsurface scattered light using cross-polarized optics or integrating spheres.
Collecting purely diffuse reflectance ensures that recorded spectral dips represent bulk polymer chemistry rather than topical wax coatings.
Testing under ISO 1833 establishes the benchmark legal record while optical reflectance serves incoming screening.
Solvent digestion dissolves synthetic polymers. Wet chemical procedures outlined in standard testing methods destroy the substrate through selective chemical dissolution. Sulfuric acid dissolves cellulosic fibers, leaving polyester intact; formic acid selectively removes nylon while preserving acrylics and wool.
These gravimetric procedures yield precise mass determinations down to half a percent when performed by seasoned chemists. Optical methods yield equivalent data within five seconds when multivariate calibration routines correct for physical scattering phenomena.

Will Optical Spectrometry Replace Chemical Dissolution?
Standardized wet laboratory procedures isolate constituent polymers through selective solvent extraction. The regulatory infrastructure supporting international commercial trade relies on gravimetric dissolution results as legal truth. Optical measurements represent an indirect estimation based on chemometric correlation models.
When a shipment dispute enters formal commercial arbitration, courts demand certified ISO 1833 test certificates. Optical systems serve high-throughput incoming screening, process control, and risk containment, while wet chemistry remains the unyielding arbiter of customs compliance.
| Fiber Polymer Type | Diagnostic Wavelength (nm) | Molecular Bond Assignment | Interference Vulnerability |
|---|---|---|---|
| Cellulose (Cotton, Viscose) | 1490, 2100, 2270 | O-H first overtone, C-H combination | Bound moisture regain, starch sizing |
| Polyester (PET) | 1660, 1910, 2130 | Aromatic C-H stretch, C=O ester combination | Titanium dioxide delustrant |
| Polyamide (Nylon 6, Nylon 6,6) | 1530, 2180, 2295 | N-H stretch overtone, Amide II combination | Acid dyes, atmospheric moisture |
| Wool and Specialty Animal Hair | 1510, 1980, 2060 | N-H stretching, S-S disulfide linkages | Residual lanolin, vegetable matter |
| Acrylic (Polyacrylonitrile) | 1680, 2150, 2240 | C-N nitrile stretch combination | Modacrylic comonomers, solvent residues |
| Elastane (Polyurethane) | 1690, 2000, 2220 | Urethane C=O stretch, aliphatic C-H | Silicone needle oils, spin finishes |
Whether low-cost multispectral sensors can ever separate chemically bleached cellulose from lyocell in dense raw bales remains an open question across analytical laboratories.


Core
Mechanical sampling tubes bite eighteen inches into packed fibrous masses to extract internal plugs. Augers penetrate compressed layers. A raw textile bale is rarely homogeneous.
Post-industrial waste streams frequently bundle white cotton offcuts on the exterior face while sandwiching heavily dyed polyester-rich trimmings in the interior core. Relying exclusively on surface readings invites catastrophic lot rejection downstream. Accurate quantification demands multi-point physical coring coupled with depth-resolved optical scanning.

Stratification within Compressed Packaging
Post-consumer and post-industrial sorting lines generate extreme spatial variance across individual package volumes. Stratification ruins single point measurements. Baling presses compress heterogeneous waste under hydraulic rams operating at pressures above two hundred bar.
This force locks dense clusters of disparate synthetic yarn fragments, woven scrap, and knitted clippings into compacted blocks. Optical sensors focused on an outer quadrant record ninety percent cotton, while the inner package core contains seventy percent synthetic filament.
Recycled stock contains foreign contaminants. Opening lines suffer mechanical damage when rogue elastomeric spandex bands, metallic zippers, or polypropylene baling twine slip through undetected. Point spectrometers fail to catch localized contamination pockets.
Hyperspectral line scanners positioned above opening conveyors view the full material curtain as bale pluckers feed inventory into blowrooms, registering composition spikes in real time.

Mechanical Extraction Protocols for Depth Profiling
Pneumatic hollow augers draw cylindrical plugs along perpendicular axes through the bale geometry. Core extractors extract continuous fibrous plugs measuring thirty millimeters in diameter across depths exceeding seventy centimeters. Technicians place these extracted cores into optical scanning channels, moving the fiber plug past an optical sensor window to record composition variations along the entire penetration depth.
- Perpendicular Core Sampling draws representative plugs through the top, center, and bottom thirds of the package geometry. The sample captures cross-sectional variations induced by hydraulic baling strokes.
- Rotational Core Presentation exposes the circumferential surface of the extracted plug to optical sensors. Rotating the specimen smooths out localized yarn clumps and uneven fiber orientation.
- Volumetric Opening Stage shreds extracted core plugs through miniature laboratory openers before presentation. Mechanical carding creates a uniform fibrous web, eliminating density gradients and optical orientation bias.
Multiple core extractions along opposing bale axes expose hidden synthetic pockets before carding machines jam.


Regression
Mathematical modeling bridges raw spectral reflectance values and physical mass percentages. Algorithms compress thousands of wavelengths. Raw diffuse reflectance curves display sloping baselines, additive light scatter shifts, and non-linear intensity variations caused by packing density changes.
Chemometric software applies mathematical pre-processing to eliminate physical artifacts before extracting chemical concentration data. Standard normal variate transformations and multiplicative scatter correction normalize baseline offsets. First and second derivatives calculated through Savitzky-Golay filtering resolve overlapping absorption peaks, isolating subtle chemical differences between cellulosic and synthetic components.

Partial Least Squares Chemometrics
Principal component routines compress thousands of discreet wavelength channels into orthogonal latent variables. Partial least squares regression correlates spectral variance directly with reference laboratory composition data obtained through gravimetric dissolution under ISO 1833. Calibration models require robust validation datasets spanning varied fiber origins, staple lengths, and spinning finishes.
A model trained strictly on virgin upland cotton and bright polyester filament fails when exposed to mechanical recycled cotton containing post-consumer laundering residues.
Calibration models require periodic maintenance. The desk has audited optical sorting systems where technicians ran five-year-old calibration files on imported circular knit waste. The resulting predictions drifted by nine percentage points against wet laboratory audits.
When fiber diameter shifts from fifteen micrometers to twenty-five micrometers, photon scatter changes fundamentally, altering the slope of the calibration curve. Robust chemometric pipelines mandate ongoing cross-validation against physical reference samples.
Near-infrared multivariate calibrations achieve a root mean square error of prediction below one point eight percent when water content stays within six percent relative humidity bounds.
Colorants mask underlying absorption peaks. Dark reactive dyes and carbon black pigments absorb broad bands of visible and near-infrared radiation, suppressing diffuse reflectance signals. Highly pigmented black or deep navy stock reduces reflected light intensity by up to ninety-five percent, lowering signal-to-noise ratios.
Chemometric algorithms combat dye interference by shifting predictive weight to short-wave infrared regions between 2000 and 2400 nanometers, where carbon-carbon and carbon-hydrogen molecular overtones overpower visible dye absorbances.

Colorants and Moisture Matrix Distortions
Reactive dyes, disperse pigments, and ambient humidity distort absorption peaks across the near-infrared spectrum. Moisture shifts the spectral baseline. Cotton displays a standard commercial moisture regain of eight and a half percent under standard atmospheric conditions of twenty degrees Celsius and sixty-five percent relative humidity.
Polyester holds a nominal regain of zero point four percent. Water features a massive hydroxyl absorption band near 1940 nanometers that easily overwhelms neighboring polymer features.
Cotton retains eight percent moisture. When raw bales travel through humid monsoon regions or experience ocean transit condensation, moisture levels swing wildly. An uncorrected optical algorithm misidentifies excess liquid water as additional cellulosic mass, artificially inflating the calculated cotton percentage.
Chemometric models resolve this by including independent water absorption channels as separate regression variables, isolating water mass from true fiber polymer ratios.

Should Processors Calibrate against Regional Regain Standards?
Commercial mass accounting requires baseline corrections based on ambient relative humidity and temperature. Fiber merchants invoice raw lots based on commercial allowance weights, adjusting bone-dry mass by official regain percentages. Calibration software operating inside real-time optical sorters must decide whether to output as-is instantaneous mass ratios or commercially adjusted standard regain values.
Discrepancies between instantaneous optical output and invoiced regain weights generate commercial friction between buyers and spinners.
| Fiber System Mixture | Calibration Model Type | Root Mean Square Error of Cross-Validation (%) | Coefficient of Determination (R²) | Maximum Tolerable Moisture Regain Drift (%) |
|---|---|---|---|---|
| Cotton / Polyester Virgin | Partial Least Squares (7 Factors) | 1.15 | 0.992 | ±1.8 |
| Recycled Cotton / Polyester Waste | Partial Least Squares (9 Factors) | 2.45 | 0.965 | ±1.2 |
| Wool / Polyamide Carpet Stock | Principal Component Regression | 1.80 | 0.981 | ±2.5 |
| Viscose / Polyester Nonwoven | Support Vector Machine Regression | 1.40 | 0.988 | ±1.5 |
| Post-Consumer Acrylic / Mixed Fluff | Partial Least Squares (10 Factors) | 3.10 | 0.942 | ±0.8 |
| Methods note: Calibration parameters derived from diffuse reflectance spectra recorded between 1100 nm and 2450 nm at 2 nm resolution, validated against ISO 1833 chemical dissolution datasets across 500 reference standards. | ||||

Cross-Industry Parallels in Chemometric Analysis
Grain terminals and bulk pharmaceutical mixers face identical challenges when quantifying organic powders across varying grain sizes. Starch granules and pharmaceutical excipients exhibit physical scattering shifts identical to those encountered in dense staple fiber clusters. Chemometricians in grain processing perfected extended multiplicative scatter correction to decouple moisture signals from grain protein content.
Textile spectroscopists directly adopt these mathematical algorithms to isolate cellulosic polymer mass from bound water content.
Consider an operational processing scenario handling forty metric tons of raw co-mingled stock. Assume the supplier declares a nominal blend ratio of sixty percent cotton and forty percent polyester. The buyer operates high-speed optical scanning with an established root mean square error of prediction of one point five percent.
If the chemometric software ignores moisture adjustments under ambient monsoon conditions of eighty-five percent relative humidity, the raw spectral curve registers cotton content at sixty-six percent due to water hydroxyl overtones. The buyer pays a premium for non-existent cellulosic fiber. True oven-dry chemical testing reveals the real ratio sits at fifty-four percent cotton and forty-six percent polyester.
On a forty-ton contract priced at two dollars and twenty cents per kilogram of cotton and one dollar and thirty cents per kilogram of polyester, uncorrected optical calibration masks an invoicing overcharge exceeding four thousand three hundred dollars.
Uncorrected moisture variations in chemometric models trigger false reject alerts that stall raw material feeding and inflate storage demurrage fees.


Recourse
Commercial contracts allocate risk when analytical determinations clash with seller declarations. Buyers deduct landed costs directly. Rapid optical screening provides instantaneous data, but transforming that optical data into actionable commercial adjustments requires binding contract structures.
When an incoming container tests outside specification on the unbaling floor, supply chain executives need clear contractual pathways to reject, re-negotiate, or re-classify the cargo before the lot enters the blowroom.

Regulatory Tolerance and Fiber Ratio Declarations
Customs authorities classify imported goods by chief weight under Harmonized System tariff codes. Tariffs jump at fifty percent. A textile shipment containing fifty-one percent cotton enters under distinct tariff headings with radically different duty structures than a shipment containing forty-nine percent cotton.
Commercial customs declarations permit narrow statutory tolerances, typically two to three percent for binary fiber products under federal labeling regulations. Exceeding these statutory thresholds constitutes customs misdeclaration, exposing the importing merchant to severe financial penalties and cargo seizure.
Customs tariffs shift abruptly when polyester content crosses the fifty percent threshold by weight.
The invoice reflects certified mass. When optical screening detects that a declared sixty-forty cotton-polyester delivery actually measures fifty-one percent polyester, the commercial risk shifts instantaneously. The buyer faces higher import duty rates under man-made fiber tariff schedules, alongside product labeling liabilities on finished apparel goods.
Rapid screening protects spinning margins.

Commercial Settlement Mechanics for Disputed Deliveries
Invoice adjustments follow pre-agreed graduated discount tables tied directly to certified test disparities. Arbitration panels demand wet assays. When optical screening signals a composition shift exceeding two percent from declared contract specifications, receiving protocols initiate secondary physical sampling.
Certified independent laboratories pull official grab samples for gravimetric chemical dissolution under ISO 1833. The resulting certified test certificate establishes the basis for financial debit notes or cargo rejections.
| Declared Ratio vs Actual Ratio | Applicable HS Code Shift | Customs Duty Differential | Commercial Penalty Formula |
|---|---|---|---|
| 60/40 Cotton/PET shifts to 52/48 Cotton/PET | None (Remains Chief Weight Cotton) | 0.0% | Direct price rebate per kg synthetic deviation |
| 52/48 Cotton/PET shifts to 48/52 Cotton/PET | Chapter 52 (Cotton) to Chapter 55 (Synthetic) | +4.5% to +8.2% | Full duty differential debit plus 5% handling fee |
| 80/20 Wool/Polyamide shifts to 70/30 Wool/Polyamide | None (Remains Chief Weight Wool) | 0.0% | Market value delta based on clean scoured wool prices |
| Declared 100% Cotton contains 3% Elastane | Pure Cotton to Cotton/Synthetic Mixed | +2.1% | Rejection of lot or 12% total invoice discount |
A contract clause stipulating independent chemical dissolution under standard laboratory atmosphere settles financial adjustments whenever optical scanning indicates a deviation exceeding three percent.