Calculating Reactive Dye Hydrolysis Rates in Jet Dyeing
Calculating reactive dye hydrolysis rates in jet dyeing requires tracking bath pH and absorbance over time to optimize alkali dosing and maximize color yield.
Valency
Nucleophilic Substitution and Addition Kinematics
Once alkali enters the dye bath, reactive colorants on cellulosic fibers follow two competing reaction pathways. The primary route attaches the dye’s reactive group to a cellulosate hydroxyl anion on the cotton backbone via a covalent bond. Concurrently, water hydroxyl anions attack the dye, cleaving leaving groups or saturating electrophilic carbons and permanently deactivating its ability to bond with the fiber.
Molecular structure dictates the rate constants for both routes. Monochlorotriazine dyes react via bimolecular nucleophilic substitution (SN2), where nucleophiles attack a carbon atom on the triazine ring in alkaline solution. Dichlorotriazine dyes have two chlorine leaving groups, accelerating substitution at lower processing temperatures.
These two electron-withdrawing halogen atoms raise the partial positive charge on the ring carbons, driving rapid kinetics even at 30 °C to 40 °C.
Vinylsulfone precursor dyes function through an elimination-addition sequence. In a neutral bath, the beta-sulfatoethylsulfone group stays unreactive toward both cellulose and water. Adding alkali triggers an elimination reaction that generates the active vinylsulfone moiety.
This activated double bond then undergoes nucleophilic addition from cellulosate anions or hydroxyl ions in the water. Because vinylsulfone reacts aggressively with hydroxide at higher temperatures, tight control over alkalinity and temperature ramps is essential to maximize fixation yield. Heterobifunctional dyes combine a monochlorotriazine and a vinylsulfone group within a single molecule, spreading fixation across two distinct reaction windows to cushion against circulation velocity changes in the jet machine.
| Reactive Group Class | Fixation Rate Constant k_f (L/mol·min) | Hydrolysis Rate Constant k_h (L/mol·min) | Fixation Activation Energy E_a,f (kJ/mol) | Hydrolysis Activation Energy E_a,h (kJ/mol) | Fixation Ratio k_f / k_h |
|---|---|---|---|---|---|
| Dichlorotriazine (DCT) | 0.48 | 0.085 | 62.5 | 78.1 | 5.65 |
| Monochlorotriazine (MCT) | 0.062 | 0.011 | 81.4 | 94.2 | 5.64 |
| Vinylsulfone (VS) | 0.31 | 0.052 | 74.8 | 88.6 | 5.96 |
| Monofluorotriazine (MFT) | 0.22 | 0.038 | 68.3 | 82.0 | 5.79 |
| Bifunctional (MCT/VS) | 0.41 | 0.064 | 72.1 | 86.5 | 6.41 |
Competitive Reaction Rates in Aqueous Cellulose Solutions
Describing hydrolysis mathematically requires isolating the pseudo-first-order rate constants for fixation and hydrolysis. At standard jet dyeing liquor ratios of 1:4 to 1:8, water concentration stays effectively fixed at 55.5 moles per litre. Hydrolysis rates therefore depend directly on the concentrations of active dye and free hydroxide ions.
The concentration of cellulosate anions is dictated by the dissociation constant of the cellulose hydroxyl groups, which has a pKa near 13.5 at 25 °C. Heating the bath lowers this pKa while increasing the ionic product of water (Kw).
The activation energy of reactive dye hydrolysis exceeds the activation energy of fiber fixation across every triazine and sulfone class used in commercial exhaust dyeing.
Because activation energy for hydrolysis (Ea,h) is higher than for fixation (Ea,f), elevating the dyeing temperature shifts the reaction toward dye destruction. For example, running a vinylsulfone exhaust cycle at 80 °C rather than 60 °C increases hydrolysis by a factor of 3.8, while fixation increases by only 2.9. As a result, the fixation-to-hydrolysis ratio (kf / kh) drops as heat rises.
DYERS must balance kinetic diffusion rates into the yarn core against chemical inactivation in the liquor. Unlevelness or low yield is often attributed to insufficient salt when fast hydrolysis has actually destroyed reactive centers before exhaustion could take place.
Nozzle
Mass Transfer Dynamics in High Velocity Jets
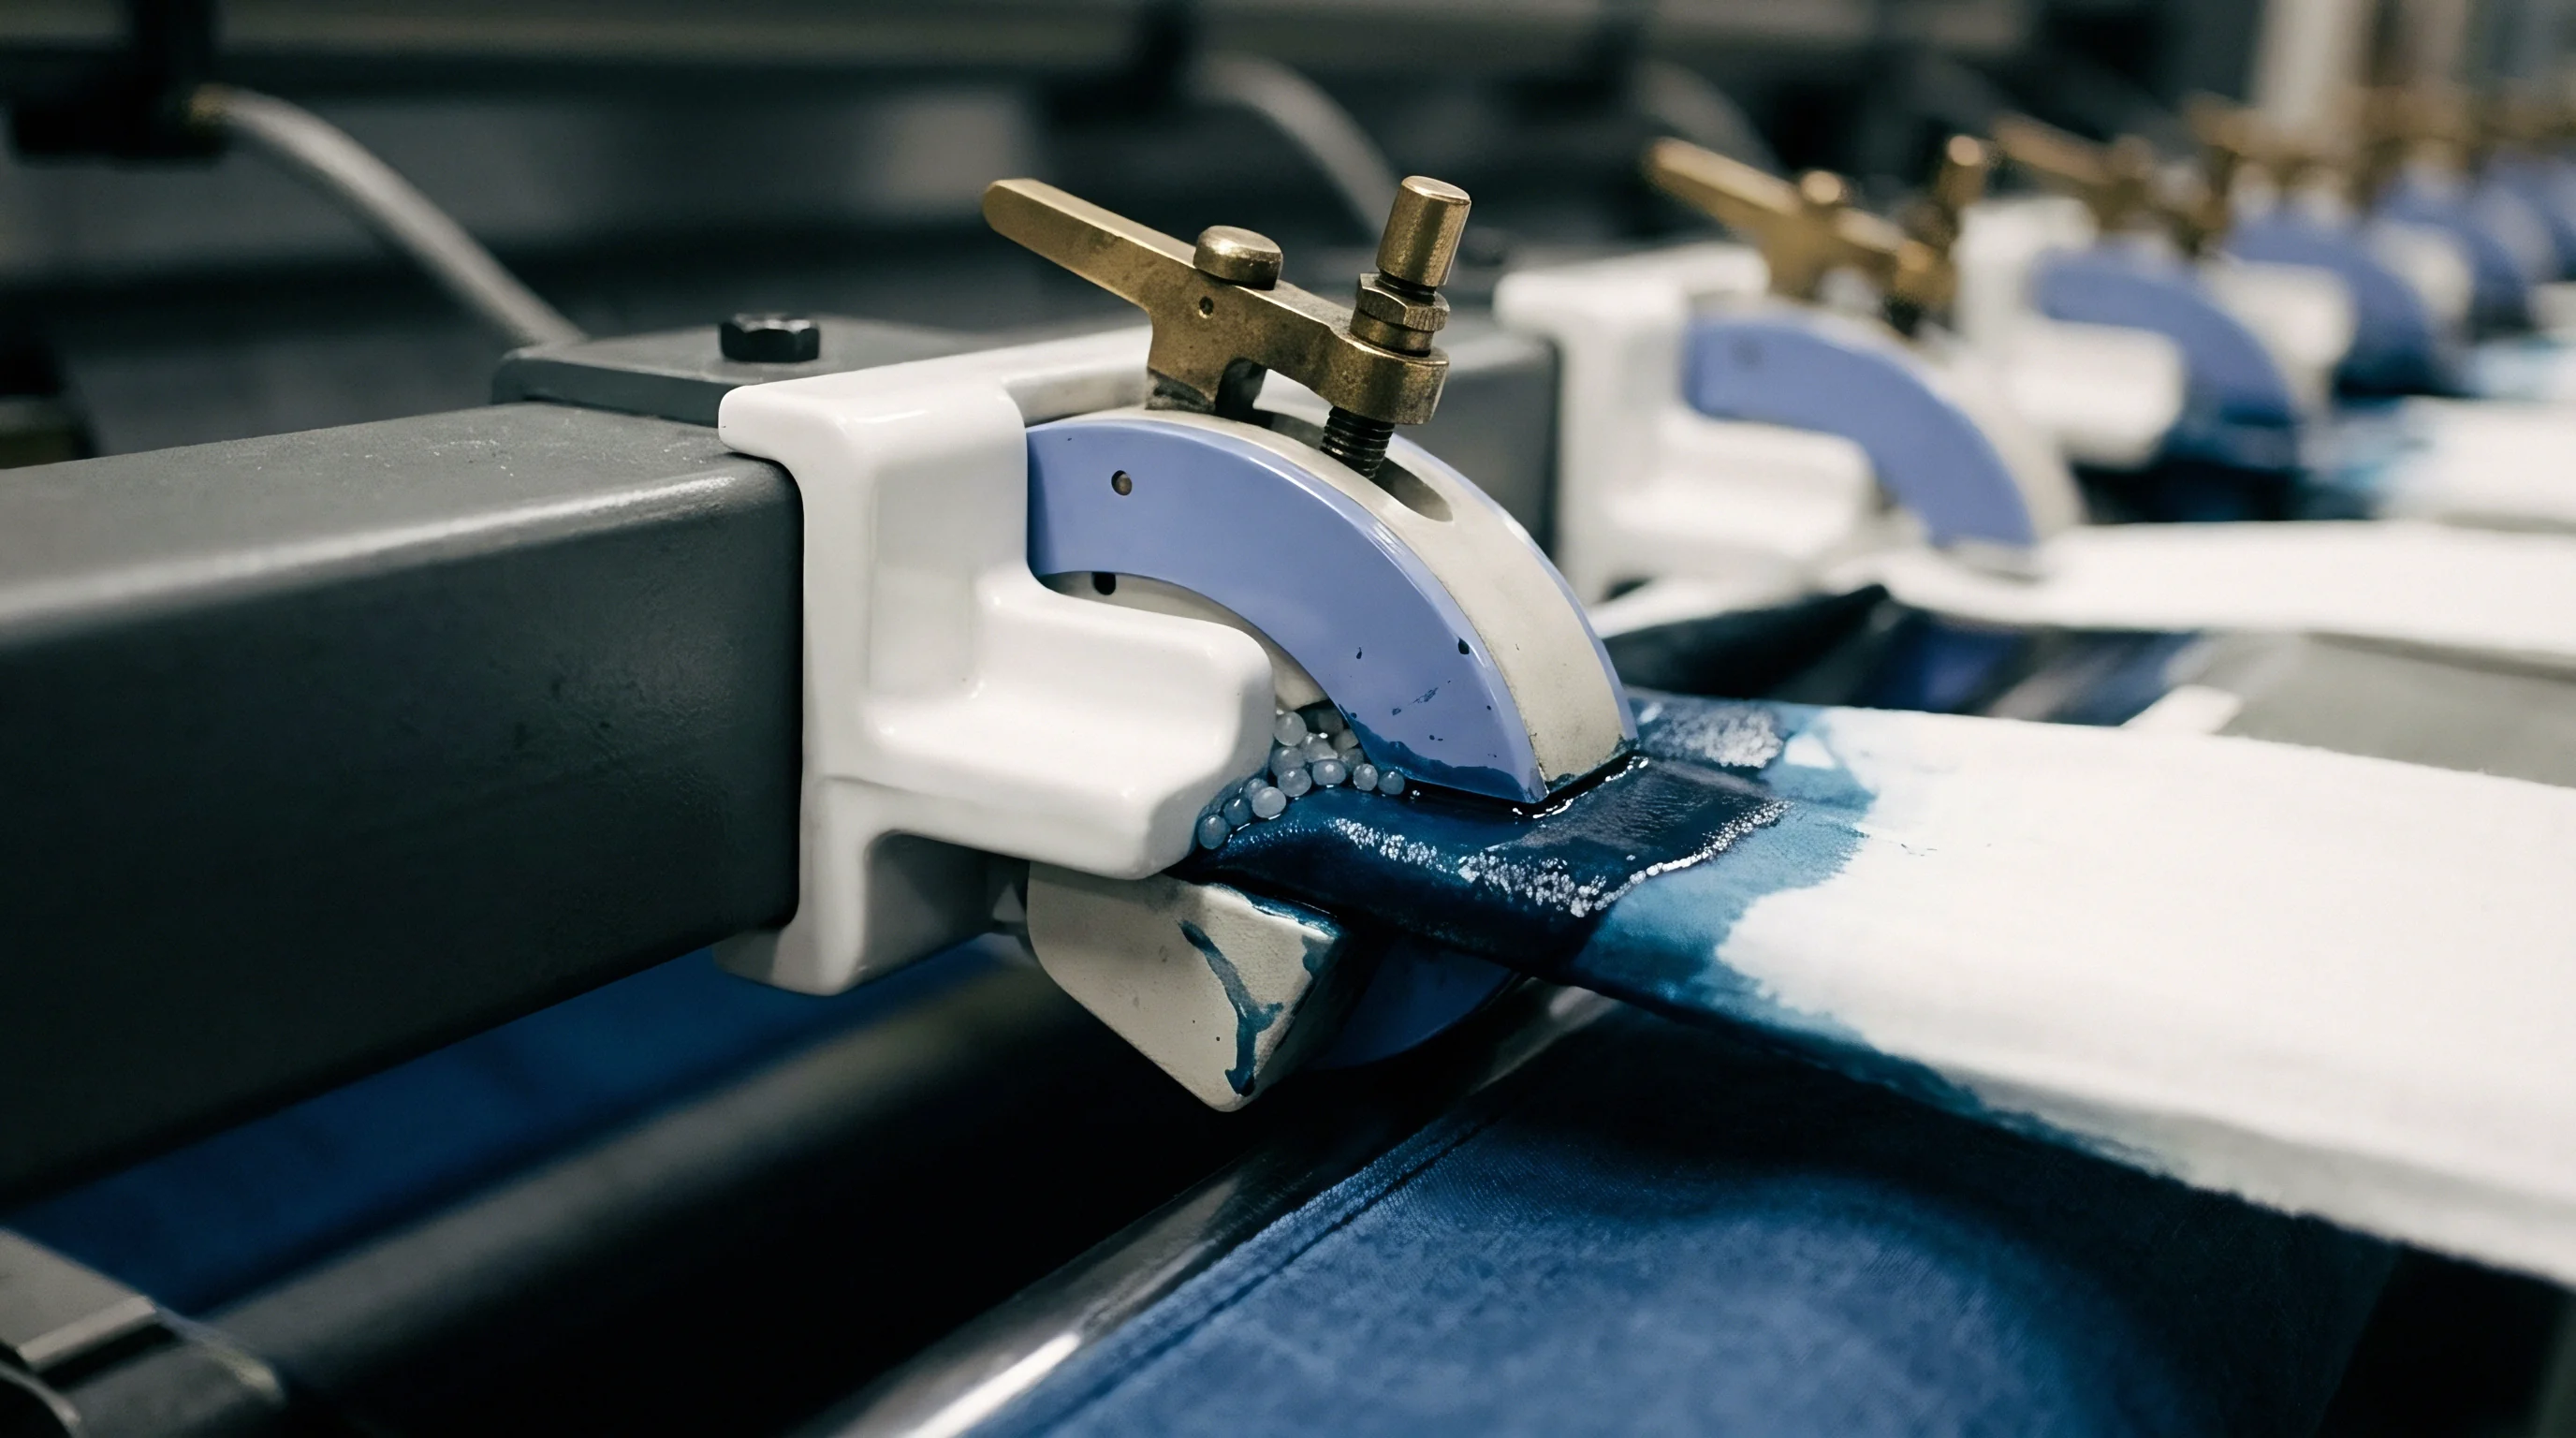
Fluid movement through the jet pipe drives boundary layer disruption at the fabric surface. As fabric ropes pass continuously through a venturi orifice, pressurized dye liquor impacts the textile structure, forcing dye molecules from the bulk liquor into the yarn’s interpore spaces. High velocity jet liquor thins the stagnant boundary layer surrounding individual cotton fibers, raising mass transfer coefficients.
If chemical reaction outpaces mass transfer, dye molecules lingering in the boundary layer hydrolyze entirely before penetrating into the fiber interior.
Liquor ratios in modern jet equipment range from 1:4 for synthetic-blend knits to 1:6 for 100 percent combed cotton single jersey. Lowering liquor volume boosts initial bath concentration, steepening the concentration gradient that drives internal diffusion. However, concentrated dye also accelerates pseudo-first-order reaction kinetics.
If alkali is added before boundary layer equilibrium settles, surface dye faces immediate nucleophilic attack by hydroxide ions. The process is governed by the Damköhler number (Da) ~ the ratio of chemical reaction rate to convective mass transfer rate. A Damköhler number above unity indicates that hydrolysis occurs faster than fluid transport can deliver fresh dye into the fiber interior.
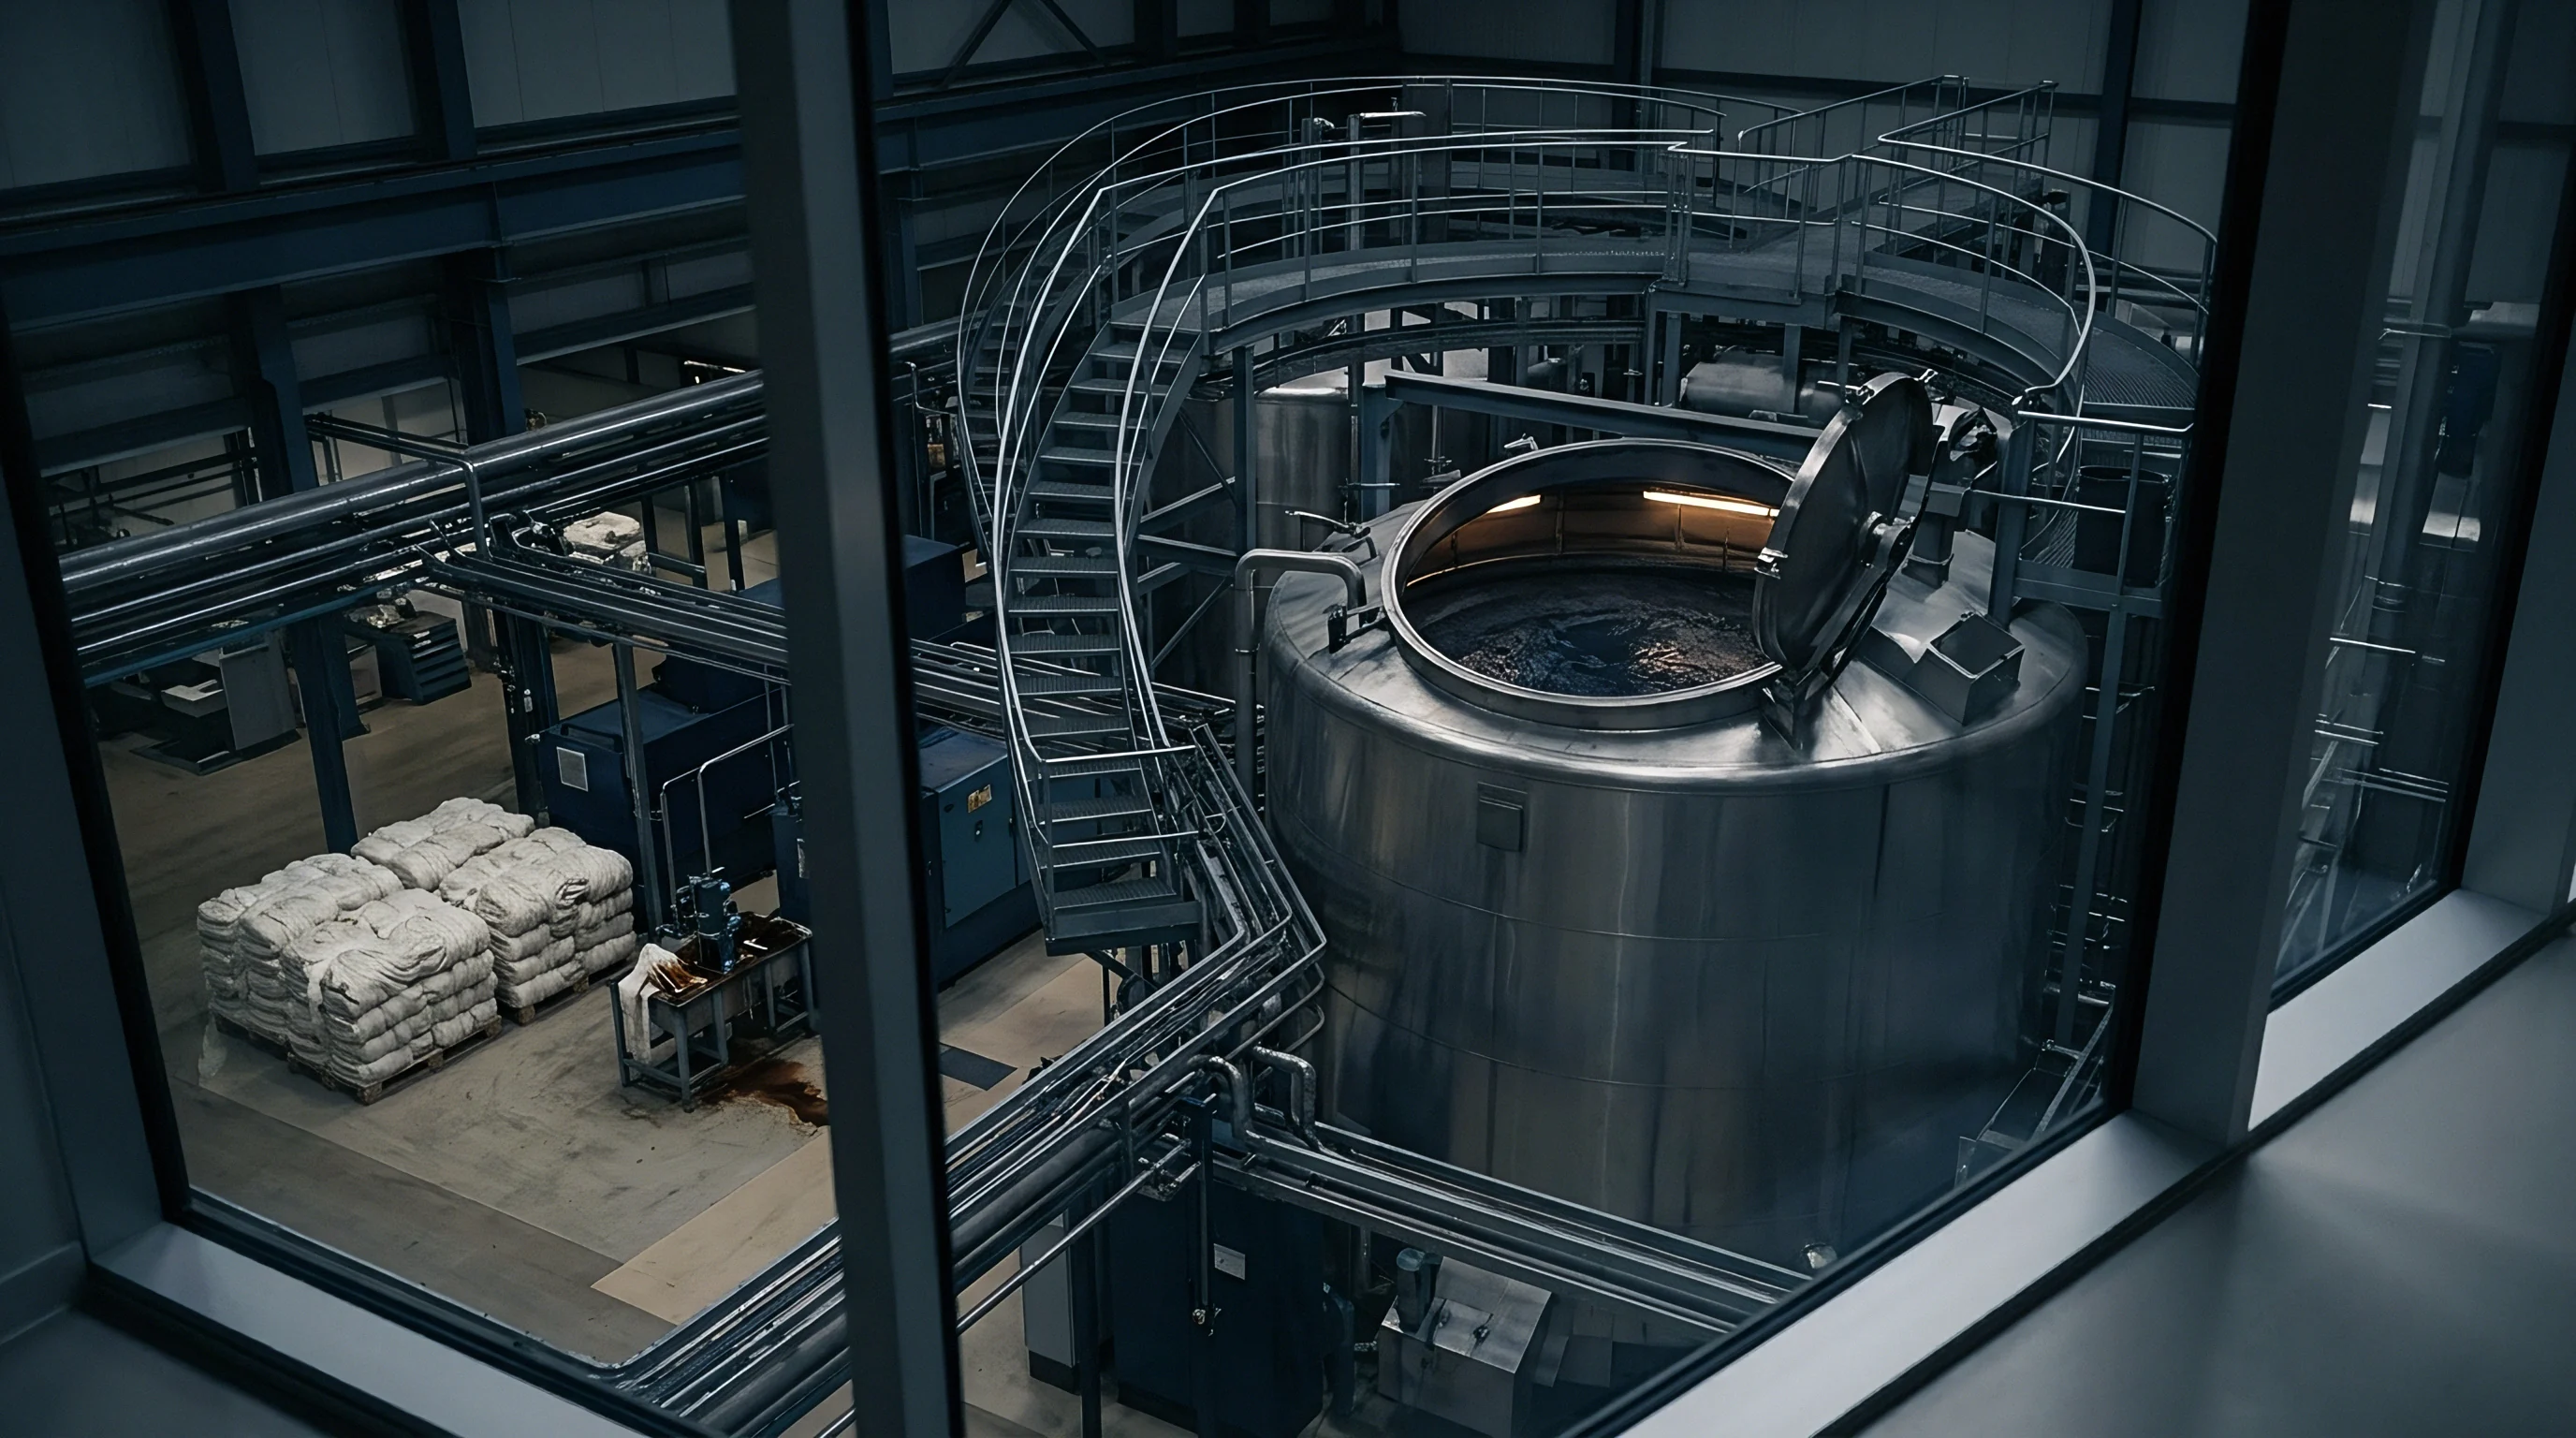
Rope circulation cycle time dictates how often each metre of fabric enters the liquid application zone. A 190-metre fabric rope running at 380 metres per minute completes a full cycle every 30 seconds. Inside the jet chamber, high shear drives rapid liquor exchange.
But while resting in the main storage vessel between passes, the rope takes in very little fresh liquor, meaning hydrolysis inside the vessel depends on liquor trapped within the yarn capillary structure. When static dwell time between nozzle passes stretches too long, localized pH gradients form within the rope, accelerating hydrolytic destruction of unfixed dye trapped on fiber surfaces.
Boundary Layer Resistance and Rope Circulation
Yarn structure alters boundary layer resistance during jet circulation. Ring-spun cotton features parallel fiber alignment and uniform capillary channels, allowing rapid liquid uptake during high-pressure nozzle transport. Open-end rotor yarns carry wrapped surface fibers that block fluid penetration under brief pressure impulses.
Fabric rope speed governs contact. When processing heavy gauge fleece or dense interlock knits, jet nozzle pressure must scale upward to maintain complete liquor penetration through the fabric cross-section.
- Boundary layer stagnation occurs when fabric rope speed drops below 250 metres per minute, causing surface dye hydrolysis before core fiber diffusion completes.
- Localized pH spiking develops when high-concentration alkali liquid feeds directly into the main storage vessel instead of the primary circulation pipe prior to the jet orifice.
- Channeling failure arises when fabric ropes tangle or stall in the accumulator, exposing isolated segments to prolonged chemical reaction without fluid exchange.
- Pore saturation blocking occurs in high-density knits where entrapped air prevents dye liquor from reaching internal fiber bundles during short nozzle dwell times.
- Shear degradation impacts high molecular weight reactive dyes when nozzle differential pressure exceeds 2.2 bar, breaking dye aggregates into rapid-hydrolysis monomer states.
Calculating effective hydrolysis in a jet machine requires coupling fluid transport models with chemical kinetics. Mass transfer inside the yarn bundle follows Fickian diffusion modified by a reactive sink term. Whenever rope speed drops out of sync with pump discharge rate, dye loss to hydrolysis per second increases.
High circulation speeds keep alkali evenly distributed along the full length of the fabric rope, suppressing localized hydrolysis hot spots. Maintaining continuous liquor exchange through the venturi zone preserves the concentration gradient needed to drive dye molecules into the cellulosic matrix before hydrolysis eliminates their reactive capacity.
Proper jet tuning balances mechanical pump pressure against fabric tension to prevent surface abrasion while maximizing liquor turnover per minute. Dyestuffs with lower affinity require higher circulation frequencies to achieve target fixation before hydrolysis depletes the bath colorant reserves. As a practical operational standard, high rope turnover combined with progressive alkali additions yields maximum color yield on circular knits.


Alkalinity
Thermodynamic Activation and Ph Dosing Curves
Adding alkali activates cellulosic fibers by converting neutral hydroxyl groups into nucleophilic cellulosate anions. Sodium carbonate (Na2CO3), sodium hydroxide (NaOH), and sodium bicarbonate (NaHCO3) serve as the main alkaline buffers in jet dyeing. Cellulosate ion concentration grows linearly as bath pH shifts from 9.0 to 11.5, whereas hydroxide ion concentration increases exponentially over the same range.
Above pH 11.2, the rate of dye hydrolysis accelerates faster than fiber fixation, driving down overall dye yield.
Progressive dosing curves regulate hydroxide addition to match the kinetic uptake of specific dye classes. Linear alkali dosing over 30 minutes produces a sharp pH spike in the first 5 minutes due to the logarithmic nature of hydrogen ion concentration. This early pH jump triggers intense dye hydrolysis before dyestuff has fully migrated throughout the fabric rope.
Quadratic or progressive dosing schedules introduce less than 15 percent of the total alkali volume during the first half of the dosing cycle, maintaining a low, stable pH that permits dye migration without chemical destruction.
| Dosing Profile Type | Initial pH | Final pH | Dosing Time (min) | Fixation Yield (%) | Hydrolyzed Dye in Bath (%) | Unexhausted Dye (%) |
|---|---|---|---|---|---|---|
| All-In Shot Addition | 11.4 | 11.4 | 0 | 52.3 | 38.1 | 9.6 |
| Linear Dosing | 9.2 | 11.3 | 45 | 68.7 | 24.2 | 7.1 |
| Quadratic Progressive | 8.8 | 11.2 | 45 | 78.4 | 16.1 | 5.5 |
| Step Dosing (3-Stage) | 9.0 | 11.3 | 60 | 74.1 | 19.8 | 6.1 |
Adding electrolytes alters the chemical potential of reactive dyes in aqueous solution. Sodium sulfate (Na2SO4) or sodium chloride (NaCl) added at concentrations between 30 and 80 grams per litre shields the negative surface charge cotton develops in water. Neutralizing this surface charge promotes dye adsorption onto the fiber prior to alkali dosing.
Higher salt concentrations shift the dye distribution ratio (KD) toward the fiber phase, lowering residual dye in the bulk liquor phase. Because hydrolysis occurs predominantly in the aqueous bath phase, maximizing dye exhaustion prior to alkali dosing minimizes total colorant destruction.
Purchase order specifications for reactive-dyed cotton knits must state maximum allowable unwashed unfixed dye levels under ISO 105-C06 test conditions.
Temperature Profiles across Thermal Dwell Periods
Temperature control during the alkali fixation step determines the final balance between fixed color and hydrolytic waste. Processing typically follows either an isothermal or a rising-temperature profile. Isothermal processing maintains a constant temperature, such as 60 °C for vinylsulfone dyes, throughout both exhaustion and fixation.
Rising-temperature profiles exhaust dye at 40 °C to 50 °C before raising the bath to 80 °C or 90 °C for monochlorotriazine fixation.
- Audit incoming salt purity to verify that calcium and magnesium contamination does not buffer bath pH below the required activation threshold.
- Calibrate online pH probes at processing temperature rather than room temperature to avoid temperature-induced dissociation measurement errors.
- Program progressive alkali dosing to match the specific affinity profile of the lowest affinity dye component in a trichlor dye recipe.
- Verify jet rope cycle time stays below 45 seconds prior to initiating alkali dosing to eliminate shade streakiness caused by localized pH variance.
Tracking bath pH isolates the point where soda ash addition destabilizes equilibrium. Uncontrolled alkalinity forces an immediate jump in bath hydroxide concentration, driving the calculated hydrolysis rate constant from 0.008 to 0.045 per minute within a three-minute window. The resulting bulk batch misses shade targets by 2.2 Delta E units due to massive colorant inactivation.
Correcting the dosing pump curve back to a progressive exponential profile restores fixation yields to 78 percent while bringing batch-to-batch color repeatability within a 0.5 Delta E tolerance.
Model
Integrating Differential Mass Balances for Jet Systems
Determining the real rate of reactive dye hydrolysis in a jet dyeing machine requires solving a coupled differential system that accounts for fluid transport, fiber sorption, covalent fixation, and liquid-phase destruction. The mass balance for dyestuff in the bulk liquid phase (Cb) follows the differential equation:
fracdCbdt = – frackm AVb (Cb – Cs) – kh Cb
Here, km represents the convective mass transfer coefficient across the yarn boundary layer, A is the total accessible surface area of the fabric rope, Vb is the total dye bath volume, Cs is dye concentration at the immediate fiber surface, and kh is the second-order rate constant for dye hydrolysis. The term kh Cb quantifies the rate of chemical dye destruction occurring in the bulk liquor phase.
The mass balance for dye adsorbed on the fiber surface (Cf) incorporates both internal diffusion into the fiber core and covalent reaction with cellulosate anions ( ):
fracdCfdt = frackm AVf (Cb – Cs) – kf Cf – kh,f Cf
In this equation, Vf is fiber phase volume, kf represents the second-order fixation rate constant, and kh,f is the rate constant for hydrolysis of dye adsorbed within fiber pores. Because hydroxyl ion mobility inside the swollen cellulose matrix is restricted relative to the free bath liquid, kh,f is typically lower than the bulk fluid hydrolysis rate constant kh by a factor of 0.3 to 0.6.
Fixation demands cellulosate ions. Integrating these differential mass balances yields the exact mass of fixed dye (Mfixed), hydrolyzed dye (Mhydrolyzed), and residual active dye (Mactive) at any time step t during the dyeing cycle:
Mhydrolyzed(t) = int0t left( kh Cb(t) Vb + kh,f Cf(t) Vf right) dt
Fixation Efficiency F(t) = fracMfixed(t)Mtotaladded × 100
Hydrolysis Percentage H(t) = fracMhydrolyzed(t)Mtotaladded × 100
A 100-kilogram batch of cotton jersey processed at a 1:5 liquor ratio with 2.0 percent shade depth loses exactly 362 grams of pure dyestuff to bath hydrolysis under linear alkali addition.
Stepwise Rate Constant Extraction from Bath Absorbance Data
Extracting empirical kinetic constants requires pulling bath samples at precise time intervals during the fixation dwell period. Absorbance spectroscopy at peak wavelength (λmax) measures total remaining colorant concentration. Spectrophotometric analysis alone cannot distinguish active unreacted dye from hydrolyzed dye because both species possess identical chromophoric structures.
High-Performance Liquid Chromatography (HPLC) or capillary zone electrophoresis separates active vinylsulfone or triazine dye from hydrolyzed hydroxy derivatives.
| Time (min) | Bath pH | Total Bath Absorbance (AU) | Active Dye Concentration (g/L) | Hydrolyzed Dye Concentration (g/L) | Cumulative Fixation (%) | Calculated k_h (L/mol·min) |
|---|---|---|---|---|---|---|
| 0 | 7.2 | 1.850 | 4.00 | 0.00 | 0.0 | 0.000 |
| 10 | 9.8 | 1.210 | 2.10 | 0.28 | 38.5 | 0.041 |
| 20 | 10.6 | 0.740 | 0.95 | 0.51 | 58.2 | 0.048 |
| 30 | 11.2 | 0.480 | 0.38 | 0.62 | 68.9 | 0.052 |
| 45 | 11.3 | 0.360 | 0.09 | 0.68 | 74.6 | 0.053 |
| 60 | 11.3 | 0.330 | 0.01 | 0.71 | 75.2 | 0.053 |
Calculating the observed pseudo-first-order hydrolysis rate constant (kh,obs = kh ) involves plotting the natural logarithm of active dye concentration against time during periods of constant pH. The slope of the resulting linear regression line equals -(kf,obs + kh,obs). Isolating kh,obs requires measuring the rate of appearance of the hydrolyzed hydroxy-dye HPLC peak over the same time increment.
Altering the progressive dosing profile leaves an unfixed dye residue of 2.4 grams per kilogram of fabric. This adjustment reduces the effective pseudo-first-order hydrolysis rate constant from 0.053 to 0.021 per minute, shifting 650 grams of dyestuff from bath waste into permanent covalent bonding across a 250-kilogram production batch.
- Draw 10 millilitre dye bath samples through a cooled sampling valve at 0, 5, 10, 15, 20, 30, 45, and 60 minutes into the alkali dosing cycle.
- Quench each sample immediately by injecting 0.1 molar acetic acid to drop the pH below 4.0, freezing chemical reaction kinetics.
- Filter samples through a 0.22 micron PTFE syringe filter to eliminate particulate cotton lint prior to optical analysis.
- Inject 20 microlitres into a reverse-phase C18 HPLC column operating under an acetonitrile-water mobile phase gradient.
- Integrate peak areas for active vinylsulfone dye and hydrolyzed hydroxy-sulfone dye to calculate instantaneous mass fractions.
Commercial processing contracts should explicitly state that dye batch yield calculations rely on HPLC chromatographic separation rather than total optical bath absorbance. Contracting parties who rely solely on optical density miscalculate unexhausted dye fractions by treating hydrolyzed colorant as active dye, inflating perceived bath exhaustion by up to 25 percent.
Bench
Spectrophotometric and HPLC Bath Analysis
Verifying hydrolysis rates analytically depends on separating active dye molecules from hydrolyzed byproduct species in bath samples and fabric extracts. Transmission spectrophotometry measures light attenuation across the visible spectrum, generating absorbance values that correlate with total dye concentration according to Beer-Lambert’s Law. Spectrophotometry alone cannot resolve structural modifications occurring at the reactive anchor group.
A hydrolyzed dichlorotriazine molecule retains its exact chromophoric structure, yielding identical light absorption profiles at peak wavelength compared to its reactive parent structure.
Chromatographic separation resolves structural differences by exploiting solubility variations between active and hydrolyzed forms. Reverse-phase High-Performance Liquid Chromatography (HPLC) utilizes a non-polar stationary phase coupled with a polar mobile phase containing ion-pairing agents such as tetrabutylammonium bromide or triethylamine acetate. Active halo-triazine or vinylsulfone groups show longer retention times on C18 stationary phases compared to their hydrolyzed hydroxyl analogs due to differences in polar surface area and chemical hydration.
Integrating chromatographic peak areas yields the ratio of reactive dye to hydrolyzed dye present in the dye bath at any point during the fixation cycle.
Why Does Core Extraction Differ from Bath Absorbance?
Cross-sectional extraction of dyed yarn bundles reveals significant concentration gradients between external fiber layers and internal yarn cores. Solvent extraction utilizing a 50 percent aqueous pyridine solution at boiling temperature strips unfixed and hydrolyzed dye from cotton fibers without cleaving covalent cellulose-dye bonds. Spectrophotometric analysis of the pyridine extract quantifies the total mass of unfixed colorant trapped within the yarn capillary matrix.
Surface fibers exposed directly to high velocity jet flow reach quick equilibrium with the bulk dye bath. Internal core fibers rely entirely on slow capillary diffusion through tortuous inter-fiber pathways. When alkali enters the dye bath prematurely, dye molecules situated in the bulk bath and on external fiber surfaces undergo rapid reaction, while core fibers remain unpopulated.
Hydrolysis consumes the bulk dye pool before internal diffusion completes, leaving internal fibers uncolored. Cross-sectional microtome cuts of cotton yarns analyzed under optical microscopy show dark surface rings surrounding white, undyed fiber centers whenever hydrolysis rate constants outpace mass transport velocity.
- Sampling dossier containing time-stamped pH profiles, temperature records, and pump speed logs for every qualification batch.
- HPLC chromatograms showing separation of active and hydrolyzed dye components at key process stages.
- Pyridine extraction data detailing total unfixed dye mass per gram of dry fabric post-fixation.
- Yarn cross-section micrographs confirming uniform dye penetration into internal fiber cores across the fabric rope.
What analytical boundary separates acceptable surface-trapped hydrolyzed dye from a critical fastness failure in high-density interlock knits?

Yield

Wash off Loadings and Thermal Water Budgets
Hydrolyzed dye remaining inside the cotton fabric structure creates severe color fastness risks if not completely removed during post-dyeing wash-off processes. Because hydrolyzed reactive dye possesses structural affinity for cellulose identical to that of active unreacted dye, simple cold water rinsing fails to remove colorant molecules trapped within fiber pores. Effective wash-off requires heating the bath above the glass transition temperature of swollen cellulose (75 °C to 80 °C) to break weak hydrogen bonds between hydrolyzed dye and cotton hydroxyl groups.
Jet machines execute multi-stage washing profiles that alternate hot baths containing polyacrylate dispersing agents with cold overflow rinses. A standard wash-off sequence for dark shades involves a cold rinse at 40 °C, an acid neutralization step at 50 °C using acetic acid to destroy residual alkali, two boiling washes at 95 °C with polymeric washing-off agents, and a final cold softening bath. This sequence consumes between 35 and 60 litres of water per kilogram of fabric, while requiring significant boiler steam to heat successive bath fills.
High hydrolysis rates increase both water consumption and total wash-off cycle time. When a jet dyeing process exhibits a low fixation yield of 60 percent, 40 percent of the total dye input sits in the fabric and bath as unfixed waste. Removing this high mass of hydrolyzed dye requires extending the boiling wash phase by two to four additional fill-and-drain cycles.
Each additional hot wash cycle adds 20 minutes to total machine batch time while increasing thermal energy consumption by 0.8 megajoules per kilogram of fabric.
Minimizing bath dye hydrolysis during fixation reduces post-dyeing wash-off water consumption by up to forty percent.
Landed Fabric Cost and Commercial Penalties
Calculating the landed financial cost of reactive dyeing requires adding raw dye cost, auxiliary chemical expenses, thermal energy inputs, water usage fees, and wastewater treatment surcharges. Wasted colorant represents a direct financial loss. A dye recipe utilizing 3 percent overall colorant weight on a 300-kilogram fabric batch requires 9 kilograms of pure dyestuff.
At an average cost of 18 per kilogram for high-performance bifunctional dyes, the raw dye investment totals $162 per batch. A process operating at 65 percent fixation yield hydrolyzes $56.70 worth of dyestuff into wastewater waste per cycle.
Effluent penalties scale with total hydrolyzed dye mass and auξliary salt loading. Dyehouse wastewater treatment plants measure Chemical Oxygen Demand (COD) and total dissolved solids (TDS) prior to discharge. Hydrolyzed reactive dyes contain complex aromatic rings and sodium sulfonate groups that resist biological degradation in standard activated sludge systems.
Dyehouses incur surcharges ranging from $0.50 to $2.20 per kilogram of excess COD generated during high-hydrolysis processing runs. High salt concentrations ($Na2SO4) compound wastewater treatment expenses by requiring reverse osmosis or thermal evaporation systems to meet regional discharge standards.
Calculating the total landed cost of dyed knits requires adding raw chemical consumption to the thermal energy expended during hot wash-off. Machine operating hourly rates for modern multi-rope jet systems average $65 to $90 per hour. Extending wash-off duration by 45 minutes to clear high hydrolyzed dye loads adds $56.25 in machine time expense per batch.
When combined with wasted dyestuff and water heating costs, process inefficiencies stemming from unoptimized hydrolysis kinetics add up to $0.28 per finished metre of 180 g/m² cotton single jersey fabric. Controlling alkali dosing profiles and mass transfer velocity inside the jet nozzle protects margins while ensuring compliance with international fastness standards.