Blend Ratio Drift across a Season from One Blending Room
Blend ratio drift stems from uncompensated raw bale moisture changes and pneumatic sorting; control requires ISO 1833 dry-mass specs and real-time weigh-hopper NIR updates.

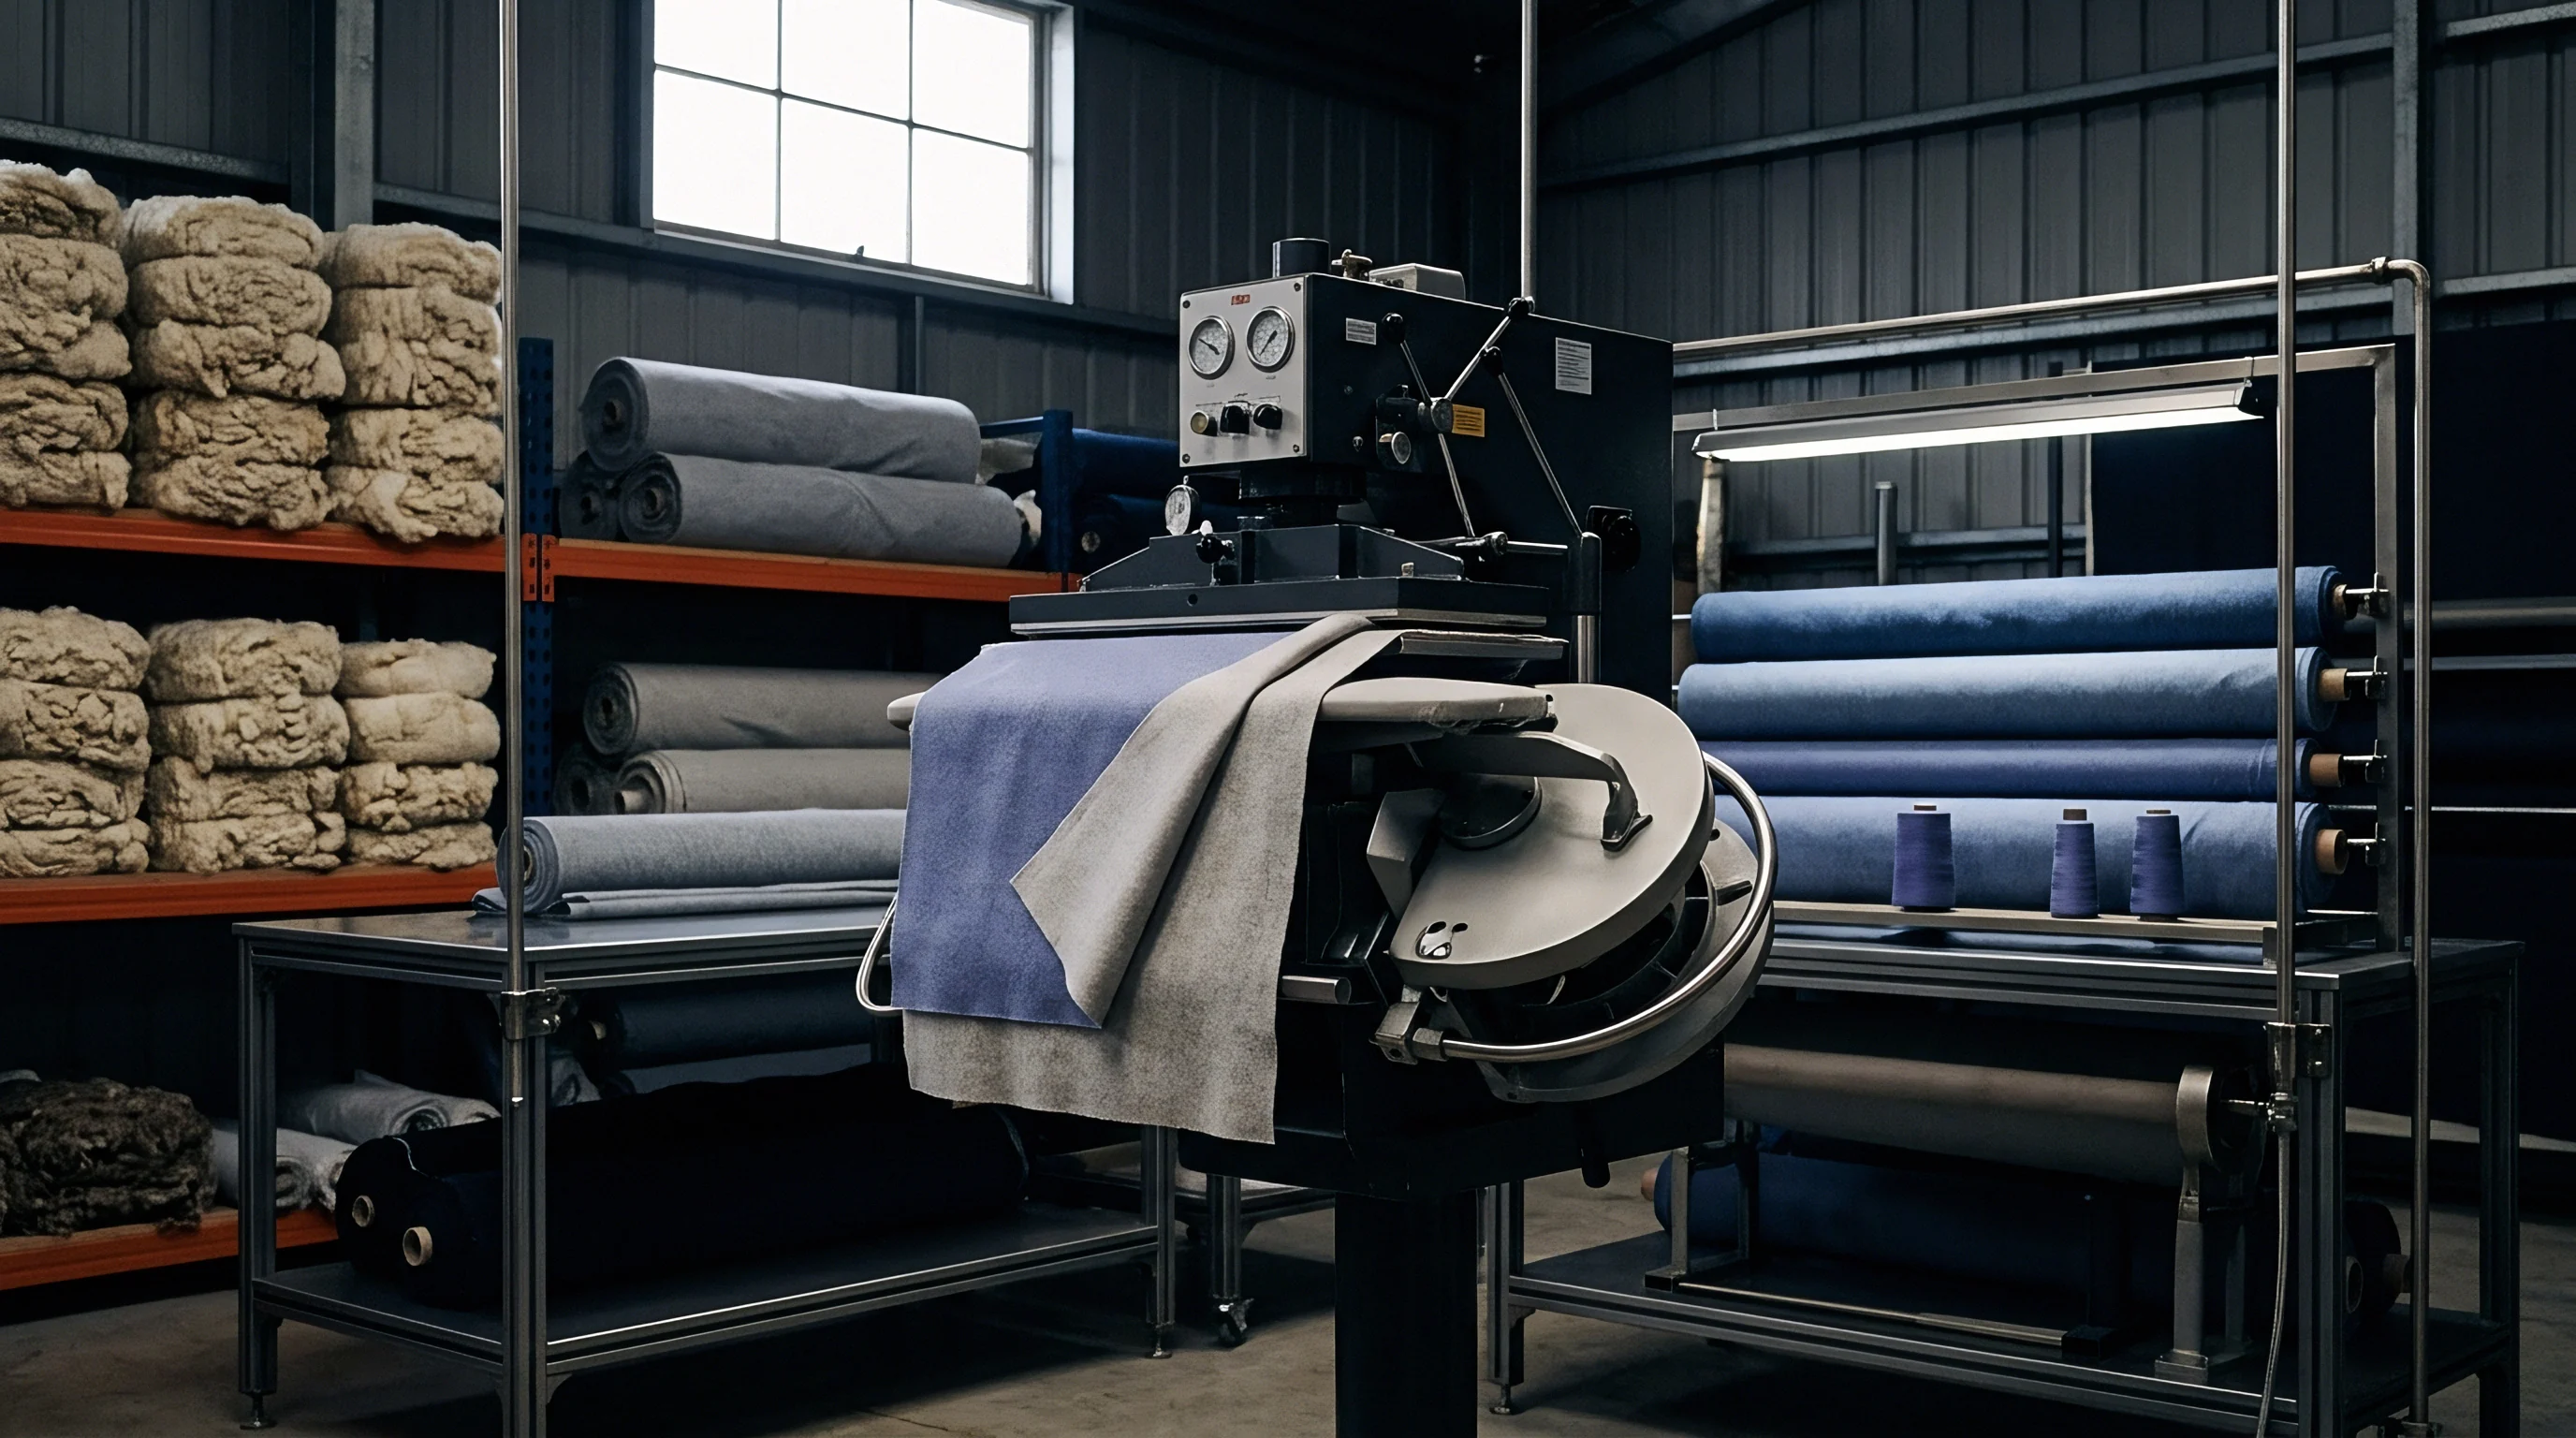
Silo
Automatic pluckers running a forty-bale laydown draw tufts across different agricultural lots over the course of a nine-month spinning contract. In a commercial cotton-polyester ring-spinning plant, the virgin fiber arrives through two radically different pipelines. Synthetic staple comes in as uniform tow, cut cleanly to thirty-eight millimeters at 1.5 dtex and a preset crimp count per inch.
The natural fiber arrives in compressed bales from early, mid, and late crop pickings, carrying real shifts in micronaire, staple length distribution, and inherent moisture content. When the blending hall drops these fibers into automated weigh-hopper feeders, gravimetric dosing assumes a baseline mass stability that natural cotton simply does not maintain over seasonal production runs.
October cotton lots picked early in the season often show micronaire values around 3.8 to 4.0 with an incoming moisture content of 7.5 percent under standard room conditions. By January, late-season lots arrive with micronaires near 4.6 or 4.8, more trash, and fiber moisture down toward 5.5 percent after prolonged storage in dry gin warehouses. If an automated weigh-hopper meters out fifty kilograms of cotton and fifty kilograms of polyester strictly on scale weight ~ without live moisture compensation ~ the dry-weight balance breaks immediately.
The actual dry mass of cotton swings with moisture loss or gain, while zero-regain synthetic fiber stays strictly dry mass. Over a three-month continuous run, this uncompensated shift systematically skews the blend ratio of the finished yarn.
Multi-bale mixers attempt to absorb these variations by stacking fiber webs inside multi-chamber accumulation towers. Tufts drop from upper distributor aprons through vertical channels and are pulled off horizontally by bottom rollers. The problem is that density differences sort the material inside the tower.
Heavier cotton tufts settle faster than high-loft, crimped synthetic tufts. When bottom rollers pull across that vertical cross-section, the blend ratio they extract is uneven. The resulting sliver develops short-term composition waves that roll right through carding and drawing unnoticed, unless the blowroom line undergoes routine chemical testing.
Volumetric dosing magnifies these scale errors. Older blending lines often use spiked aprons and leveling rolls to meter fiber by bulk volume instead of dry weight. But synthetic staple treated with anti-static finishes changes its bulk density whenever hall temperatures or humidity shift.
A volumetric chamber set for a fixed height of polyester tufts drops less actual weight in high humidity, when synthetic crimp springs open and takes up more space per gram. Dry cotton tufts, meanwhile, compress tighter under machine pressure. The room runs under the assumption that the target ratio is stable, while the real mass fed to the transport duct changes from batch to batch.
Over a nine-month run of 50/50 polyester-cotton ring-spun yarn, a plant operated on a single laydown recipe through a ten-chamber vertical blender feeding three high-production carding lines. Early production lots tested at 50.4 percent polyester and 49.6 percent cotton by dry mass. By month six, lab testing showed the yarn had drifted to 54.2 percent polyester and 45.8 percent cotton without anyone altering the weigh-hopper setpoints.
That six-percent shift came entirely from moving from damp early-crop cotton bales to dry late-crop bales, compounded by humidity changes in an unconditioned warehouse.
Managing the bale opening line requires tight grouping based on HVI test data before fiber ever hits the feed apron. Cotton bales need sorting beyond basic color grade ~ specifically by micronaire and moisture ~ keeping total micronaire variance under 0.2 units across the entire laydown. When raw bale parameters jump around between incoming shipments, downstream blenders cannot smooth out the resulting density spikes.
The blowroom passes those mass discrepancies forward, sending raw material swings right into the card sliver.
Spinning operations frequently attribute blend drift to laboratory testing error rather than face metering problems in the blowroom. When independent test reports show a four-percent drift from spec, the discrepancy is often excused on claims that weigh-hoppers maintain plus or minus 0.5 percent tolerance and that chemical dissolution must have eroded the synthetic fiber during analysis.

Fluctuation
Air moving through galvanized steel ducting at eighteen meters per second tends to separate fiber tufts by shape and density. In a typical blowroom line, pneumatic pipes transport mixed tufts from the primary opener past cleaning rolls to the card chutes, acting essentially as an unintentional classifier. Dense cotton tufts, with a specific gravity near 1.54 grams per cubic centimeter, travel differently through turbulent air than polyester at 1.38 grams per cubic centimeter or acrylic at 1.18 grams per cubic centimeter.
Lighter synthetic fibers drag behind heavier natural fibers, concentrating specific fiber types around elbows, bends, and line splitters.
| Fiber Type | Specific Gravity (g/cm³) | Commercial Moisture Regain (%) | Staple Length (mm) | Crimp Frequency (per cm) | Aerodynamic Drag Relative Index |
|---|---|---|---|---|---|
| Upland Cotton | 1.54 | 8.50 | 28.5 to 30.0 | Natural twist | 1.00 |
| Viscose Rayon | 1.52 | 13.00 | 38.0 | 0.0 (Smooth) | 0.72 |
| Polyester (PET) | 1.38 | 0.40 | 38.0 | 4.5 to 5.5 | 1.35 |
| Nylon 6,6 | 1.14 | 4.50 | 38.0 | 3.8 to 4.2 | 1.28 |
| Merino Wool | 1.31 | 18.25 | 65.0 to 75.0 | 6.0 to 10.0 | 1.85 |
Aerodynamic drag boils down to surface crimp and cross-sectional shape. Round polyester filaments with tight crimp catch more air per gram than smooth, straight viscose fibers. When a transport duct splits into distribution chutes for six carding machines, the fiber mix reaching each card is almost never uniform.
Cards nearest the primary fan take in a higher ratio of dense cotton tufts, while downstream cards get an air stream loaded with light, crimped synthetics. Because of this spatial drift across the line, sliver cans filled at the same time in the same room carry different blend ratios.
Relative humidity fluctuations of fifteen percent inside the blowroom alter raw cotton mass sufficiently to shift final yarn composition by more than two percentage points.
Seasonal weather amplifies pneumatic separation. In unconditioned or poorly controlled mills, cold winter air increases static generation wherever fibers rub against metal ducting. Synthetics charge quickly, clinging to pipe walls and distributor plates while moisture-rich natural fibers pass right through.
Over days of production, static-bound synthetic fiber builds up on duct walls until turbulent gusts break loose whole clumps at once ~ causing sudden spikes in synthetic yarn content followed by extended dips.
- Disconnect the primary pneumatic feeder at the chute distributor interface and secure a clean collection bag over the duct outlet.
- Run the blowroom line under standard production settings for exactly ten minutes to collect a representative five-hundred-gram sample of airborne tufts.
- Condition the captured sample in a standard atmosphere of twenty degrees Celsius and sixty-five percent relative humidity for twenty-four hours.
- Perform quantitative chemical dissolution according to ISO 1833-11 to establish the baseline blend ratio delivered by the air transport system.
- Repeat the collection at the furthest card chute feeder to quantify spatial segregation along the pneumatic transport circuit.
Mismatched moisture regain distorts the mass calculations underlying blend specs. Standard commercial regain for cotton is 8.5 percent, while polyester sits at 0.4 percent, viscose at 13.0 percent, and wool at 18.25 percent. In humid summer conditions, a hundred-kilogram batch of raw cotton can hold eight and a half kilograms of water.
In dry winter air, that same dry weight of cotton carries only four kilograms of water. A mill dosing by scale weight without tracking live moisture under-delivers solid cotton in humid months and over-delivers it when conditions dry out, driving steady composition drift through the year.
During a seasonal transition from monsoon humidity to dry winter air, sliver sampled behind a third breaker drawing head over twelve weeks showed polyester climbing from 64.8 percent to 68.3 percent in a nominal 65/35 polyester-viscose yarn spec. The volumetric feeder settings were never adjusted. The drop in ambient humidity stripped moisture weight from the viscose, shifting the dry mass ratio of the sliver without triggering an alarm on the line.
This presents a quiet risk for mills making two- or three-fiber blends close to trade threshold limits. If a contract calls for a minimum of 60 percent cotton to clear a regional trade agreement, a three-percent seasonal drift drops delivered fabric to 57 percent. Customs testing labs evaluate imports on an oven-dry basis after scouring, leaving buyers exposed to sudden tariff reclassifications and fines originating entirely from unmanaged air conditions in the supplier’s blending room.
What structural modifications to pneumatic duct geometry and air-velocity control systems are necessary to prevent aerodynamic density segregation when transporting high-difference fiber blends over long distances?


Extraction
Verifying yarn shipments in the lab depends on quantitative chemical dissolution governed by ISO 1833 standards. Determining exact blend percentages requires selectively dissolving one fiber type while leaving the other untouched, weighing mass loss to four decimal places. For polyester-cotton blends, ISO 1833-11 calls for seventy-five percent sulfuric acid at room temperature to dissolve cellulosic cotton, leaving behind the insoluble polyester.
Accuracy depends completely on maintaining solvent concentration, timing, temperature control, and applying proper correction factors for mild fiber erosion.
Thorough pre-treatment is necessary before applying any chemical reagent. Yarns and fabrics carry non-fibrous additives ~ paraffin waxes, spin finishes, sizing agents, and lubricants ~ that make up one to five percent of total dry mass. If an analyst skips Soxhlet extraction with petroleum ether, those additives dissolve in the reagent or wash out during rinsing.
The scale registers that lost weight as dissolved fiber, artificially bumping up the reported percentage of the soluble component.
Contracts utilizing ISO 1833 testing protocols must explicitly mandate pre-treatment solvent extraction and specify whether final figures reflect oven-dry mass or commercial mass including standard regain allowance.

How Does Dissolving Pulp Origin Distort Chemical Extraction Results?
Cellulosic fibers made from eucalyptus wood react differently to zinc chloride reagents than those made from softwood pulps. Viscose, modal, and lyocell share the same chemical formula as cotton, but their crystalline structure and chain length are quite different. In cotton-viscose or cotton-lyocell blends tested under ISO 1833-3 (formic acid and zinc chloride), the reagent dissolves regenerated cellulose and leaves raw cotton intact.
However, regenerated cellulose from low-molecular-weight pulp breaks down faster than high-tenacity modal, while unbleached cotton suffers surface loss if left in the solvent past standard dwell times.
The correction factor, written as d in ISO 1833 formulas, offsets small weight losses from insoluble fibers exposed to the reagent. For clean, oriented polyester in seventy-five percent sulfuric acid, d is usually 1.00. For cotton in formic acid and zinc chloride, d runs between 1.01 and 1.03 depending on mechanical wear, bleaching depth, and mercerization.
When a lab uses a default correction factor of 1.00 on heavily treated or damaged natural fiber, the calculation overstates the dissolved portion by up to two percent ~ creating a paper ratio error that never occurred on the spinning frame.
| Method Standard | Blend Components | Selective Solvent / Reagent | Test Temp (°C) & Time | Insoluble Residue | Correction Factor d |
|---|---|---|---|---|---|
| ISO 1833-3 | Cotton / Viscose | Formic acid / Zinc chloride | 40 °C for 15 min | Cotton | 1.02 |
| ISO 1833-7 | Polyamide / Wool | 80% Formic acid | 20 °C for 15 min | Wool | 1.01 |
| ISO 1833-11 | Polyester / Cotton | 75% Sulfuric acid | 50 °C for 60 min | Polyester | 1.00 |
| ISO 1833-12 | Acrylic / Wool | Dimethylformamide (DMF) | 80 °C for 10 min | Wool | 1.01 |
| ISO 1833-16 | Polypropylene / PET | Boiling Xylene | 138 °C for 30 min | Polyester | 1.00 |
Inter-lab variations complicate tracking blend stability over time. When two accredited labs test samples cut from the exact same meter of fabric, results often differ by 1.0 to 1.5 percentage points. Differences in oven efficiency, desiccator cooling periods, and balance calibrations drive these gaps.
Official procedures require drying samples at one hundred five degrees Celsius to constant mass ~ meaning less than 0.1 percent weight change between weighings fifteen minutes apart. Cutting corners on oven time leaves moisture in the fiber, throwing off the initial dry weight baseline.
- Incomplete finish extraction leaves hydrophobic spinning lubricants on the fiber surface, preventing complete solvent penetration during the chemical dissolution step.
- Reagent temperature drift during sulfuric acid digestion causes partial depolymerization of insoluble polyester, inflating calculated natural fiber content.
- Inadequate rinsing stages fail to wash residual dissolved polymers from the filter crucible, leaving heavy residues that artificially increase the recorded dry mass of the insoluble residue.
- Desiccator saturation allows room moisture to absorb into hot dried fiber samples prior to analytical weighing, corrupting the true dry mass calculation.
- Incorrect correction factor selection applies clean raw-fiber d-values to chemically modified, dyed, or resin-treated bulk fabrics.
Comparison of mill lab reports against independent test certificates across a five-hundred-ton yarn order showed the plant lab consistently reporting polyester content 1.2 percent higher than the outside accredited facility. An audit revealed that mill staff had cut oven drying times from four hours to forty-five minutes and skipped desiccator cooling altogether, placing hot crucibles right onto the analytical balance. Thermal updrafts inside the balance chamber lifted the pan slightly, artificially lightening the recorded weight of the polyester residue and corrupting the blend calculation.
Physical testing methods, like cross-sectional fiber counts under ISO 137, offer non-destructive checks but introduce significant statistical noise. Counting five hundred cross-sections under a microscope yields wide margins when evaluating fibers with irregular shapes or broad diameter ranges like wool and cotton. Hand separation under magnification works fine on continuous filament yarn or coarse long-staple wool, but breaks down entirely on short-staple ring-spun yarns where fibers are tightly twisted at thirty turns per inch.
Purchase contracts should specify ISO 1833-11 as the sole governing method for polyester-cellulosic blends, setting an absolute tolerance limit of plus or minus 1.5 percentage points from declared specs. Claims regarding blend drift ought to be verified by an accredited lab running dual Soxhlet pre-extracted tests, with values calculated strictly on an oven-dry basis corrected for official commercial regain rates.

Comb
Carding cylinders spinning at four hundred revolutions per minute comb short fibers out of the primary web. This mechanical processing treats fibers in an intimate blend differently depending on staple length and flexural stiffness. When a mixture of thirty-two millimeter cotton and thirty-eight millimeter polyester passes over the main cylinder, card wire transfers longer polyester fibers to the doffer while throwing shorter cotton fibers into the flat strip bin.
Waste extraction systems on high-speed cards continuously remove flat strips, taker-in droppings, and filter waste, steadily altering the ratio of fiber carried forward into sliver.
Analyzing flat strip waste reveals this mechanical sorting clearly. On a card running a nominal 50/50 cotton-polyester blend, chemical testing of flat waste generally shows 70 to 80 percent cotton and only 20 to 30 percent polyester. Because the card preferentially ejects shorter natural fibers, the web coming off the doffer carries a higher synthetic fraction.
When a raw cotton batch has variable short fiber content (SFC), the card’s waste extraction rate changes on the fly ~ shifting the output sliver blend even if blowroom weigh-hoppers deliver a perfectly uniform feed.
Licker-in speeds and grid bar settings directly govern how far the blend shifts. High licker-in speeds deliver harsh impacts that break delicate natural fibers, producing short lint that falls into the under-card waste pit. Synthetics, with greater tenacity and stretch, handle carding without breaking.
When a mill speeds up carding to hit volume targets, increased mechanical stress ejects more natural fiber into waste streams, pushing the emerging sliver further toward synthetic enrichment.
Selective fiber removal in high-speed carding strips natural short staples faster than synthetic filaments, enriching the output sliver with synthetic content.
Drawframe blending bypasses blowroom mixing but brings its own mechanisms for blend drift. Here, pure cotton slivers and pure synthetic slivers feed into the drafting zone together. A 50/50 mix combines three cotton and three polyester slivers side-by-side through a 4-over-3 drafting head.
If a cotton sliver snaps or runs empty and a stop-motion sensor fails to trip, the head keeps drafting five slivers ~ instantly changing output composition to 60 percent synthetic and 40 percent natural for dozens of meters before anyone notices.
Drafting waves in the drawframe cause localized blend variations as well. Roller drafting relies on precise friction between top rubber cots and fluted bottom steel rolls. Fibers with different surface friction draft unequally under the same nip pressure.
Polyester with smooth spin finishes glides more easily under draft than waxy, crimped cotton. That gap in drafting force creates repeating thick and thin spots loaded with one fiber type, producing long blend waves along the sliver that show up as horizontal barré or streakiness in dyed knits.
Hourly sampling of sliver behind an auto-leveling drawframe across an eighteen-hour shift showed that while total sliver mass remained uniform under auto-leveler draft corrections, the internal blend ratio swung between 48.2 percent and 53.7 percent polyester. The auto-leveler maintained uniform mass by altering draft, but had no way of sensing that incoming weight changes were caused by individual sliver variation between the synthetic and natural supply cans.
Keeping mechanical separation under control during carding and drafting requires tight maintenance on wire clothing, flat settings, and cot hardness. Dull card wire loses traction on synthetic fibers, changing doffing efficiency and altering the mix on the web. Routine audits of flat strip weight and fiber breakdown signal mechanical blend problems long before ratio errors show up in finished yarn tests.
In intimate blending systems, short fiber content variations in the natural raw component alter waste extraction rates at the carding wire, systematically driving final yarn composition away from blowroom dosing targets.
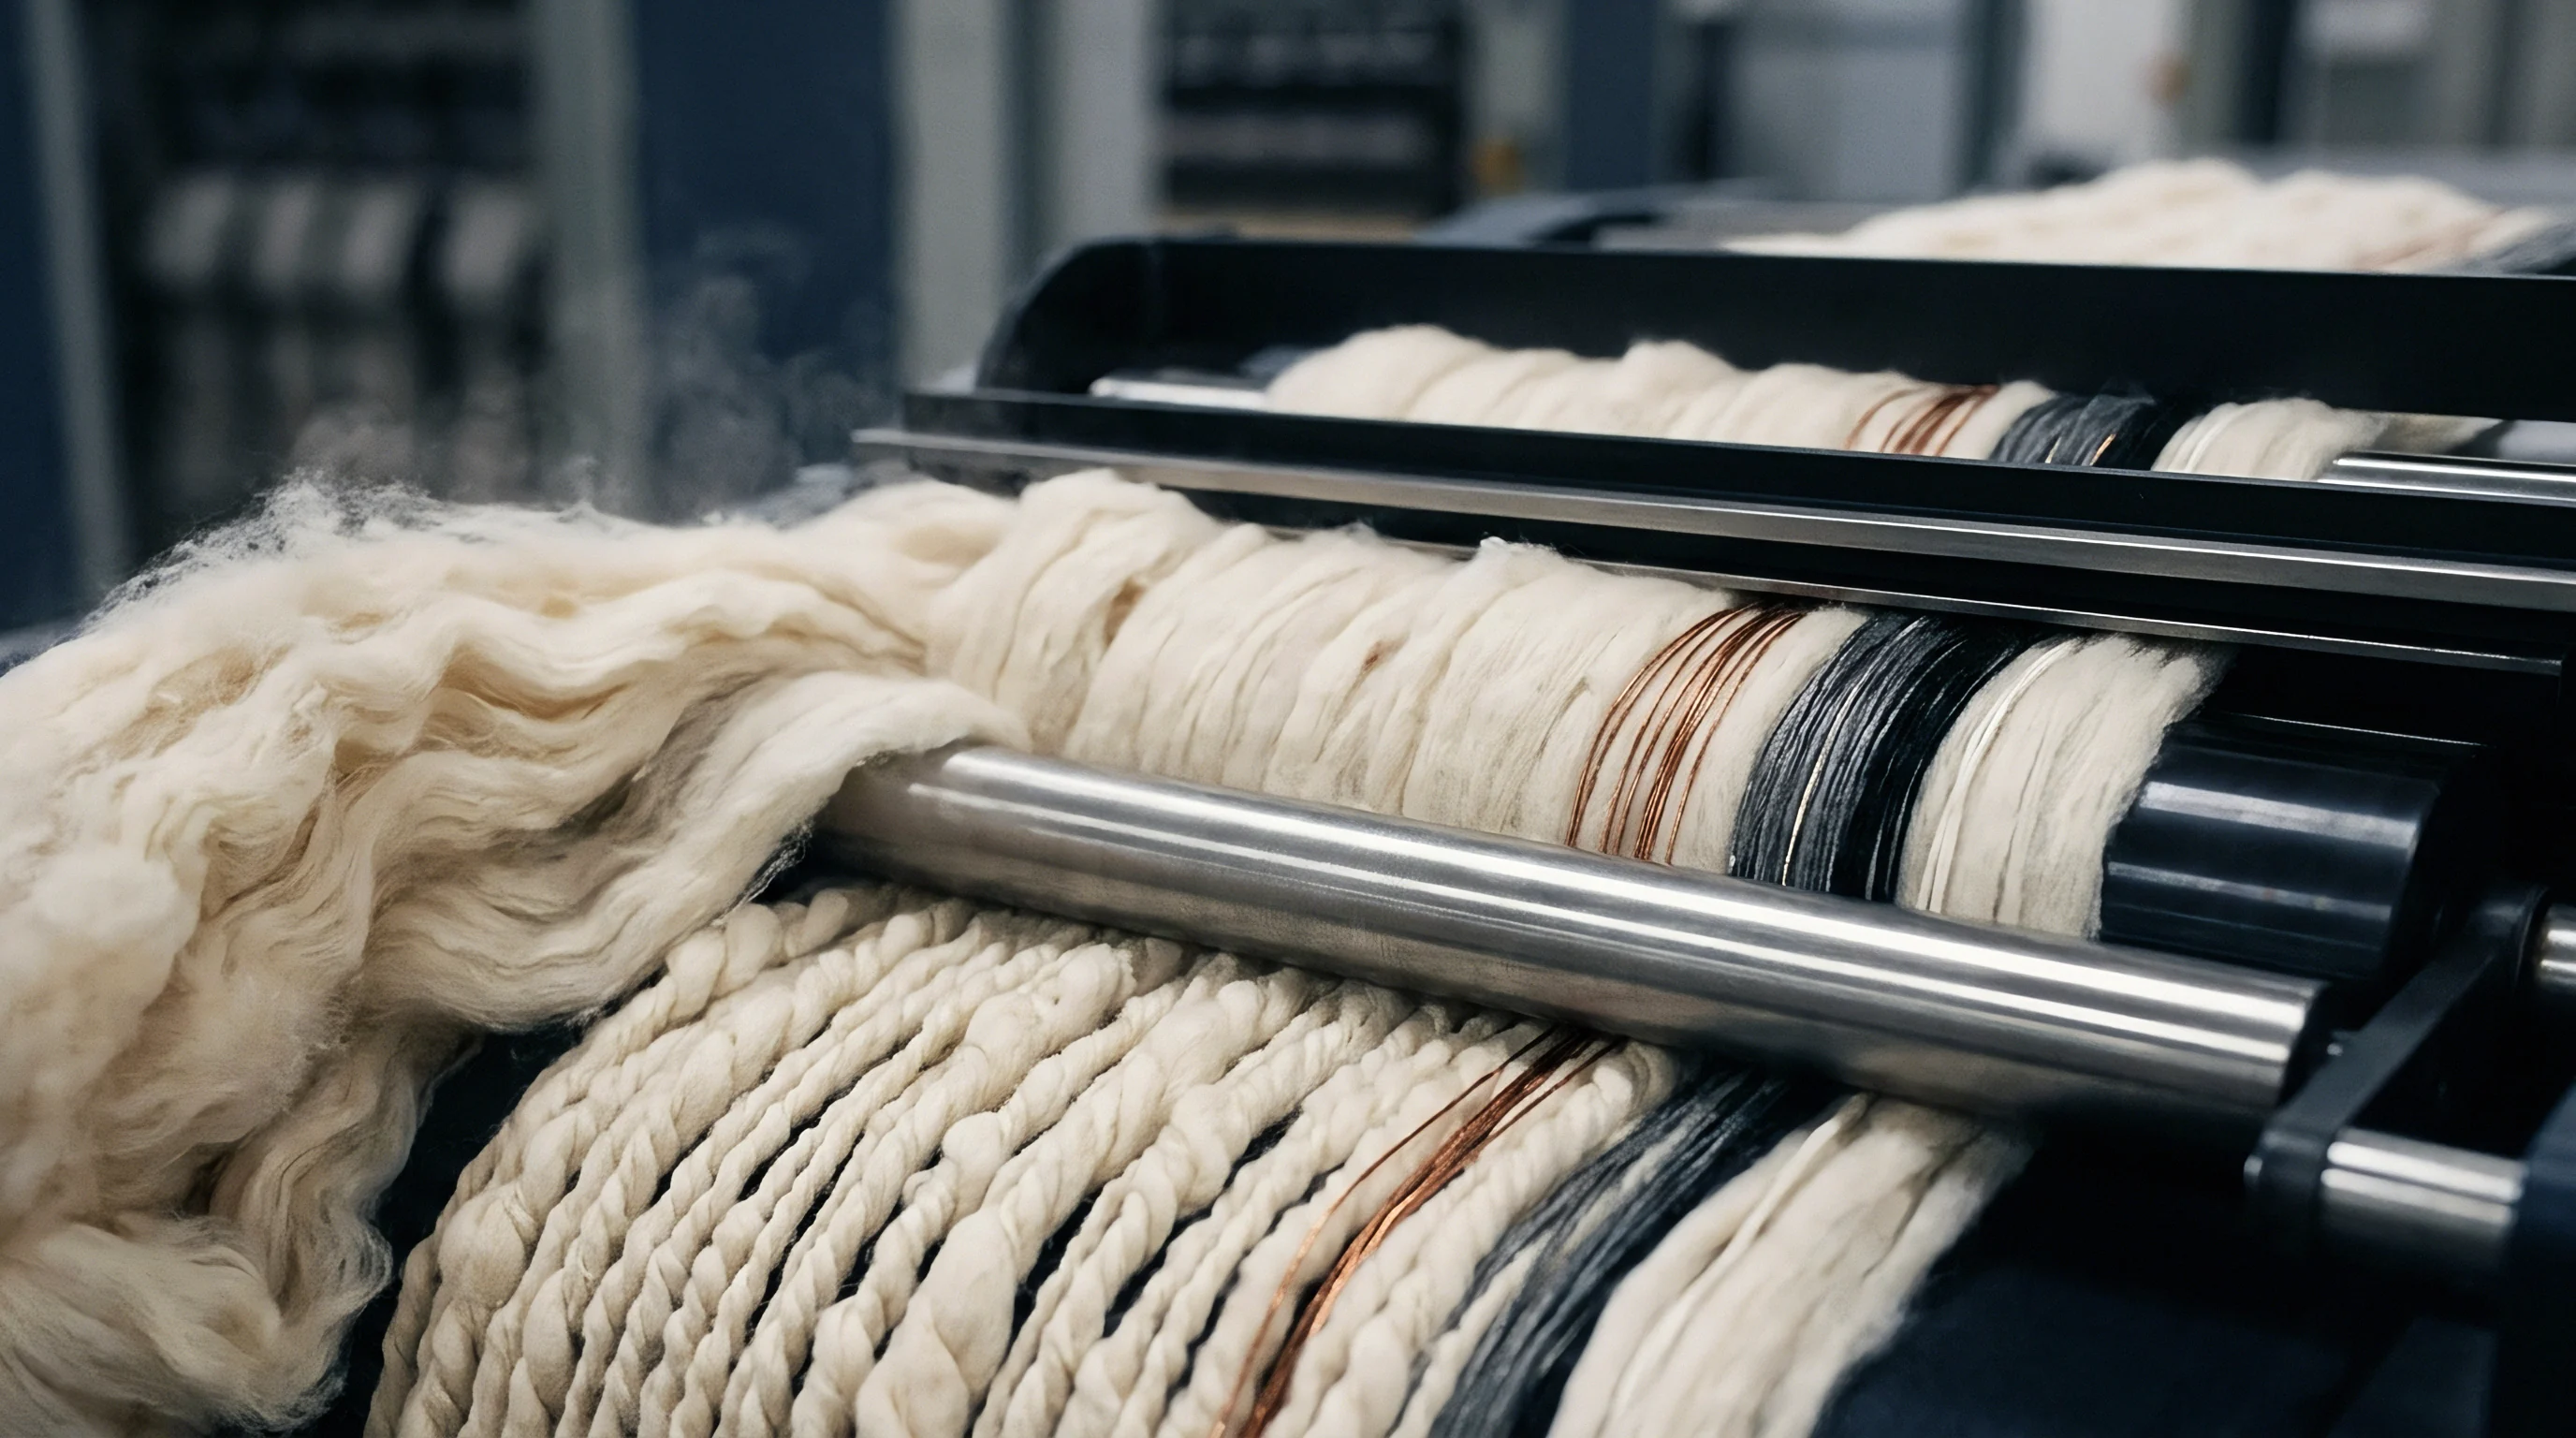
Discrepancy
Customs agencies classify imported spun yarns by predominant fiber weight on an oven-dry basis under Harmonized System rules. Under HS Chapter 52 (Cotton) and Chapter 55 (Man-made Staple Fibers), tariff rates jump significantly across the 50 percent threshold. Yarn declared as 52 percent cotton and 48 percent polyester falls under HS heading 5205, clearing at preferential duty rates under trade agreements.
If customs testing finds the yarn actually holds 49.5 percent cotton and 50.5 percent polyester due to uncorrected blending room drift, border officials reclassify the cargo under HS heading 5509, slapping high non-preferential duties and misdeclaration fines on the shipment.
| Declared HS Code | Actual Lab Composition | Reclassified HS Code | Base Duty Rate Shift | Penalty Fine Rate | Landed Cost Impact per Container |
|---|---|---|---|---|---|
| 5205.22 (Cotton >= 85%) | 83.2% Cotton / 16.8% PET | 5206.12 (Cotton < 85%) | 0.0% to 6.5% | 10% duty value | 18,400 USD |
| 5209.42 (Denim Cotton dominant) | 48.5% Cotton / 51.5% PET | 5514.22 (Polyester dominant) | 4.2% to 12.0% | 25% shipment value | 42,000 USD |
| 5509.21 (PET >= 85%) | 83.8% PET / 16.2% Rayon | 5509.51 (PET mixed with Rayon) | 5.0% to 8.0% | 15% duty value | 21,500 USD |
| 5107.10 (Wool >= 85%) | 82.1% Wool / 17.9% Nylon | 5107.20 (Wool mixed with Synthetic) | 3.5% to 14.5% | 50% duty value | 68,000 USD |
Chief weight rules govern trade origin for finished clothing as well. Under yarn-forward or double-transformation rules, garments qualify for tariff exemptions only when yarn components meet strict composition limits. A factory importing fabric ordered at 55 percent linen and 45 percent cotton counts on linen dominance for trade preference.
If seasonal drift drops linen content to 48 percent, the whole shipment loses origin status. Tariffs jump from zero to over twenty-six percent at import, wiping out operating margins on the spot.
Commercial misdeclaration penalties apply regardless of whether blend ratio drift resulted from intentional fiber substitution or uncompensated environmental variations in the mill blending room.
Rejected fabric shipments present another major financial hazard caused by ratio drift. Color fastness, dye uptake, and shrinkage respond directly to fiber blend changes. Cotton and polyester need totally different dye classes ~ reactive dyes for cotton and disperse dyes for polyester.
A dye house sets up chemical formulas and heating cycles for a strict 50/50 mix. When fabric woven from drifted 58/42 yarn goes through the dye line, the fixed recipe over-dyes one fiber and under-dyes the other, creating severe side-to-center shade bands, streakiness, and failed wash tests.
- Audit incoming bale laydown records to verify that micronaire and moisture distributions are constrained within agreed tolerance windows across production cycles.
- Mandate dual-testing protocols using ISO 1833 chemical dissolution on raw yarn packages prior to weaving or knitting.
- Establish contractual tolerance thresholds of plus or minus 1.5 percentage points with automated financial debit clauses for out-of-spec shipments.
- Require mill verification of continuous weigh-hopper calibration using real-time inline moisture compensation sensors.
- Include mandatory customs tariff reclassification indemnification clauses in all raw material supply contracts.
Commercial contracts often use vague composition terms that leave buyers vulnerable to seasonal drift. Purchasing specs reading “50/50 Poly/Cotton” without clarifying whether the ratio means raw scale weight, dry mass, or commercial regain invite trade disputes. A supplier acting in good faith can ship yarn measuring exactly 50/50 on their scale, only for tests in the destination country to show 53/47 under standard atmosphere owing to moisture regain differences.
An importer incurred fifty-four thousand dollars in unexpected customs surcharges when a port laboratory reclassified three containers of trouser twill after tests showed cotton content had slipped from a declared 52 percent down to 49.1 percent. The drop traced back to dry late-crop bales at the spinning mill, but internal blowroom logs showed nominal equal weigh-hopper settings, leaving the discrepancy attributed to moisture loss in transit. Because the sales contract lacked an explicit dry-mass ISO 1833 guarantee clause, the buyer absorbed both the tariff adjustment and the associated penalties.
Sourcing teams need to calculate landed costs against worst-case tariff thresholds when ordering blends near regulatory cliffs. If a 50/50 target sits right on the border of a tariff bump at 49.9 percent, the buyer should mandate a target of 53 percent for the protected fiber. That safety margin absorbs typical seasonal drift in the blending room without pushing finished goods across costly tariff boundaries.

Calibration
Preventing composition drift over long production runs requires continuous feedback between online weigh-feeders and offline lab analysis. Automatic bale openers and weigh-hoppers should be fitted with near-infrared (NIR) moisture sensors positioned over the feed aprons. These sensors track incoming moisture levels continuously, sending live data straight to the weigh-hopper control PLC.
The system adjusts target drop weights on the fly, making sure every batch dropped into the mixing channel delivers a constant dry mass regardless of raw material moisture changes.
Statistical process control (SPC) charts ought to track blend ratios through every lot transition. Mills should sample three yarn packages per spinning frame every twenty-four hours, using fast chemical extraction or calibrated NIR spectroscopy. Plotting the daily moving average of synthetic content on a Shewhart chart with control limits set at plus or minus 1.0 percentage point from spec allows engineers to catch drift well before yarn exceeds commercial limits.
A five-day trend drifting toward a limit line calls for immediate weigh-hopper recalibration or laydown adjustments.
- Traceable bale laydown plans detailing HVI micronaire, staple length, and moisture measurements for every lot in the active mix.
- Daily gravimetric weigh-hopper calibration logs certified by quality control technicians.
- Continuous hall temperature and relative humidity recordings covering the entire spinning and storage environment.
- ISO 1833 third-party test reports for every ten metric tons of yarn produced under the contract.
- Inline sliver mass uniformity records captured by drawframe auto-leveler monitoring systems.
Writing watertight RFQ terms means shifting financial liability for blend drift back to the spinning mill. Procurement contracts must define blend targets with hard mathematical boundaries, rejecting vague trade phrases like “subject to commercial variation.” Terms should explicitly state that all composition figures will be calculated on an oven-dry mass basis corrected for official regain under ISO 6741, using ISO 1833 chemical dissolution as the governing test method.
A tight procurement clause sets exact price deductions for out-of-spec shipments. If a contract mandates 60 percent cotton and 40 percent polyester with an agreed tolerance of plus or minus 1.5 percentage points, any lot testing between 58.5 and 61.5 percent cotton clears without penalty. A lot testing between 57.0 and 58.4 percent cotton triggers an automatic two percent discount on the invoice.
Any lot falling below 57.0 percent cotton gives the buyer the right to reject the shipment outright, with the supplier covering all return freight, re-testing costs, and customs penalties.
Enforcing these controls creates clear transparency across the supply chain. When a mill knows every shipment faces quantitative lab screening backed by enforceable penalty clauses, quality managers maintain strict oversight on bale selection, blowroom dosing, and plant humidity. The buyer eliminates tariff risks, gets consistent dyeing performance, and keeps landed costs stable throughout the crop year.