Gravimetric Conversion Errors in Optical Fiber Diameter Distribution Analysis
Gravimetric conversion of optical fiber distributions distorts blend mass by squaring diameter tails, misreading ellipticity, and ignoring medullary voids.


Prism
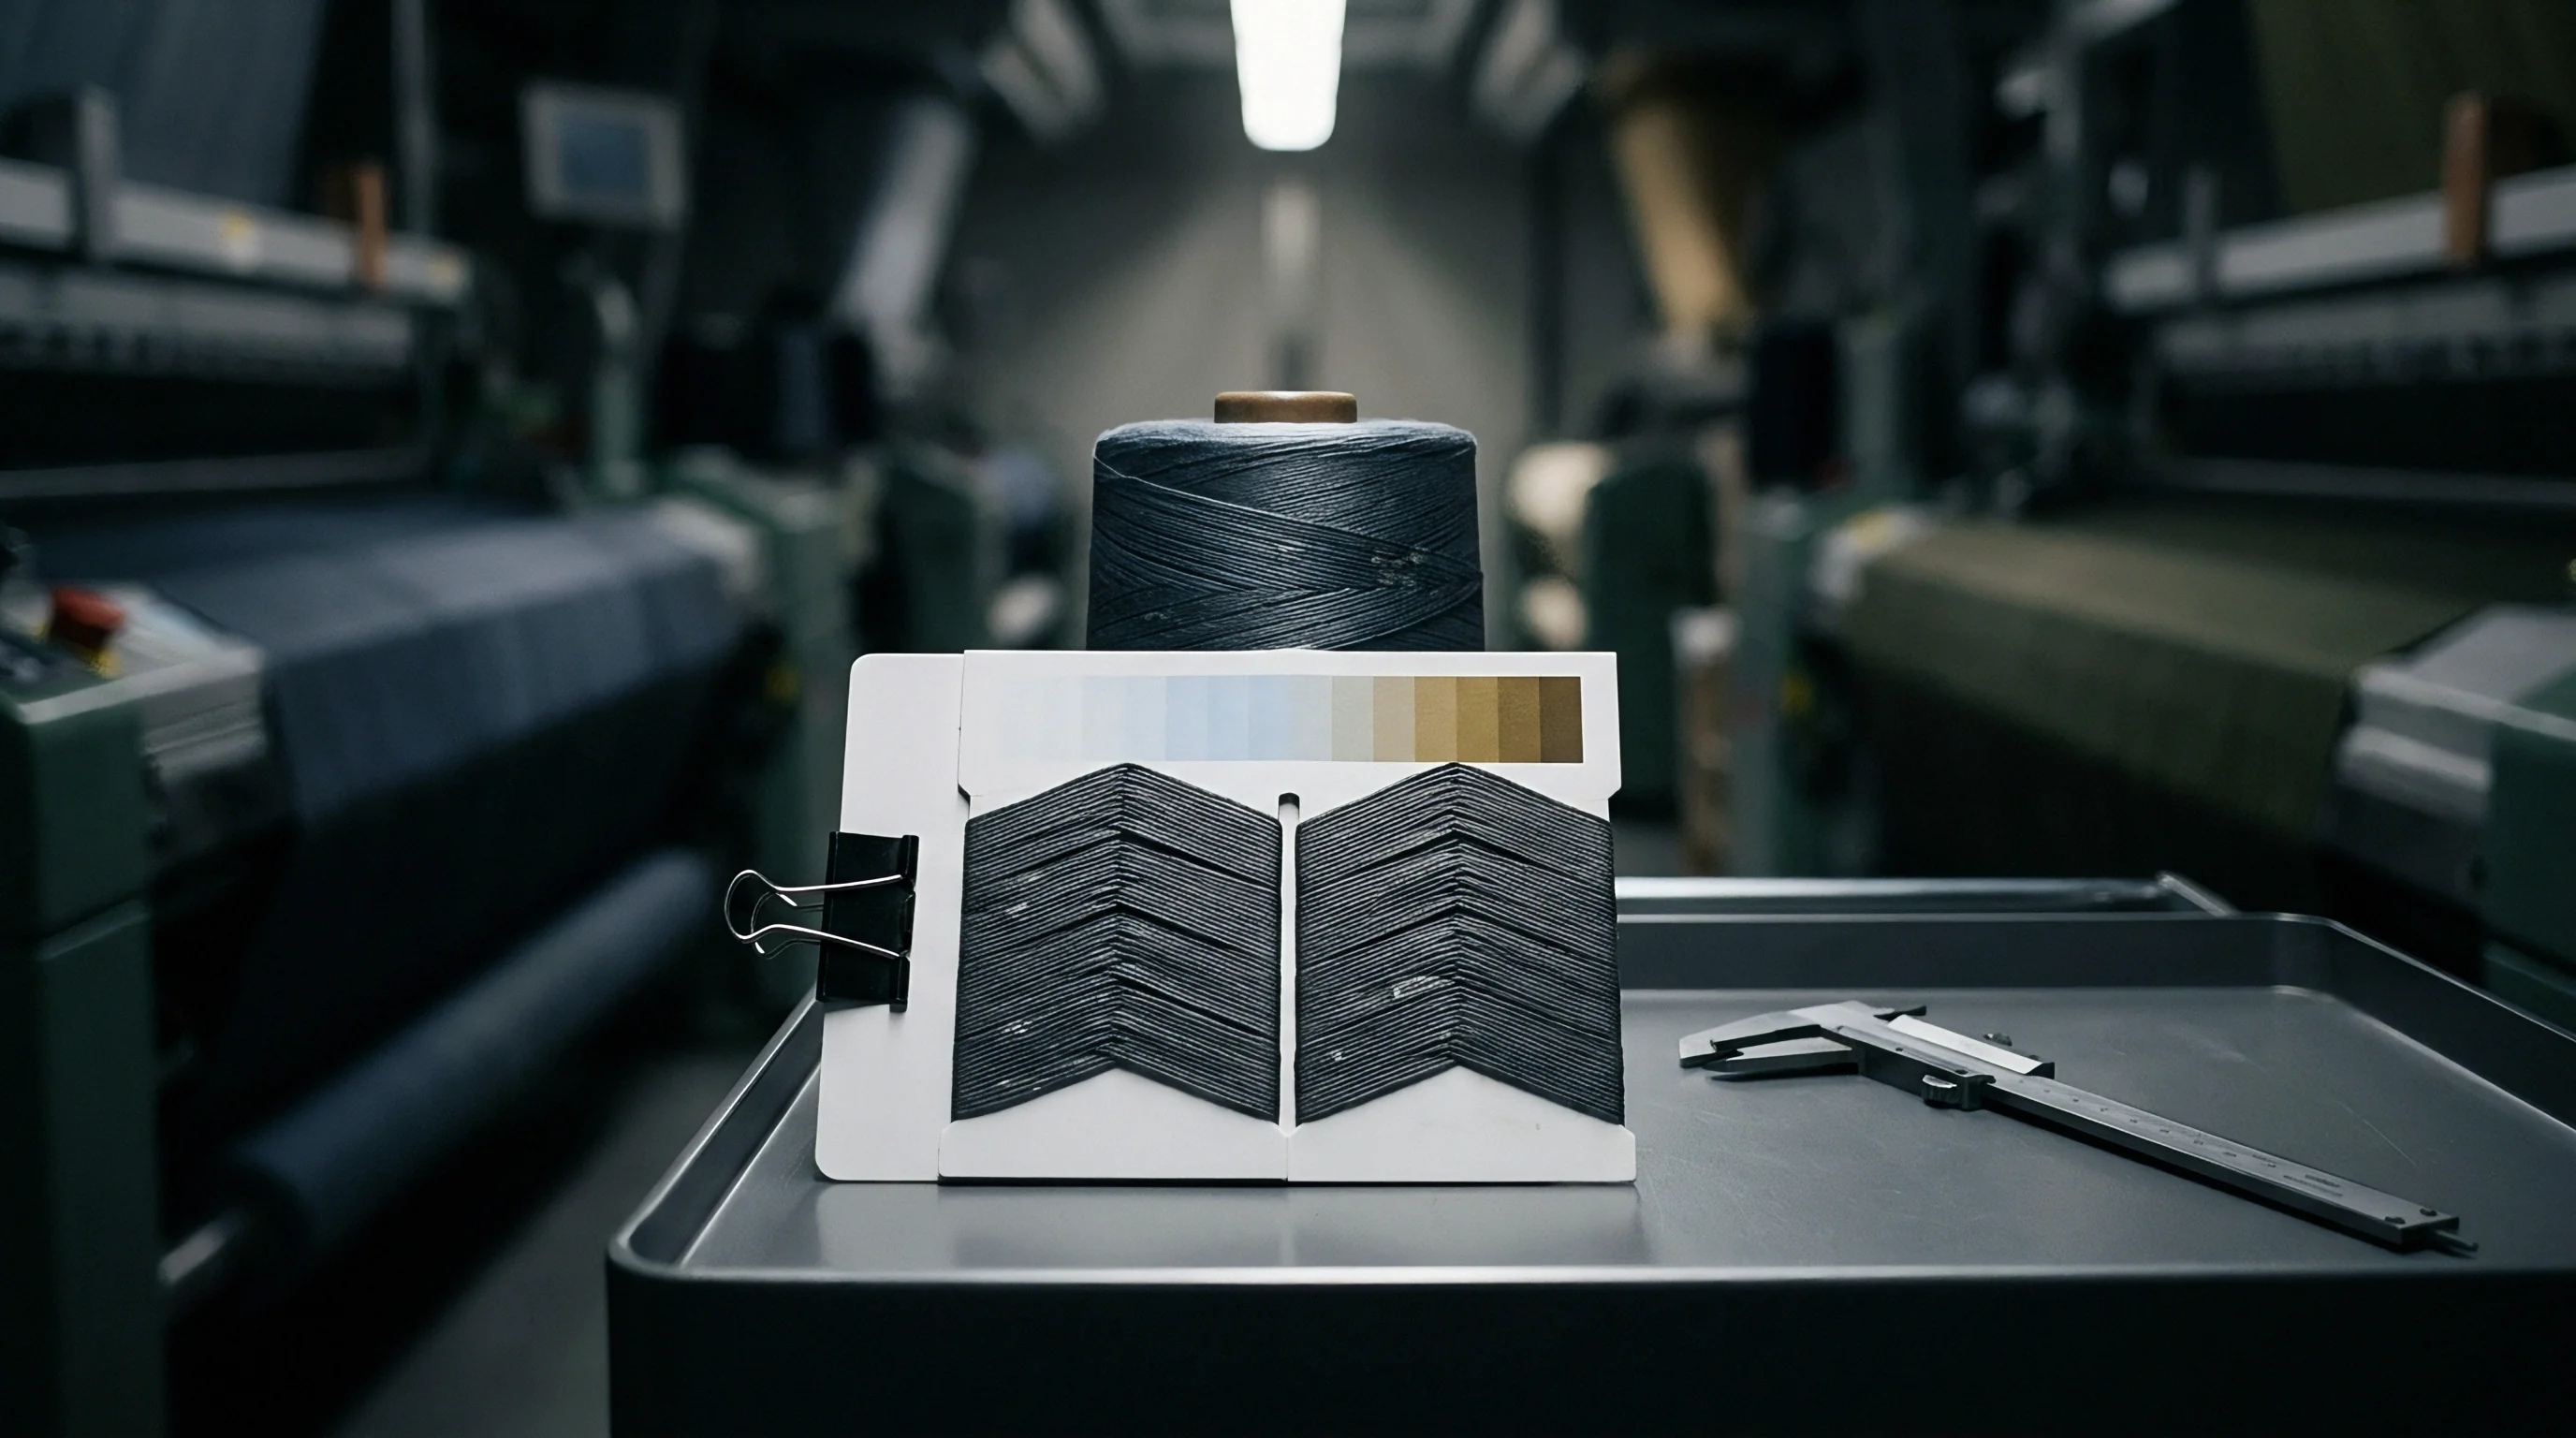
Number Distributions against Mass Distributions
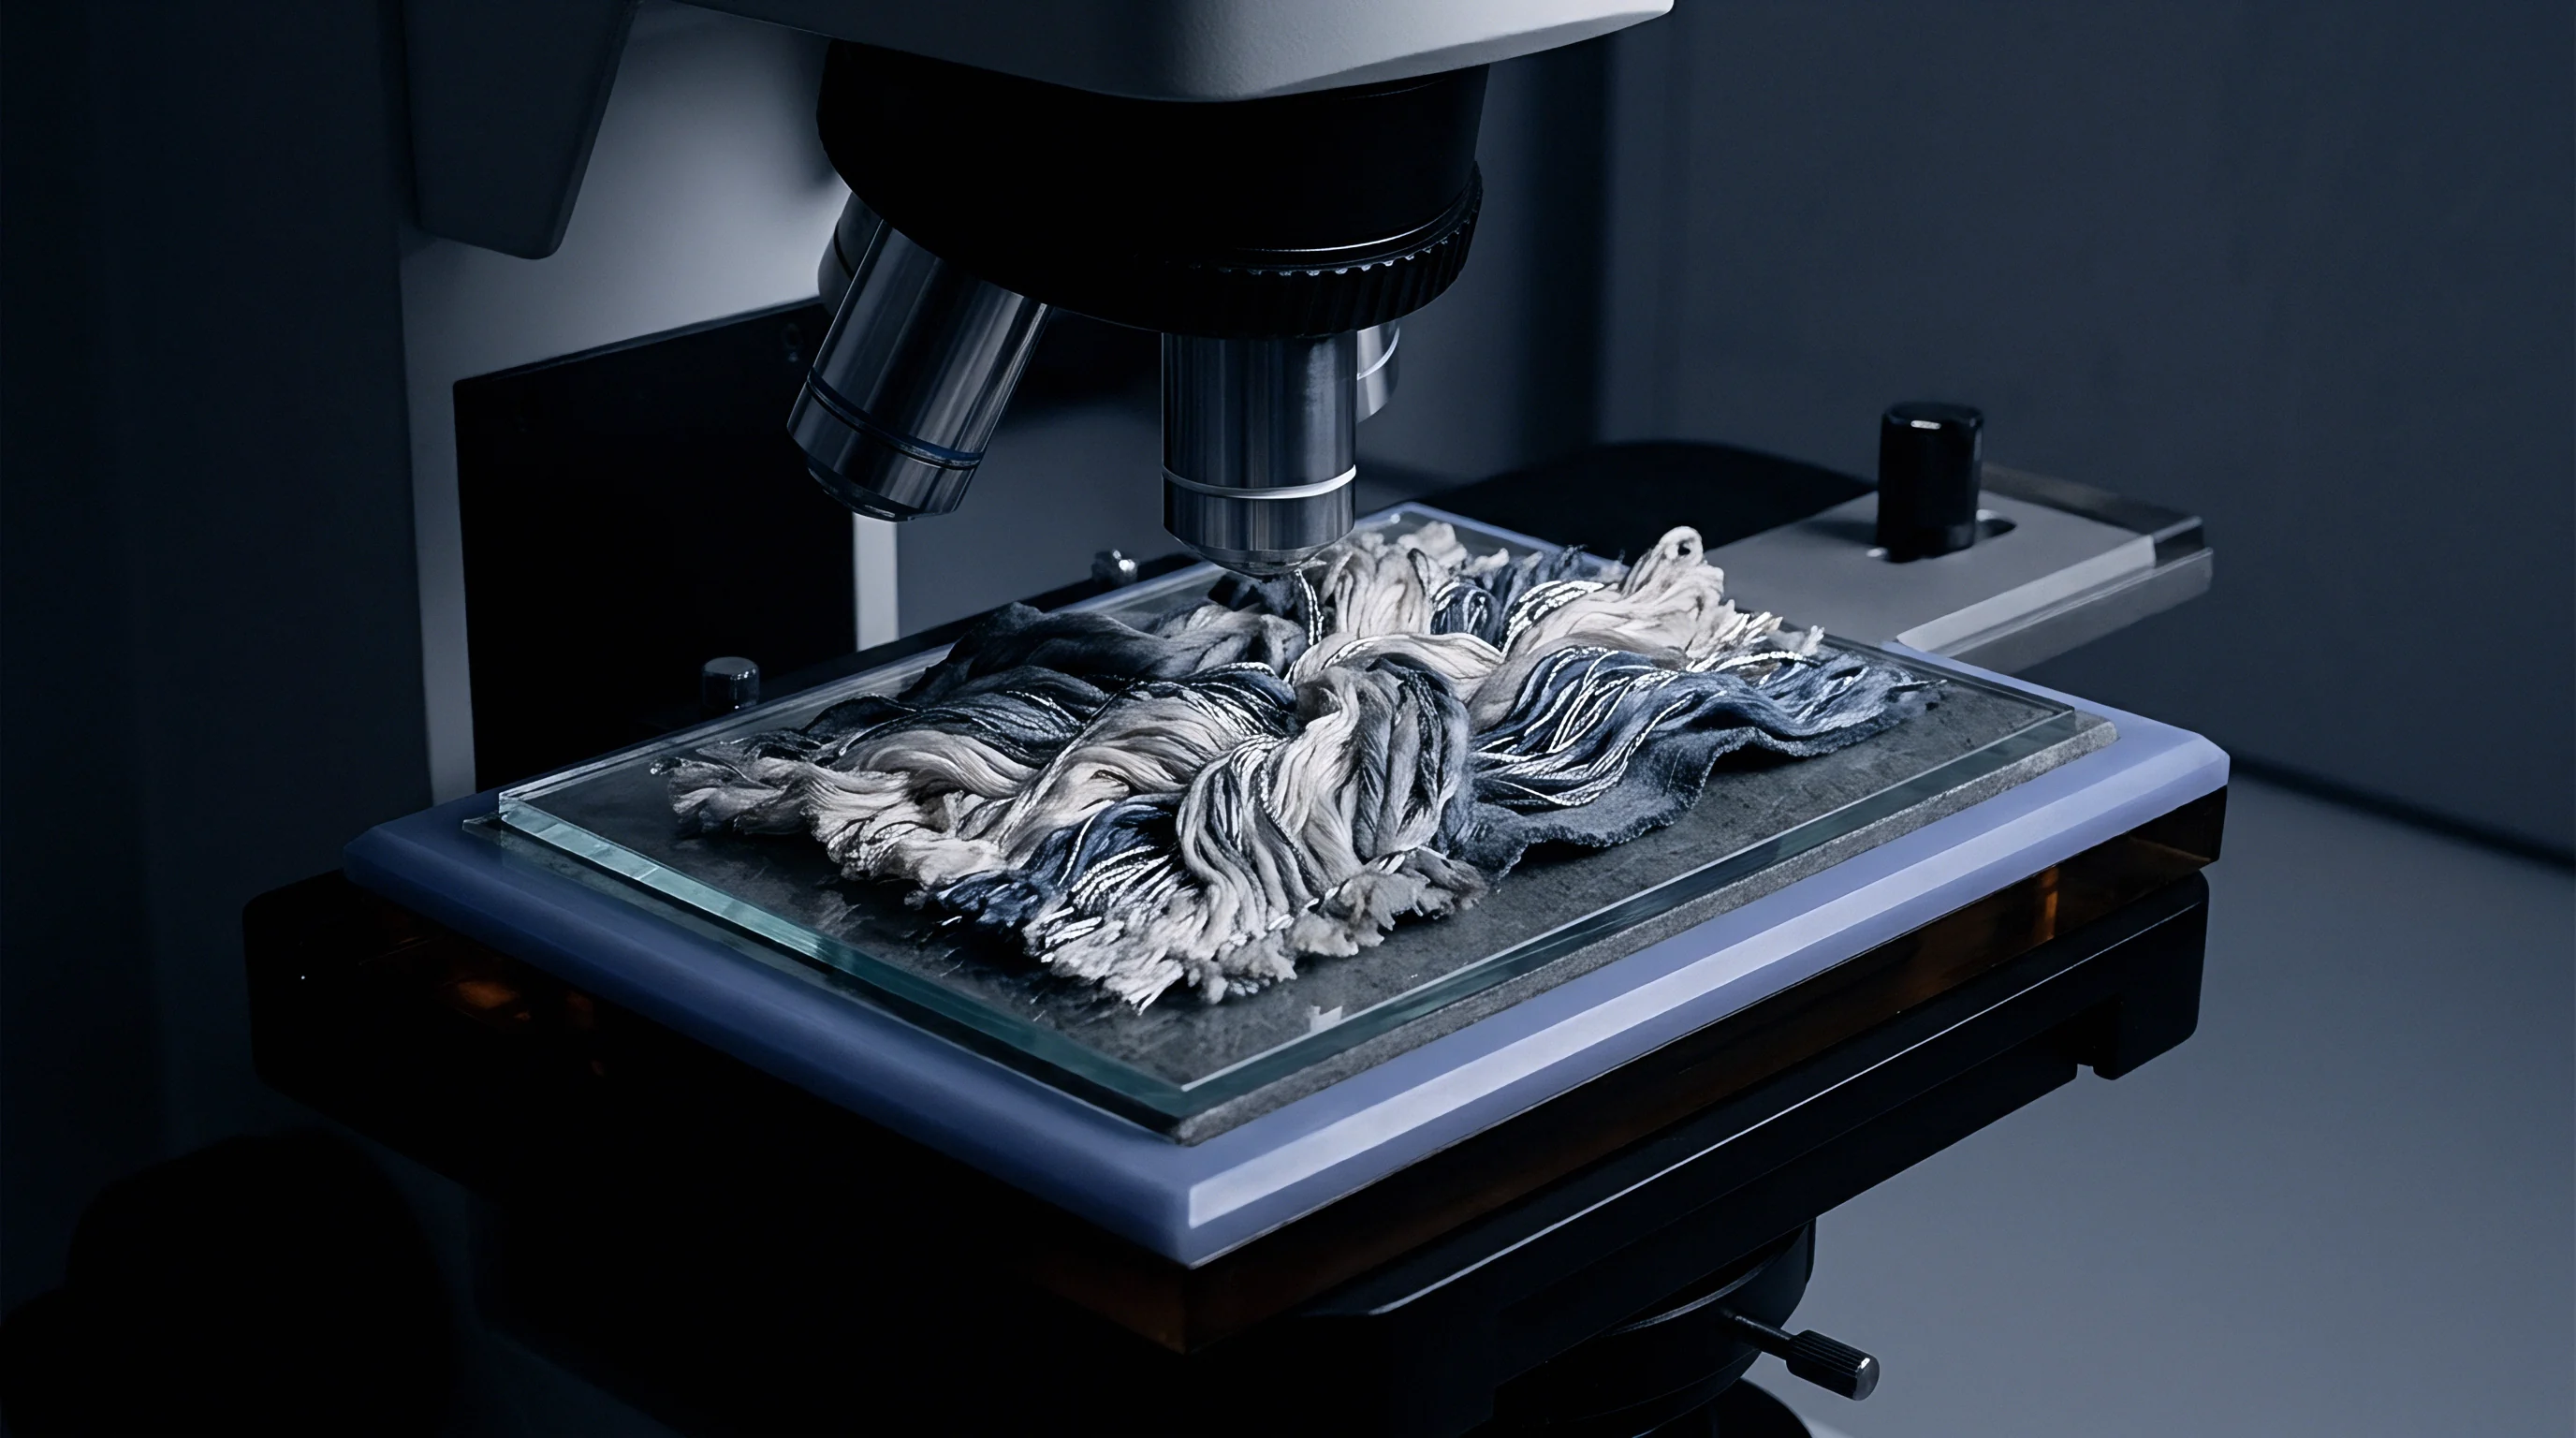
Optical instruments measure fiber fragments by count. Automated optical projection systems, image-analysis benches, and scanning flow cells capture individual silhouettes across thousands of snippets, recording two-dimensional widths to build a numerical frequency distribution. That optical count yields a number-average diameter.
Commercial contracts, customs declarations, and spinning blend ratios run entirely on mass. Converting an optical diameter distribution into a gravimetric equivalent requires a volumetric transformation multiplied by fiber density. Each measured diameter snippet is squared to approximate cross-sectional area, multiplied by an assumed uniform snippet length, and scaled by solid polymer density.
The mathematical consequence of this squared transformation is an immediate upward skew. Coarser fibers carry mass proportional to the square of their diameter. A single twenty-eight-micrometer fiber fragment contains four times the mass of a fourteen-micrometer snippet of identical length and specific gravity.
Any minor tail in the optical coarse distribution exerts a disproportionate leverage over the calculated gravimetric percentage. When optical diameter data undergoes conversion without correction for diameter-dependent length bias, shape circularity, or density variance, the derived mass percentages diverge sharply from chemical separation standards.
Acceptance testing on high-value animal fibers and luxury blends exposes this divergence directly. A cashmere lot containing two percent by count of coarse guard hair or fine sheep wool will show a gravimetric contamination figure between six and ten percent under uncorrected mathematical transformation. International trade tolerances do not accommodate that spread.
Customs tariff line 5102.11 for fine animal hair demands verifiable mass quantification, penalizing shipments whose paperwork confuses number-weighted optical counts with legal mass declarations.
Under uncorrected square-power transformation, an optical coarse tail of two percent by count doubles its gravimetric mass representation in the blend ledger.
Standard test methods govern these optical procedures. IWTO-47 outlines diameter measurement by optical fiber diameter analyzer instruments. ASTM D2130 defines projection microscope procedures.
ISO 137 sets the international baseline for wool fiber diameter determination by projection microscope. None of these primary standards endorse a direct, unadjusted conversion from optical frequency distributions to statutory mass percentages. Mills frequently attempt this shorthand conversion to bypass destructive chemical dissolution under ISO 1833 or mechanical dehairing assays.
The resulting conversion error generates contract rejections, customs misclassification penalties, and yarn count irregularities before the first roving enters a ring frame.
The mathematical conversion assumes three physical constants across every analyzed snippet. It assumes every snippet shares the identical length cut by the guillotine. It assumes every fiber cross-section forms a perfect circle.
It assumes density remains invariant across fine and coarse fractions within the blend. When working with natural animal fibers, regenerated cellulosics, or bicomponent synthetics, all three assumptions fail simultaneously.


Ellipticity

Cross Sectional Geometry Distortions
Projected fiber silhouettes present only one dimension to an optical sensor. Natural fibers, including wool, alpaca, silk, and specialty animal hairs, possess elliptical or irregular cross sections rather than round cylinders. When an automated optical stage deposits snippets onto a glass slide, the fragments orient themselves mechanically.
Fibers settle with their major transverse axis resting flat against the glass surface. The optical sensor observes this widest silhouette, systematically overestimating the true mean diameter.
The eccentricity of the fiber cross section directly determines the magnitude of this optical overestimation. Wool fibers display mean ellipticity ratios between 1.15 and 1.25, defined as the ratio of the major axis to the minor axis. Cashmere displays lower ellipticity, typically between 1.10 and 1.18.
Cultivated mulberry silk produces triangular cross sections, while tussah silk and mature cotton form flat ribbons with aspect ratios exceeding 2.0. When an optical instrument measures only the settled major diameter and calculates cross-sectional area assuming a circular boundary, the calculated area exceeds the actual area by a factor tied directly to that axis ratio.
Calculating gravimetric mass from this inflated area compounds the error across the entire distribution. If a lot contains both high-ellipticity fibers and low-ellipticity fibers, the optical instrument exaggerates the mass share of the high-ellipticity component. In a blend of merino wool and specialty alpaca, the higher ovality of the wool shifts the calculated mass balance toward the sheep fiber.
The resulting gravimetric ledger suggests wool enrichment, even when the gravimetric input at the blending hopper matched the purchase order exactly.
Instrument calibration protocols attempt to offset this geometric bias through empirical calibration wools. Secondary standards supplied by the International Wool Textile Organisation establish baseline focus and width offsets. These calibration sets normalize the optical measurement against reference wools of known airflow and projection mean diameters.
They do not eliminate snippet-to-snippet variance when scanning fibers whose aspect ratios differ from the calibration set. A calibration curve derived from circular merino fibers fails when evaluating flat mohair or irregularly lobed viscose.
A cross-sectional aspect ratio of 1.20 creates a mathematical area overestimation of nine percent when treated as an unoriented circular cylinder.
Direct cross-sectional cutting and automated image analysis under high-resolution microscopy offer the only physical check on ellipticity distortion. Microtome preparations set in synthetic resin allow the technician to measure both major and minor axes simultaneously. Comparing the true orthogonal cross-sectional area against the projected optical diameter confirms the systematic gravimetric inflation inherent to standard two-dimensional scanning.


Snippet

Length Bias and Guillotine Dynamics
Preparation of fiber specimens for optical diameter analysis requires cutting staple fibers into micro-snippets. Guillotine cutters and heavy-duty double-blade choppers shear aligned fiber bundles into segments ranging from 0.4 millimeters to 0.8 millimeters in nominal length. Mathematical mass conversion models treat this segment length as a fixed scalar value.
Physical reality in the sample preparation room disproves that assumption across every trial.
Flexural rigidity dictates how a fiber behaves between cutting blades. Bending stiffness scales with the fourth power of fiber diameter for a given tensile modulus. Coarse fibers resist bending, shearing cleanly across the blade path at the prescribed cut width.
Ultra-fine fibers buckle, deflect, or compress within the bundle prior to shear. This deflection produces uneven snippet lengths, with fine fibers yielding shorter segments or crushed fragments that fail instrument focus criteria. When an automated optical system discards crushed or out-of-focus fragments, it selectively purges the finest fraction from the count.
Variable snippet length destroys the foundation of gravimetric integration. The formula for segment mass requires multiplying area by length and density. If coarse fiber snippets average 0.65 millimeters in length while fine fiber snippets average 0.48 millimeters due to blade deflection, assigning a uniform length scalar to both overestimates the volume contribution of the finer diameter bins while understating the mass of the coarser bins.
The resulting gravimetric conversion distorts the distribution profile, flattening the true standard deviation.
Staple length correlation introduces an even larger physical distortion. In natural fleeces and tops, coarser fibers within a fleece often grow longer than finer fibers from the same animal. When drawing a representative mass snippet sample, longer fibers possess a higher probability of being intersected by the sampling plane.
This length-biased sampling phenomenon, well documented in cotton sliver testing, applies directly to optical fiber snippet selection. The sample deposited onto the slide contains a higher count proportion of long, coarse fibers than existed in the uncombed lot.
- Bundle Tension must be controlled during guillotine feeding to prevent differential elongation between elastic fine fibers and stiff coarse guard hairs.
- Blade Sharpness requires inspection after every fifty cuts, because dull edges crush fine fibers while tearing thick fibers, producing ragged fragment ends that optical edge-detection algorithms misread.
- Slide Dispersion demands low air velocity to avoid aerodynamic sorting, where light, short fragments drift to slide perimeters while dense fragments settle in the scanning field.
- Debris Filtering settings within the analyzer software need strict calibration to prevent short, fine snippets from being classified and rejected as skin flakes or vegetable dust.
Failure to control these mechanical preparation variables shifts the measured mean diameter upward by 0.5 to 1.8 micrometers. In spinning mills producing fine worsted yarns, an uncorrected 1.0 micrometer shift alters spinning limits by an entire count grade, forcing adjustments to draft settings on the ring frame.


Density

Polymer Specific Gravity Discrepancies
Optical analyzers measure geometric boundaries, completely blind to physical mass and internal morphology. Converting volume to mass requires multiplying by the specific gravity of the fiber substance. Across pure single-polymer lots, specific gravity appears predictable.
Across intimate blends, recycled stocks, and medullated animal fibers, density becomes a variable rather than a constant.
The standard specific gravity values used in textile trade calculations conceal significant internal variation. Wool exhibits a solid keratin density between 1.30 and 1.32 grams per cubic centimeter under standard testing atmospheres of twenty degrees Celsius and sixty-five percent relative humidity. Cashmere displays a slightly lower density of 1.30 grams per cubic centimeter.
Polyester holds a nominal density of 1.38 grams per cubic centimeter, while nylon 6,6 registers at 1.14 grams per cubic centimeter. Acrylic fibers range from 1.17 to 1.19 grams per cubic centimeter. Cotton cellulose sits significantly higher at 1.52 to 1.54 grams per cubic centimeter.
| Fiber Material Type | Dry Density (g/cm³) | Commercial Regain (%) | Standard Conditioned Density (g/cm³) | Specific Mass Factor Relative to Keratin |
|---|---|---|---|---|
| Fine Cashmere | 1.30 | 15.0 | 1.31 | 0.992 |
| Merino Wool | 1.31 | 18.25 | 1.32 | 1.000 |
| Medullated Coarse Wool | 1.18 | 16.5 | 1.21 | 0.916 |
| Mulberry Silk | 1.33 | 11.0 | 1.34 | 1.015 |
| Polyester (PET) | 1.38 | 0.4 | 1.38 | 1.045 |
| Nylon 6,6 | 1.14 | 4.5 | 1.15 | 0.871 |
| Viscose Rayon | 1.50 | 13.0 | 1.52 | 1.151 |
| Upland Cotton | 1.52 | 8.5 | 1.54 | 1.166 |
When an intimate blend of wool and polyester is analyzed optically to verify blend composition, using an unweighted average density distorts the gravimetric output. Polyester fragments present identical geometric volumes to wool fragments of the same diameter, but carry 4.5 percent more mass per unit length. In a specified 55/45 polyester-wool suit fabric, failing to apply material-specific densities shifts the calculated gravimetric ratio by nearly two percentage points, generating false non-conformance reports against delivery specifications.
Medullation in animal fibers introduces an even more severe gravimetric calculation error. Guard hairs and kemp fibers feature hollow central cores filled with air pockets. Coarse animal hairs exceeding thirty micrometers frequently exhibit medullation ratios where the internal void occupies thirty to sixty percent of the total cross-sectional volume.
An optical analyzer scans the external perimeter of the hair, recording a large diameter and calculating a massive volumetric cylinder. The internal void means the actual mass of that hollow snippet may be less than half that of a solid keratin cylinder of identical outer dimension.
A medullated guard hair with a fifty percent internal air core possesses only half the gravimetric mass predicted by its optical perimeter.
Uncorrected gravimetric conversion models treat medullated fibers as solid keratin. This miscalculation drastically overstates the weight percentage of coarse hair in specialty blends. An optical count that detects 1.5 percent coarse fibers by number can translate into a reported mass contamination of five percent if the software assumes solid fiber cores.
Chemical extraction and solvent separation do not suffer from this optical artifact, proving that the actual mass contamination sits substantially lower than the uncorrected optical prediction.
Moisture regain shifts density across relative humidity gradients. Hydrophilic fibers swell dramatically upon absorbing atmospheric water, altering both diameter and specific gravity simultaneously. Wool swells up to sixteen percent in diameter from dry to saturated states, while its density decreases slightly as water molecules penetrate the amorphous matrix.
Conducting optical scans in non-conditioned environments invalidates the volumetric integration entirely, producing data that fails laboratory cross-checks.
Arithmetic

Moments of Distribution and Conversion Models
Mathematical transformation of particle distributions relies on moment conversions. The number distribution obtained from optical scanning represents the zeroth to first moment of the population. Gravimetric distribution represents the third moment when assuming length and density remain constant across diameter classes.
The Hatch-Choate equations establish the formal mathematical relationship for log-normal particle distributions, demonstrating how mean diameters shift when transitioning from count-based metrics to mass-based metrics.
For a distribution following a strict log-normal function with a geometric count mean diameter and a geometric standard deviation, the mass-weighted mean diameter exceeds the count-weighted mean diameter by an exponential factor. The mathematical expression dictates that the mass-median diameter equals the count-median diameter multiplied by the natural base raised to the power of three times the squared natural logarithm of the geometric standard deviation. When the dispersion of fiber diameters widens, the gap between the optical count mean and the gravimetric mass mean expands exponentially.
Consider a practical textile delivery where a combed wool top is evaluated for spin capability and blend proportion. Assume a 20-tonne consignment of nominal 19.5-micrometer wool tops carrying an optical coefficient of variation of twenty-two percent. In this population, the numerical mean diameter reads at 19.50 micrometers.
Calculating the mass-weighted diameter across the distribution classes yields a gravimetric mean of 20.89 micrometers. This difference of nearly 1.4 micrometers represents an entire spinning grade in traditional Bradford and metric yarn numbering systems.
| Diameter Class Interval (µm) | Optical Count Frequency (%) | Calculated Volume Fraction (%) | Corrected Solid Mass Fraction (%) | Cumulative Mass Contribution (%) |
|---|---|---|---|---|
| 10.0 to 14.0 | 8.5 | 2.1 | 2.1 | 2.1 |
| 14.1 to 18.0 | 38.2 | 23.4 | 23.5 | 25.6 |
| 18.1 to 22.0 | 37.1 | 41.2 | 41.4 | 67.0 |
| 22.1 to 26.0 | 12.4 | 22.8 | 22.7 | 89.7 |
| 26.1 to 30.0 | 3.1 | 8.4 | 8.3 | 98.0 |
| 30.1 to 36.0 | 0.7 | 2.0 | 2.0 | 100.0 |
The tabulated distribution shows how the coarse tail between 26.1 and 36.0 micrometers accounts for only 3.8 percent of the fibers by optical count. Under gravimetric conversion, this identical tail commands 10.3 percent of the entire lot mass. In high-speed worsted spinning, that ten percent mass concentration creates periodic thick places in 60s metric yarn, escalating end-breakage rates on the spinning floor from twenty breaks per thousand spindle hours to over sixty breaks per thousand spindle hours.
Bimodal and multimodal distributions completely break log-normal mathematical conversions. When a lot contains recycled stock, fiber salvage, or poorly mixed raw materials, the diameter histogram displays two distinct peaks. Mathematical conversions designed for unimodal Gaussian or log-normal distributions fail to describe these systems.
Calculating a single gravimetric conversion factor across a bimodal distribution artificially pulls mass from both extremes toward an unpopulated center, masking the presence of coarse contamination while misstating the yield of fine spinnable stock.
To establish rigorous gravimetric conversion across non-standard distributions, the processing algorithm evaluates each class interval independently. The count frequency of each narrow bin is multiplied by the cubed midpoint diameter, normalized against the total sum of all weighted bins, and scaled by material density factors. Summing these discrete volumetric slices avoids the distortions introduced by generalized parametric equations, providing a closer approximation to chemical dissolution assays.

Settlement
Commercial Verification and Border Arbitrage
Discrepancies between optical counts and gravimetric reality carry immediate financial liability at port entry and invoice settlement. Commercial contracts specifying intimate fiber blends demand compliance under legally recognized gravimetric methods. The European Union Textile Labelling Regulation No 1007/2011 and United States Federal Trade Commission regulations under the Wool Products Labeling Act mandate that fiber percentages be declared on a net dry mass basis with standard moisture regains applied.
Customs authorities reject declarations calculated from unadjusted optical count distributions.
Cross-border customs inspections focus intensely on the boundary between fine animal hair and sheep wool. Under the Harmonized Tariff Schedule, clean cashmere tops enter under subheading 5102.11 with preferential duty structures, while fine sheep wool tops fall under subheading 5105.29. If a customs laboratory runs an automated optical scan and applies a naive square-diameter conversion to estimate sheep wool contamination, the exaggerated coarse tail can trigger an immediate reclassification.
The importer faces tariff reassessment, anti-dumping duties, and commercial fraud investigations based entirely on a mathematical conversion artifact.
- Sampling Protocol Enforcement requires drawing core samples per ISO 137 and ASTM D1060 rules rather than accepting grab samples from top rolls.
- Chemical Assay Arbitration reserves quantitative solvent separation under ISO 1833-4 for disputed wool and cellulosic blends instead of relying on optical projections.
- Contractual Tolerance Setting defines allowable commercial mass variance at plus or minus two percent, explicitly forbidding the substitution of number distributions for mass distributions.
- Laboratory Accreditation Verification insists that testing houses demonstrate specific ISO/IEC 17025 accreditation for gravimetric fiber analysis rather than generic image analysis.
When an optical analysis report indicates off-spec fiber distribution, commercial buyers deploy standardized arbitration workflows. A third-party accredited laboratory splits the retention sample into three sealed lots. One lot undergoes automated optical analysis using shape-corrected ellipse compensation algorithms.
The second lot undergoes physical cross-sectional microtome measurement to map true transverse areas. The third lot undergoes destructive quantitative chemical dissolution or mechanical dehairing per IWTO Draft Test Method 58.
Where chemical separation is impossible due to identical protein chemistries, such as cashmere mixed with fine merino wool, testing houses combine optical scanning with matrix-assisted laser desorption ionization time-of-flight mass spectrometry. Proteomic peptide mass fingerprinting quantifies the absolute mass ratio of keratin proteins independently of fiber dimensions. This biochemical assay provides the legal arbiter when optical gravimetric conversions yield contested results.
A typical delivery dispute reveals the commercial cost of uncorrected optical data. An import batch of 15 metric tonnes of combed luxury yarn, invoiced at ninety dollars per kilogram, faces customs rejection when optical scanning reports 5.2 percent coarse sheep wool against a contractual ceiling of 3.0 percent. The importer pays for bonded storage, secondary proteomic testing, and contract delay fees totaling over forty thousand dollars.
Corrected gravimetric calculations, accounting for medullation voids and true cross-sectional eccentricity, establish that the actual sheep wool mass sits at 2.8 percent. The shipment clears customs, but the financial friction permanently erodes the margin on the cut.
Commercial contracts protect against this exposure by explicitly dictating analytical methods in the technical purchase specification. Importers who bind their supplier purchase agreements to certified chemical dissolution under ISO 1833 or proteomic verification avoid the arbitrary penalties generated by raw optical conversion errors.