Resolving Cross Sectional Ellipticity Bias in Automated Image Analysis Fine down Certification
Correcting cross-sectional ellipticity bias in automated down analysis eliminates false micron inflation, securing accurate fineness and customs declarations.

Geometry
Fine goat down and avian plumule fibres exhibit elliptical cross-sections with major-to-minor axis ratios ranging from 1.15:1 to 1.42:1. When technicians chop raw fiber lots into short snippets ranging from 0.8 mm to 2.0 mm for automated optical measurement, hydrodynamic shear and gravitational settling force these non-circular filaments to rest on their flat sides. A specimen slide or liquid dispersion cell presents the widest physical dimension to the camera array.
Fibre orientation dictates optical width.
Automated image analysis platforms capture two-dimensional shadow projections across thousands of individual fiber snippets. Because the minor axis remains aligned with the optical axis of the microscope camera, the captured profile width systematically exceeds the equivalent circular diameter. Flattened profiles systematically overestimate fineness.
In high-grade cashmere certification, where the trade sets a commercial boundary between 14.5 microns and 15.5 microns, an uncorrected ellipticity bias artificially inflates the reported mean fibre diameter by 0.4 to 0.9 microns. This systematic error lowers the perceived commercial value of superfine clips and alters the calculated blend percentages in fine down certification reports.
Down fibre cross-sectional ellipticity introduces a systematic positive bias in projected profile width that correlates directly with aspect ratio severity.
Physical mechanisms driving this measurement bias originate in both biological morphogenesis and specimen preparation methods:
- Asymmetric Keratinization Morphological growth patterns inside animal hair follicles generate non-concentric cortex rings, resulting in ribbon-like or flattened cross-sectional profiles.
- Hydrodynamic Planar Alignment Viscous carrier fluids used in flow-through cell analyzers align non-spherical particles along their minimum hydro-drag axis parallel to the glass boundary.
- Gravitational Deposition Dry glass slide preparation methods allow falling snippets to settle onto their broad flat faces, hiding the minor axis from vertical optical observation.
- Cutting Shear Deformation Mechanical guillotine blades compress soft down structures during micro-sectioning, accentuating cross-sectional eccentricity before image acquisition.
Gravity aligns the major axis. Static fluids compound orientation bias. Fiber processing mills frequently claim that optical diameter software automatically compensates for non-circular geometry through random spatial distribution assumptions, ignoring the physical settling dynamics of flattened hair structures on glass surfaces.
Lens
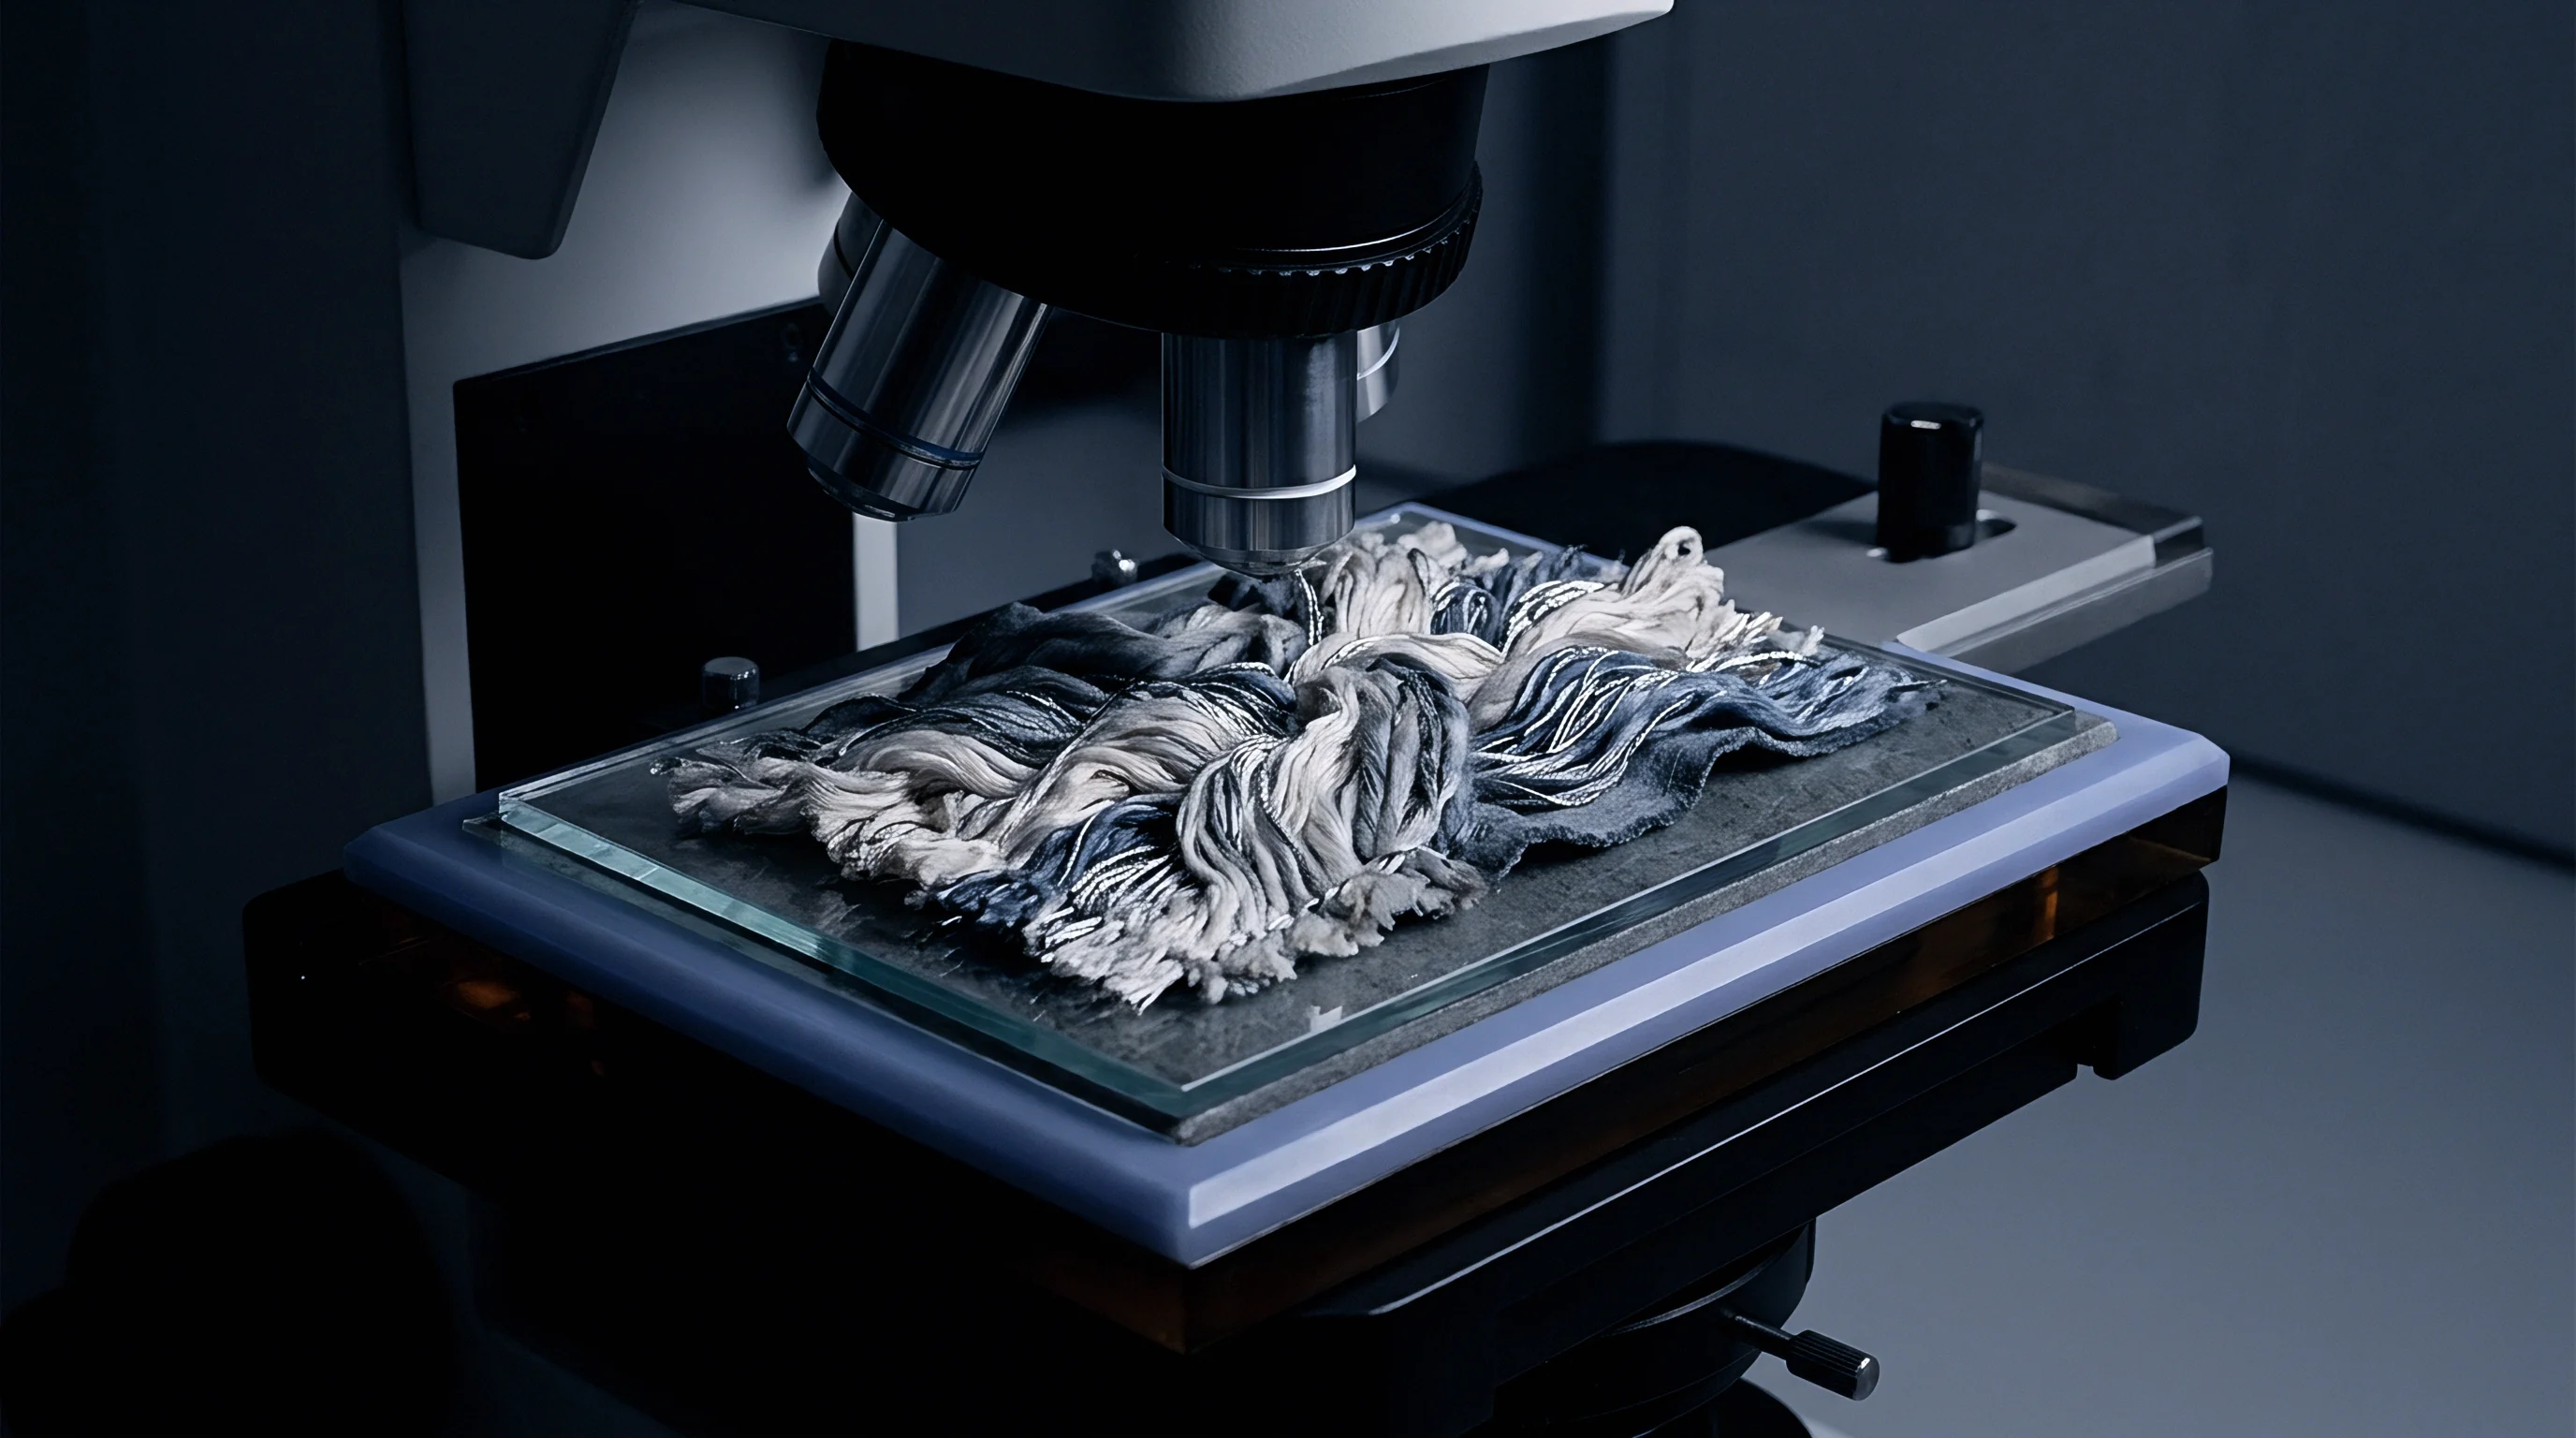
Automated optical instruments process high-resolution digital images to compute mean fibre diameter, standard deviation, and coefficient of variation. Standard algorithms measure profile width at right angles to the longitudinal axis of each detected fibre snippet. The software converts these linear pixel counts directly into diameter figures based on a circular cross-section model.
Profile width exaggerates true mass.
When measuring circular wool fibres, two-dimensional projections match three-dimensional volume estimates with high precision. Fine down and specialty animal fibres violate this geometry. When an image analysis system evaluates an elliptical fibre with major axis a and minor axis b lying flat on a stage, the optical system captures dimension a while remaining completely blind to dimension b.
The computed mean diameter reflects a rather than the true equivalent area diameter, which equals the square root of the product of a and b.
Can Rotational Scanning Eliminate Profile Diameter Distortion?
Multi-angle projection systems attempt to resolve orientation bias by capturing images of suspended snippets across varying rotational planes. Dual-camera flow cells and orthogonal mirrors record profile widths from multiple perspectives, allowing software to reconstruct the true elliptical cross-section. The table below compares automated optical image analysis performance against traditional and physical reference methods for fine down measurement.
| Measurement Method | Primary Dimensional Metric | Ellipticity Bias Exposure | Mean Diameter Delta (Microns) | Testing Throughput |
|---|---|---|---|---|
| Single-Axis Optical Image Analysis | Projected Profile Width (2D) | High positive bias (+3% to +6%) | +0.45 to +0.85 | High (10,000 fibres in 2 min) |
| Dual-Axis Orthogonal Image Analysis | Biaxial Projected Widths | Moderate positive bias (+1% to +2%) | +0.15 to +0.30 | Medium (5,000 fibres in 3 min) |
| Air-Flow Permeametry (ISO 5079) | Specific Surface Area | Low negative bias (-1% to -2%) | -0.10 to -0.25 | High (20 samples per hour) |
| Gravimetric Micro-Cut (ISO 137 Ref) | Mass per Unit Length | Zero intrinsic geometric bias | 0.00 (Reference Baseline) | Low (2 samples per day) |
Gravimetric cut tests expose bias. Aspect ratios vary across lots. While multi-angle optical imaging reduces ellipticity error, complete elimination of geometric distortion requires mathematical transformation models that integrate minor-axis distribution assumptions directly into the calculation pipeline.
A single-axis optical measurement of fine down snippet profiles overstates true cross-sectional area by an amount proportional to one half the squared eccentricity index.
The remaining uncertainty in multi-axis optical measurement centers on whether dynamic fluid turbulence in flow cells can guarantee uniform angular rotation across short plumule snippets without inducing focal blur during image frame capture.
Arithmetic
Resolving ellipticity bias mathematically requires replacing simple circular geometry formulas with elliptical area transformations. The apparent diameter derived from projected profile width represents the major semi-axis parameter. Converting this optical observation into an equivalent circular diameter demands precise quantification of the average aspect ratio across the targeted fibre population.
Let dobs represent the mean optical profile diameter measured across a sample of 10,000 snippets. If r = a/b defines the mean aspect ratio between the major axis a and minor axis b, the true equivalent circular diameter deq derived from equal cross-sectional area follows from the relationship:
deq = dobs / sqrt(r)
For a high-grade cashmere lot presenting a mean optical profile diameter of 15.20 microns and an independently measured mean aspect ratio of 1.25, the true equivalent circular diameter is calculated as:
deq = 15.20 / sqrt(1.25) = 15.20 / 1.118 = 13.60 text{ microns}
This mathematical adjustment shifts the fineness classification of the clip by 1.60 microns. Cross sectional shape shifts fineness. Correction factors restore true fineness.
Without this transformation, the raw optical data causes commercial misclassification, falsely penalizing finer lots by reporting them as coarse fibre clips.
| Fibre Origin Type | Observed Aspect Ratio Range (a/b) | Shape Factor K (Equivalent Area) | Uncorrected Mean Diameter (um) | Corrected True Diameter (um) |
|---|---|---|---|---|
| Superfine Goat Down (Cashmere) | 1.20 to 1.35 | 0.894 to 0.861 | 15.40 | 13.56 |
| Avian Plumule Fibre (Goose Down) | 1.30 to 1.50 | 0.877 to 0.816 | 12.80 | 10.84 |
| Superfine Alpaca Down | 1.12 to 1.22 | 0.925 to 0.886 | 16.80 | 15.20 |
| Superfine Merino Wool (Control) | 1.05 to 1.10 | 0.953 to 0.931 | 14.50 | 13.67 |
Fibre density remains physically constant. Evaluating linear density in decitex (dtex) requires combining corrected equivalent diameter with specific gravity values according to the equation:
text{Linear Density (dtex)} = frac{pi cdot (d_{eq})^2 cdot rho}{400}
Where rho represents fibre density in grams per cubic centimeter (1.31 g/cm³ for animal keratin down). Applying raw optical profile values directly into linear density equations compounds the volumetric error exponentially, resulting in dtex overestimates exceeding 25 percent.
ISO 17751-2 test protocols specify that automated image analysis certification reports for specialty animal fibres must document whether mean fibre diameter results reflect raw profile width or shape-corrected cross-sectional area.
Calibration curves derived from gravimetric micro-cut standards establish the required shape factor K for each specific fibre origin. Laboratories process a reference lot through gravimetric weighing, determine mass per unit length, and extract the precise mean area. Dividing this mass-derived diameter by the optical profile diameter yields the correction constant applied to subsequent automated image processing runs.
Protocol
Eliminating measurement drift during routine laboratory certification calls for specimen preparation techniques that break major-axis coplanar alignment. Standardizing snippet length and carrier fluid viscosity prevents preferential orientation on slide glass and inside flow channels.
A standardized calibration procedure involves seven sequential verification steps:
- Sample conditioning inside a climate-controlled room at 20 degrees Celsius and 65 percent relative humidity for 24 hours.
- Precision micro-cutting of cleaned fibre tufts into uniform snippets measuring exactly 0.8 mm using heavy-duty rotary blade guillotines.
- Suspension of snippets in a high-viscosity non-reactive dispersion liquid matching the index of refraction of keratin.
- Mechanical agitation through ultrasonic bath treatment for 45 seconds to disrupt snippet clustering and agglomeration.
- Injection of the fluid mixture into an optical flow cell fitted with three-dimensional hydrodynamic focusing nozzles.
- Image capture across a minimum of 10,000 discrete fiber snippet fields under monochromatic LED illumination.
- Execution of post-processing shape-correction software applying the verified aspect ratio transformation matrix for the declared fibre species.
Dispersion viscosity controls rotation rate. Short snippets tumble predictably under controlled shear fields. When snippets drop below 0.5 mm in length, edge diffraction artifacts degrade edge-detection accuracy, while snippets longer than 1.5 mm bend under fluid movement and invalidate orthogonal projection assumptions.
Maintaining fluid carrier viscosity within narrow operational limits prevents micro-snippets from settling onto broad flat surfaces before camera frame capture.
A reliable rule of thumb dictates that any optical image analysis run returning a coefficient of diameter variation below 12 percent on specialty down hair indicates systemic major-axis orientation bias, as true elliptical fibre populations exhibit higher apparent variance under random rotation.
Tariff
Customs classification limits and commercial trading contracts depend on precise fibre fineness declarations. Import authorities apply Harmonized System tariff codes based on mean fibre diameter thresholds. Under Chapter 51, fine animal hair is defined as hair of cashmere, alpaca, or yak possessing a mean diameter of 18 microns or less.
Uncorrected ellipticity bias that pushes a 17.5-micron fine down shipment to an uncorrected optical reading of 18.3 microns changes its customs classification heading, triggering higher duty rates and administrative holds.
Customs labs retest raw shipments. Mislabelling incurs immediate customs penalties. Commercial buying specifications must explicitly mandate the analytical method and correction factor used to certify fineness.
- Declared Test Standard Specification of ISO 17751-2 or IWTO-47 as the binding analytical test protocol in supply contracts.
- Aspect Ratio Documentation Inclusion of measured major-to-minor axis ratios alongside raw mean fibre diameter figures in all certified test dossiers.
- Gravimetric Reference Cross-Check Requirement for dual testing via gravimetric micro-cut methodology whenever optical analysis lands within 0.3 microns of a tariff threshold.
- Retest Arbitration Bounds Establishment of a maximum allowable tolerance spread of 0.4 microns between buyer and seller certification reports before triggering third-party arbitration.
When an uncorrected optical test report causes a superfine down lot to be declared under a coarse hair tariff line, the importer incurs excess duty charges, demurrage penalties, and loss of premium pricing in downstream retail markets.