Statistical Variance Analysis of High Volume Instrument Cotton Bale Core Tests
Statistical variance in cotton core testing stems from sample conditioning, instrument calibration drift, and internal bale structural heterogeneity.

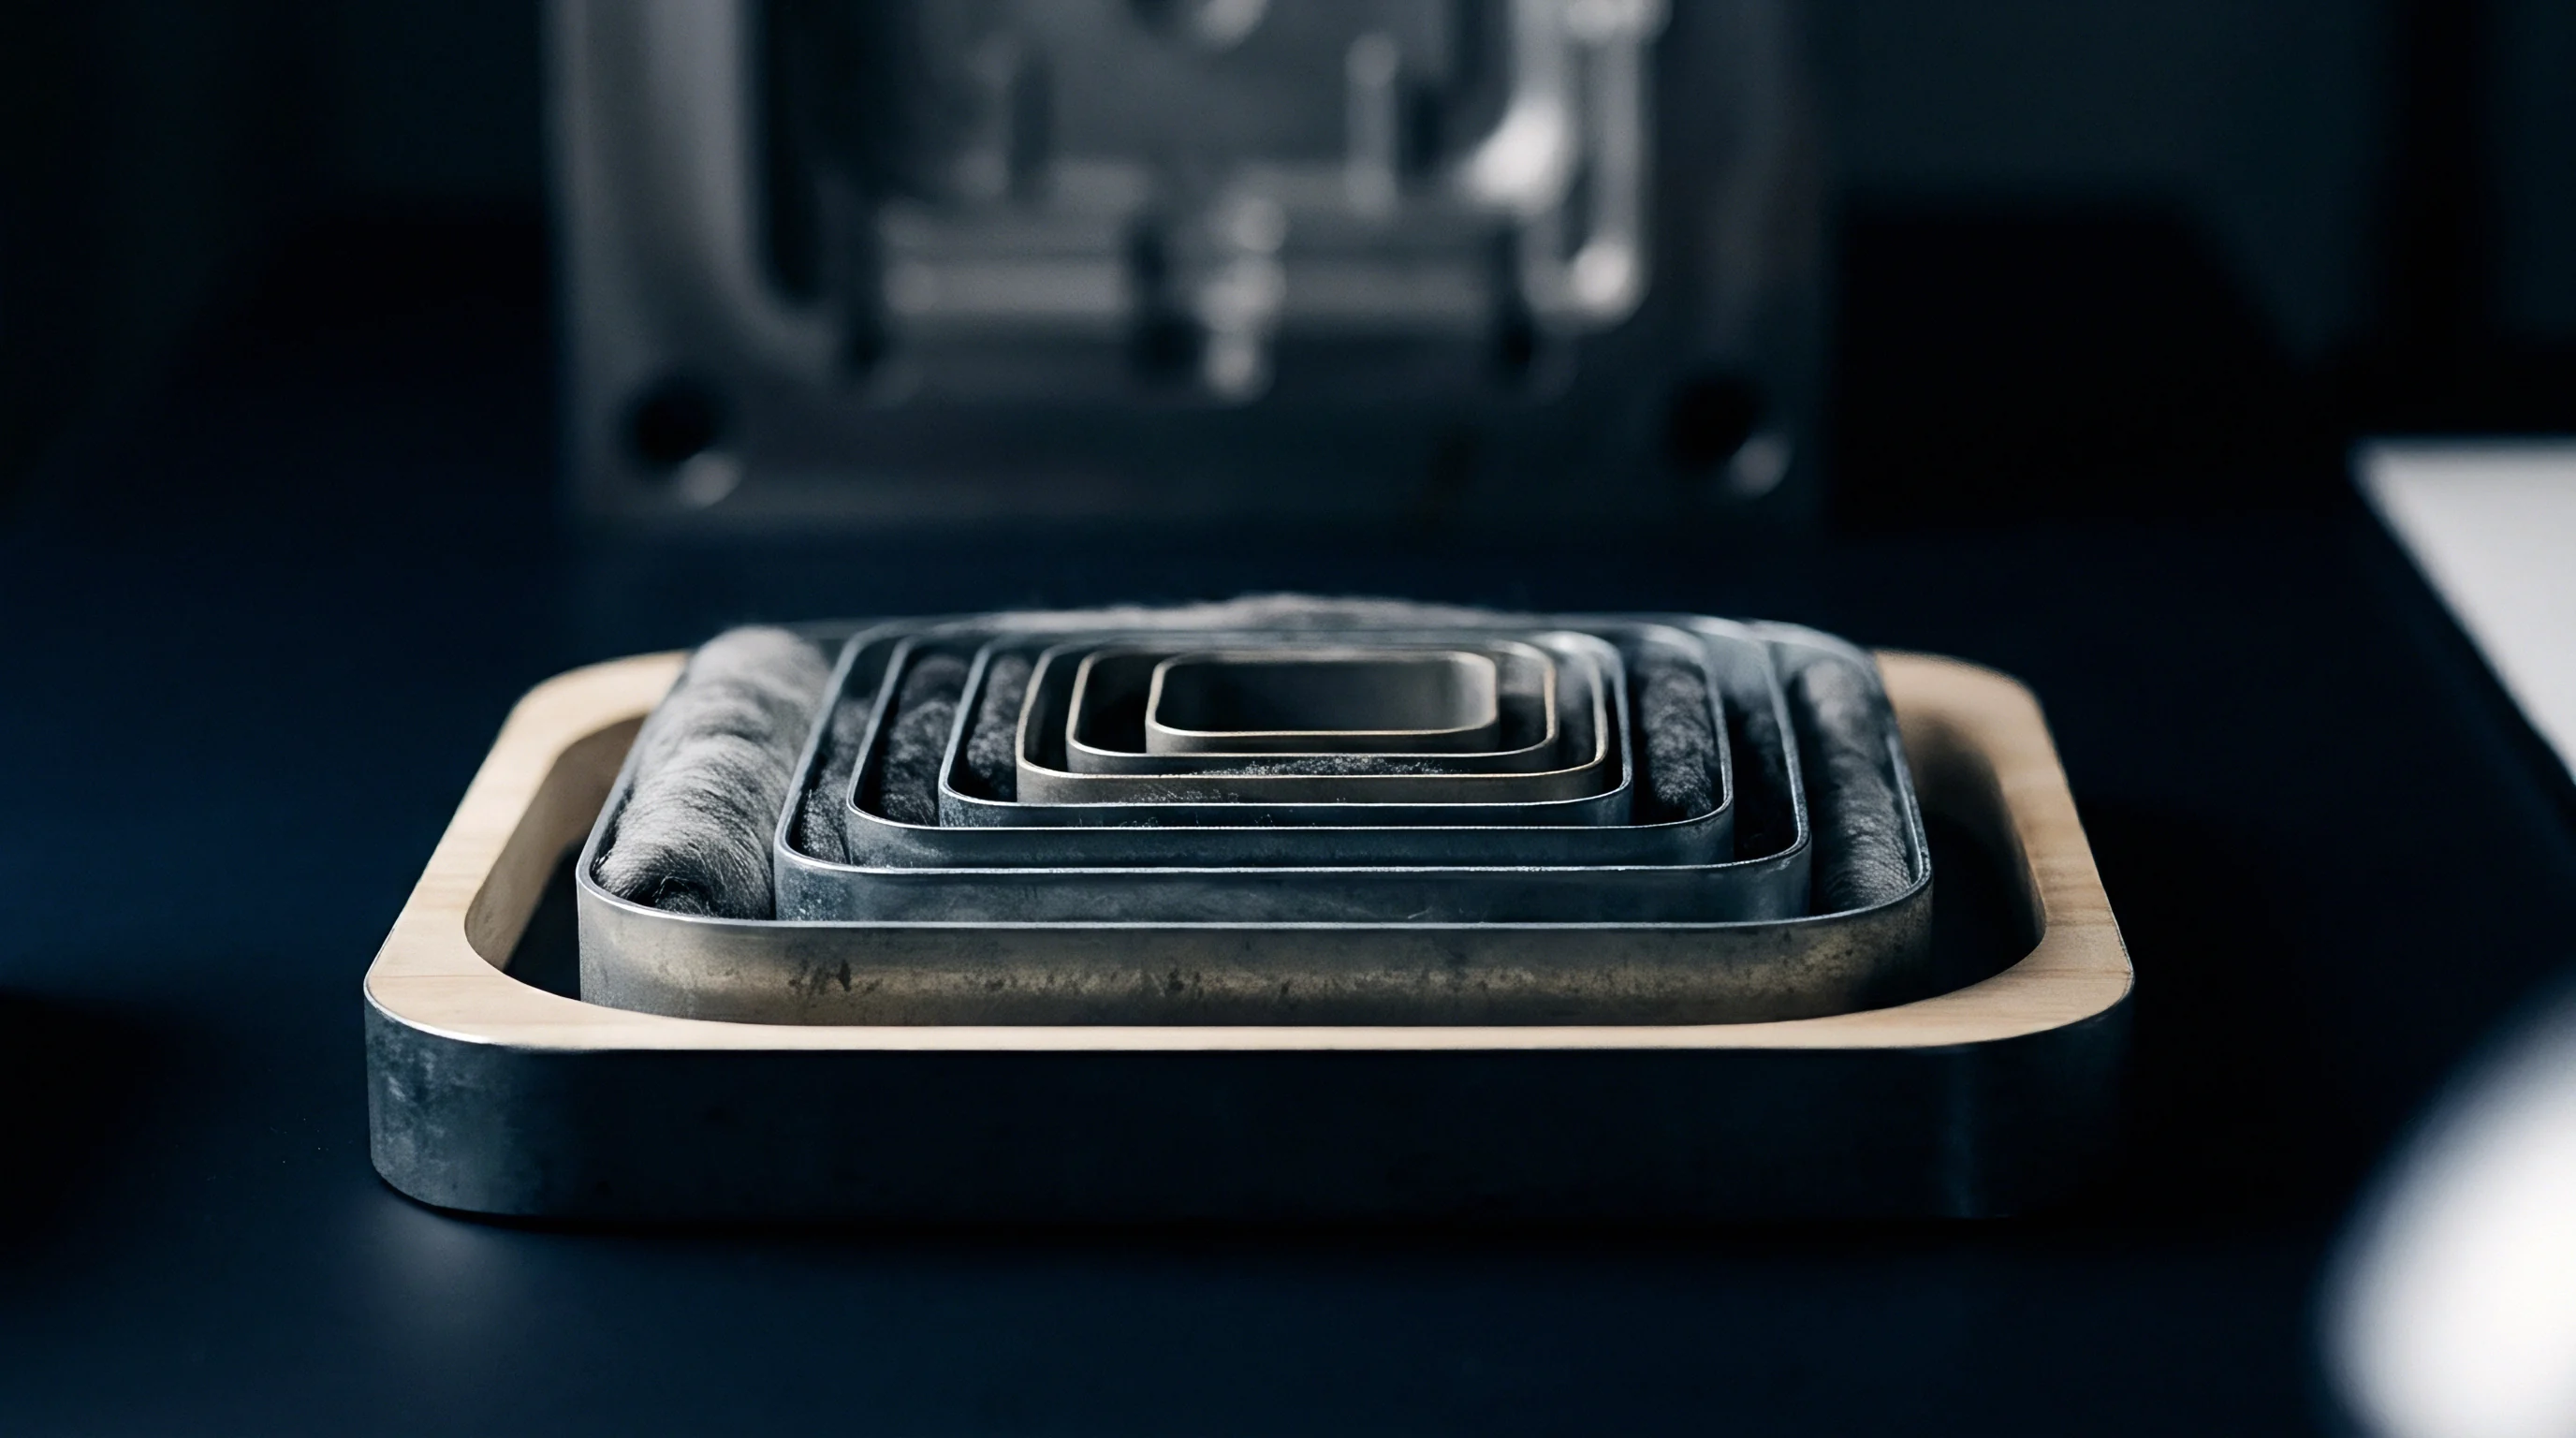
Specimen
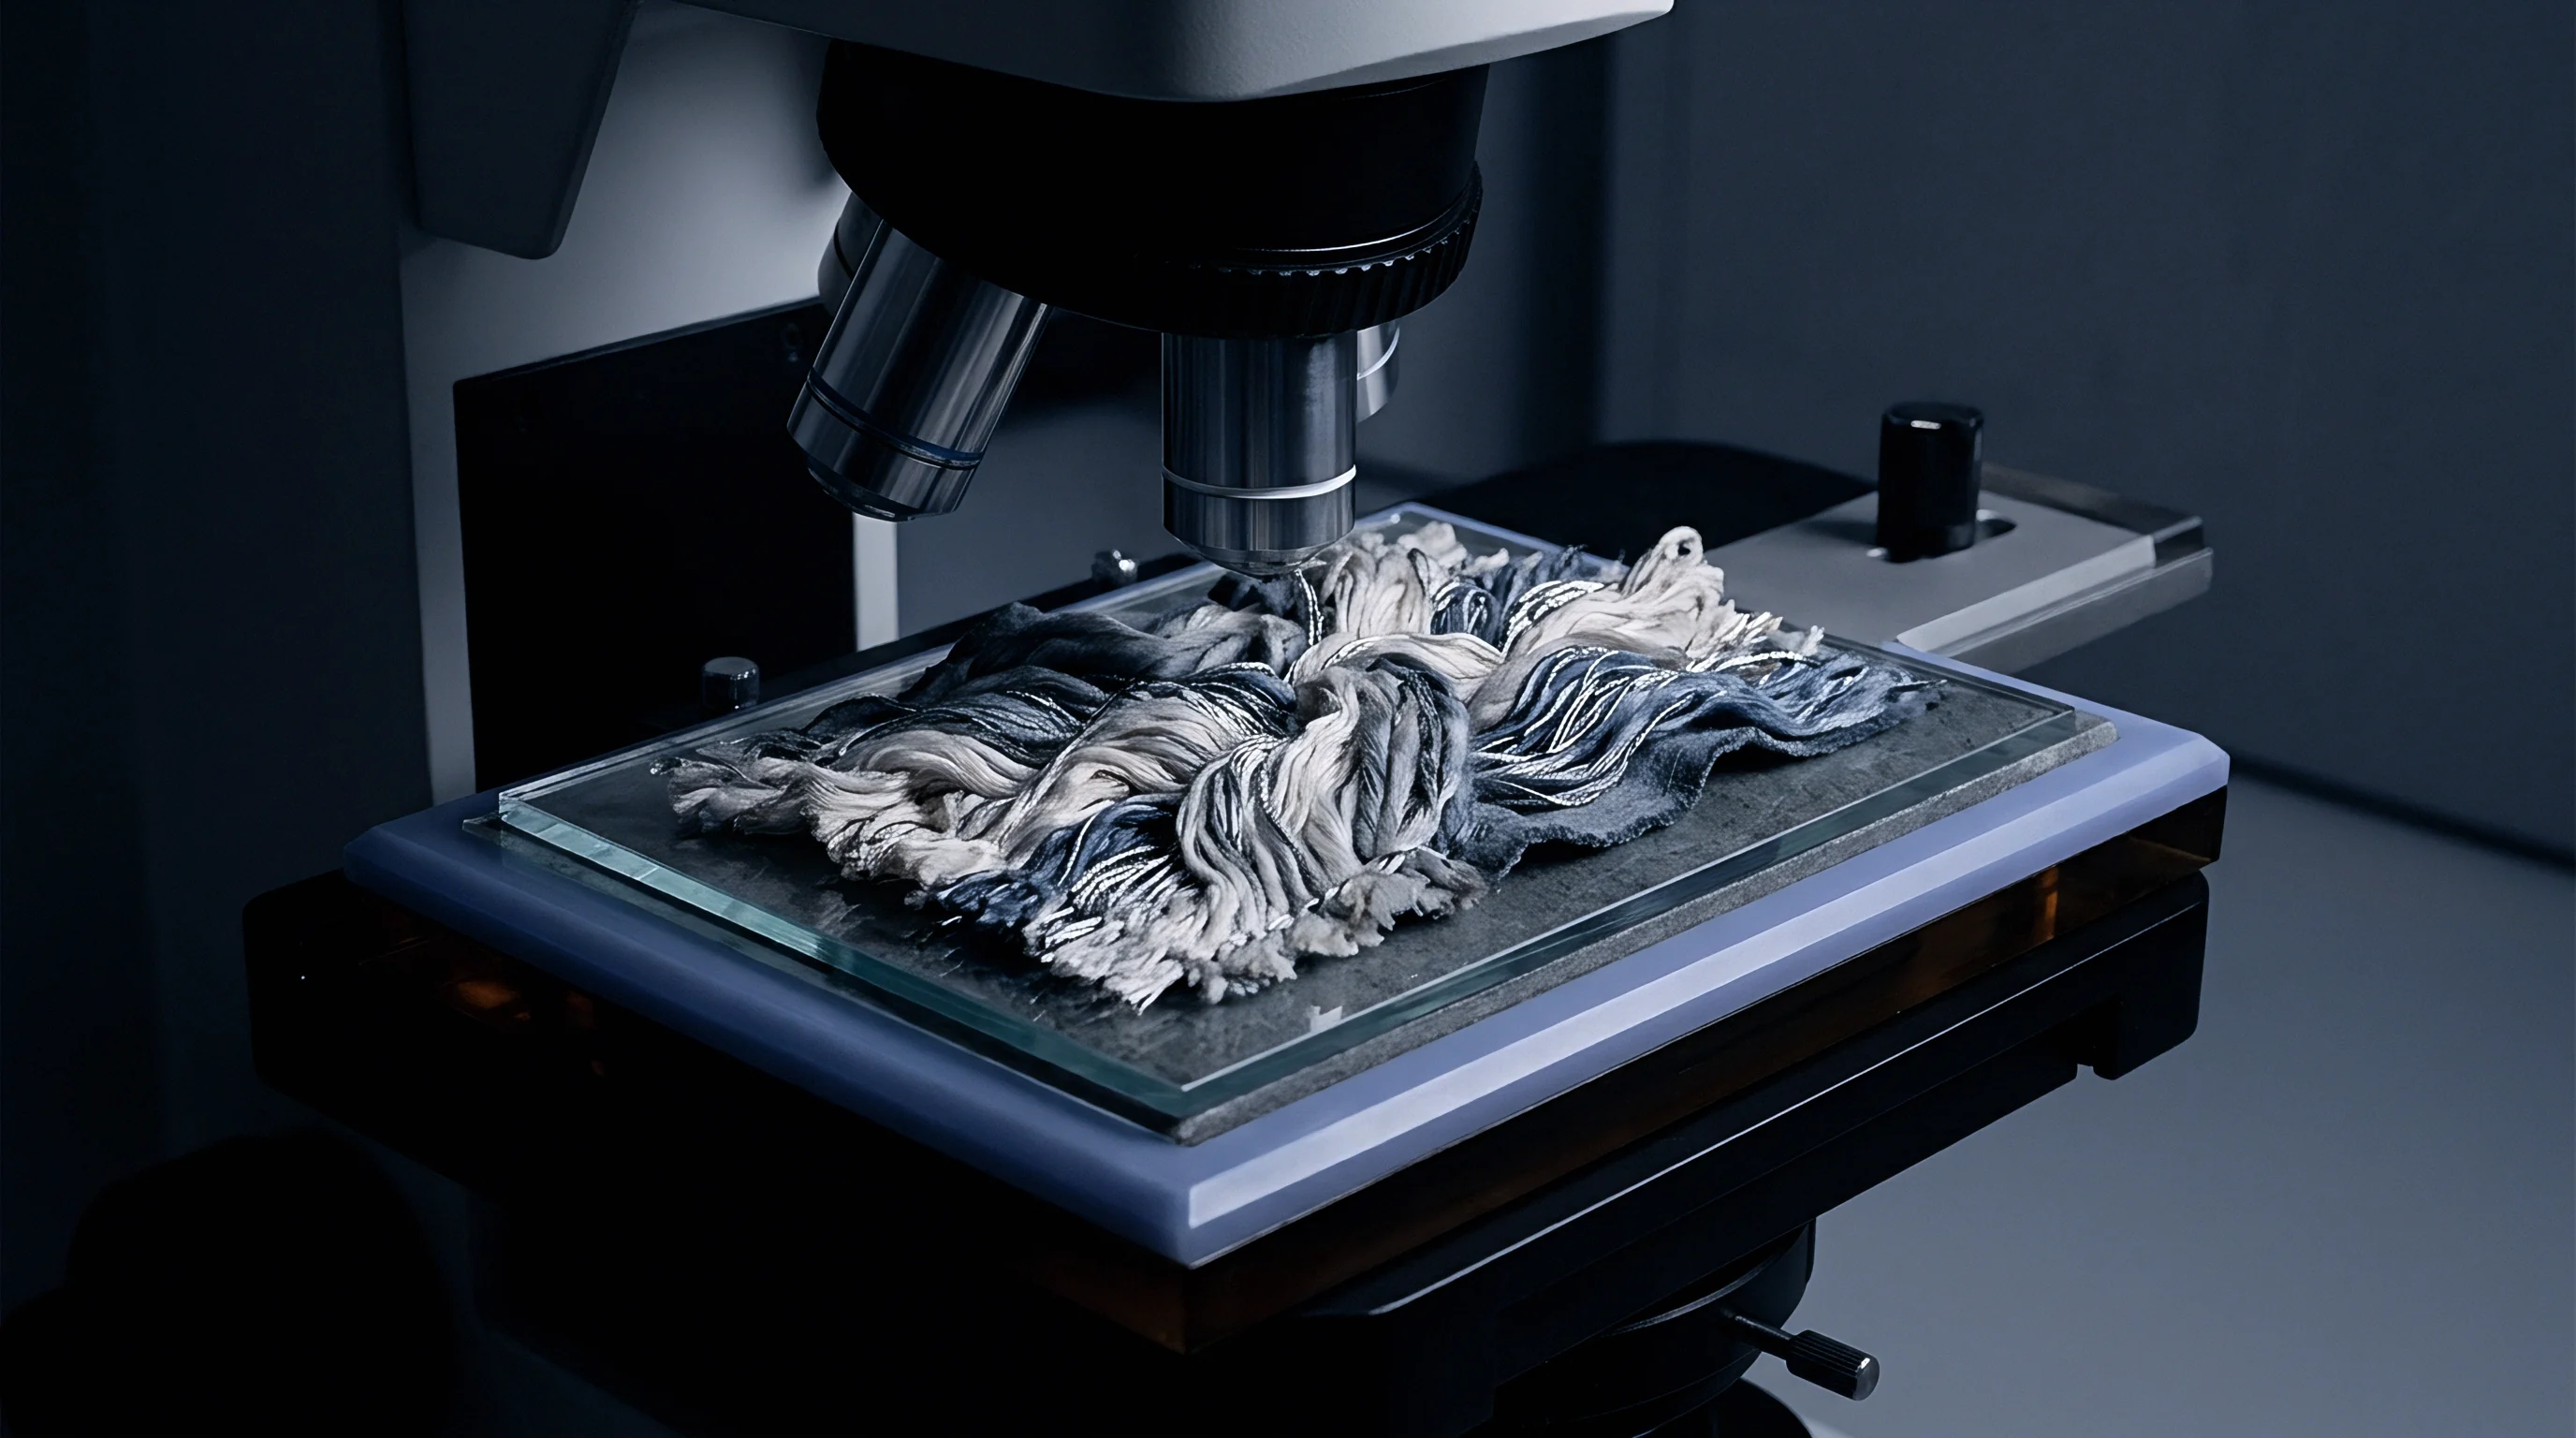
Core Plugs and Physical Sample Partitioning
Universal High Volume Instrument testing lines evaluate raw cotton properties across automated pneumatic and optical stations. The physical core sample, extracted pneumatically through hollow helical augers from pressed bales, establishes the boundary conditions for all downstream variance calculations. Bale densities ranging between 360 and 450 kilograms per cubic metre compress seed-coat fragments, mature lint, and motes into dense strata.
Pneumatic coring draws a cylindrical cross-section measuring approximately 50 millimetres in diameter along a 700 to 1100 millimetre transverse axis. A standard 227-kilogram universal density bale yields two representative 100-gram specimen plugs per core event. The laboratory technician portions each raw plug manually to feed the specimen carding transport mechanisms.
Rapid core extraction exerts friction-induced shear stresses on peripheral fibres inside the hollow auger. Mechanical shearing breaks fragile, thin-walled fibres with lower secondary-wall cellulose deposition, altering the local length distribution. The extracted core specimen contains both the intact central cylinder and sheared boundary fibres.
Standard testing environments governed by ASTM D1776 require an ambient equilibrium of 21 degrees Celsius plus or minus 1 degree, and 65 percent relative humidity plus or minus 2 percent. Cotton fibre moisture content stabilizes between 6.75 and 8.25 percent wet basis under standard twenty-four-hour passive tray conditioning. High-speed rapid conditioning cabinets pull conditioned air through opened core tufts within ten to fifteen minutes.
Deviations in moisture equilibrium alter the viscoelastic behavior of the cellulose matrix.
Tensile break forces recorded at five percent moisture regain read systematically lower than identical lots broken at eight percent regain.
Core sampling protocols mandate specimen selection from opposing bale flanks. Two subsamples per bale capture intra-bale gradients formed during the ginning tramper and lint-flue packaging process. Unequal moisture regain between the outer surface and the hyper-compressed core creates measurable physical variance across identical test runs on the same instrument line.
When pneumatic corers extract lint from damp or excessively dry bales, the measured length distributions register artificial variation before optical scanning begins.


Dispersion

Micronaire Airflow Resistance Components
Micronaire measurements combine specific surface area and absolute fibre maturity into a single empirical index. The High Volume Instrument determines this index by forcing compressed air through a plug weighing between 9.90 and 10.10 grams placed inside a fixed-volume measurement chamber. The pneumatic system records either the pressure differential across the specimen at a fixed flow rate or the volumetric flow rate at a regulated pressure drop.
Specific surface area controls hydrodynamic resistance across the compressed porous bed according to the Kozeny-Carman relationship.
Fibre linear density correlates directly with the outer perimeter of the primary cell wall and the extent of secondary cell wall thickening. Very fine upland cottons with small perimeters yield identical airflow resistance to coarse, immature cottons with incomplete secondary cellulose deposition. The airflow measurement alone cannot resolve whether an elevated resistance originates from fine, mature filaments or coarse, immature ribbons.
This aerodynamic ambiguity transfers statistical variance directly into classing records.
| Testing Parameter | Mean Range | Standard Deviation | Within-Bale CV% | Tolerance Threshold |
|---|---|---|---|---|
| Micronaire Reading | 3.40 to 4.90 index | 0.08 to 0.14 | 2.10 to 3.20 | 0.10 index |
| Upper Half Mean Length | 27.50 to 31.50 mm | 0.35 to 0.55 | 1.25 to 1.85 | 0.45 mm |
| Length Uniformity Index | 80.0 to 84.5 % | 0.70 to 1.10 | 0.85 to 1.35 | 1.20 % |
| Tenacity at Gauge | 28.0 to 34.0 cN/tex | 1.10 to 1.70 | 3.50 to 5.20 | 1.50 cN/tex |
| Short Fibre Index | 6.50 to 12.00 % | 0.80 to 1.40 | 7.50 to 12.20 | 1.00 % |
Repeated testing on a single instrument line isolates three independent variance components. The first originates from the pneumatic transducer sensitivity and electronic drift, typically maintaining a coefficient of variation below 0.8 percent. The second stems from internal bale segregation, where variations in maturity across different seed locations on the gin roll create localized packets of thin-walled fibres.
The third component reflects operator specimen preparation, specifically the manual detachment of seed-coat fragments and large motes before the 10-gram sample enters the cylinder. A failure to clean coarse trash out of the airflow chamber restricts pneumatic pathways, generating an artificially high micronaire figure.
The standard error of the mean for duplicate micronaire runs decreases inversely with the square root of subsample repetitions. Production testing environments balance testing throughput against precision, limiting standard commercial evaluation to one or two tests per bale. The observed variance across five duplicate readings on identical core specimens follows a normal distribution around the central mean when testing occurs within the 65 percent relative humidity tolerance window.
Moving outside this envelope broadens the dispersion bell curve by an additional 1.5 percentage points of relative standard deviation.
Arbitration clauses under international cotton transaction rules classify micronaire readings into specific discount bands. When core test variance moves a delivery from 3.50 to 3.49 micronaire, the shipment falls into discounted territory, triggering automated commercial penalties.
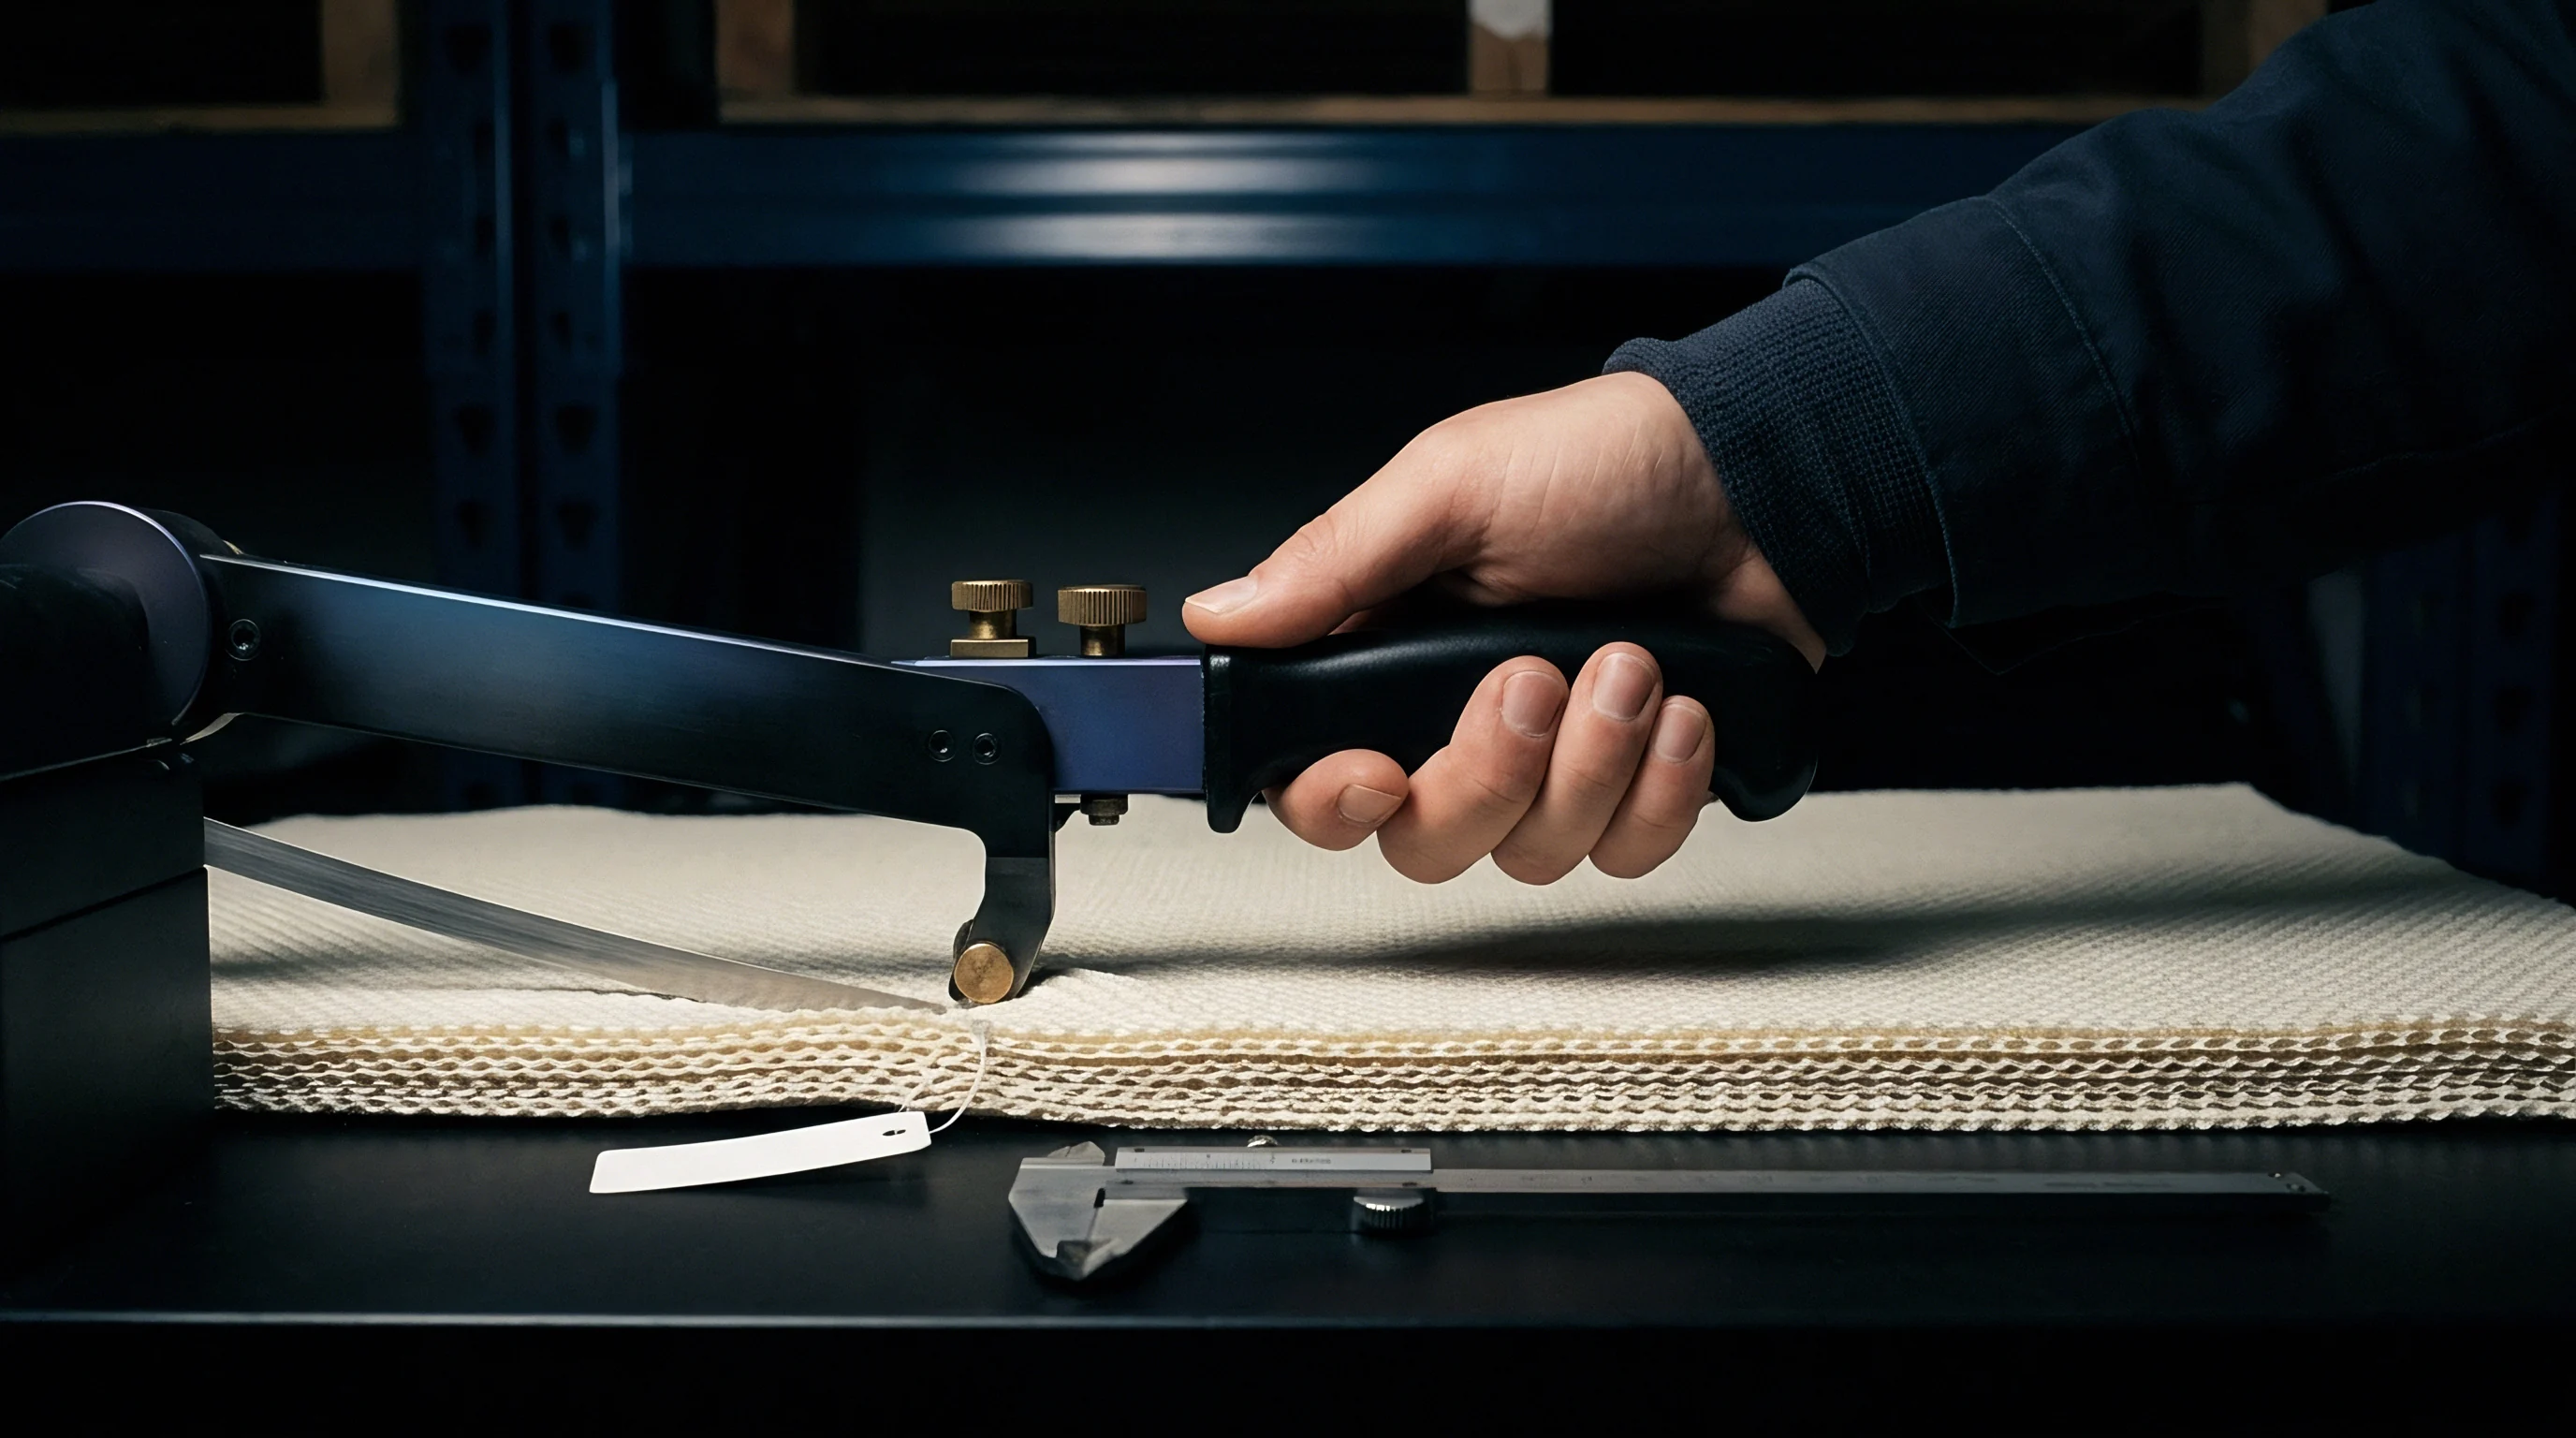
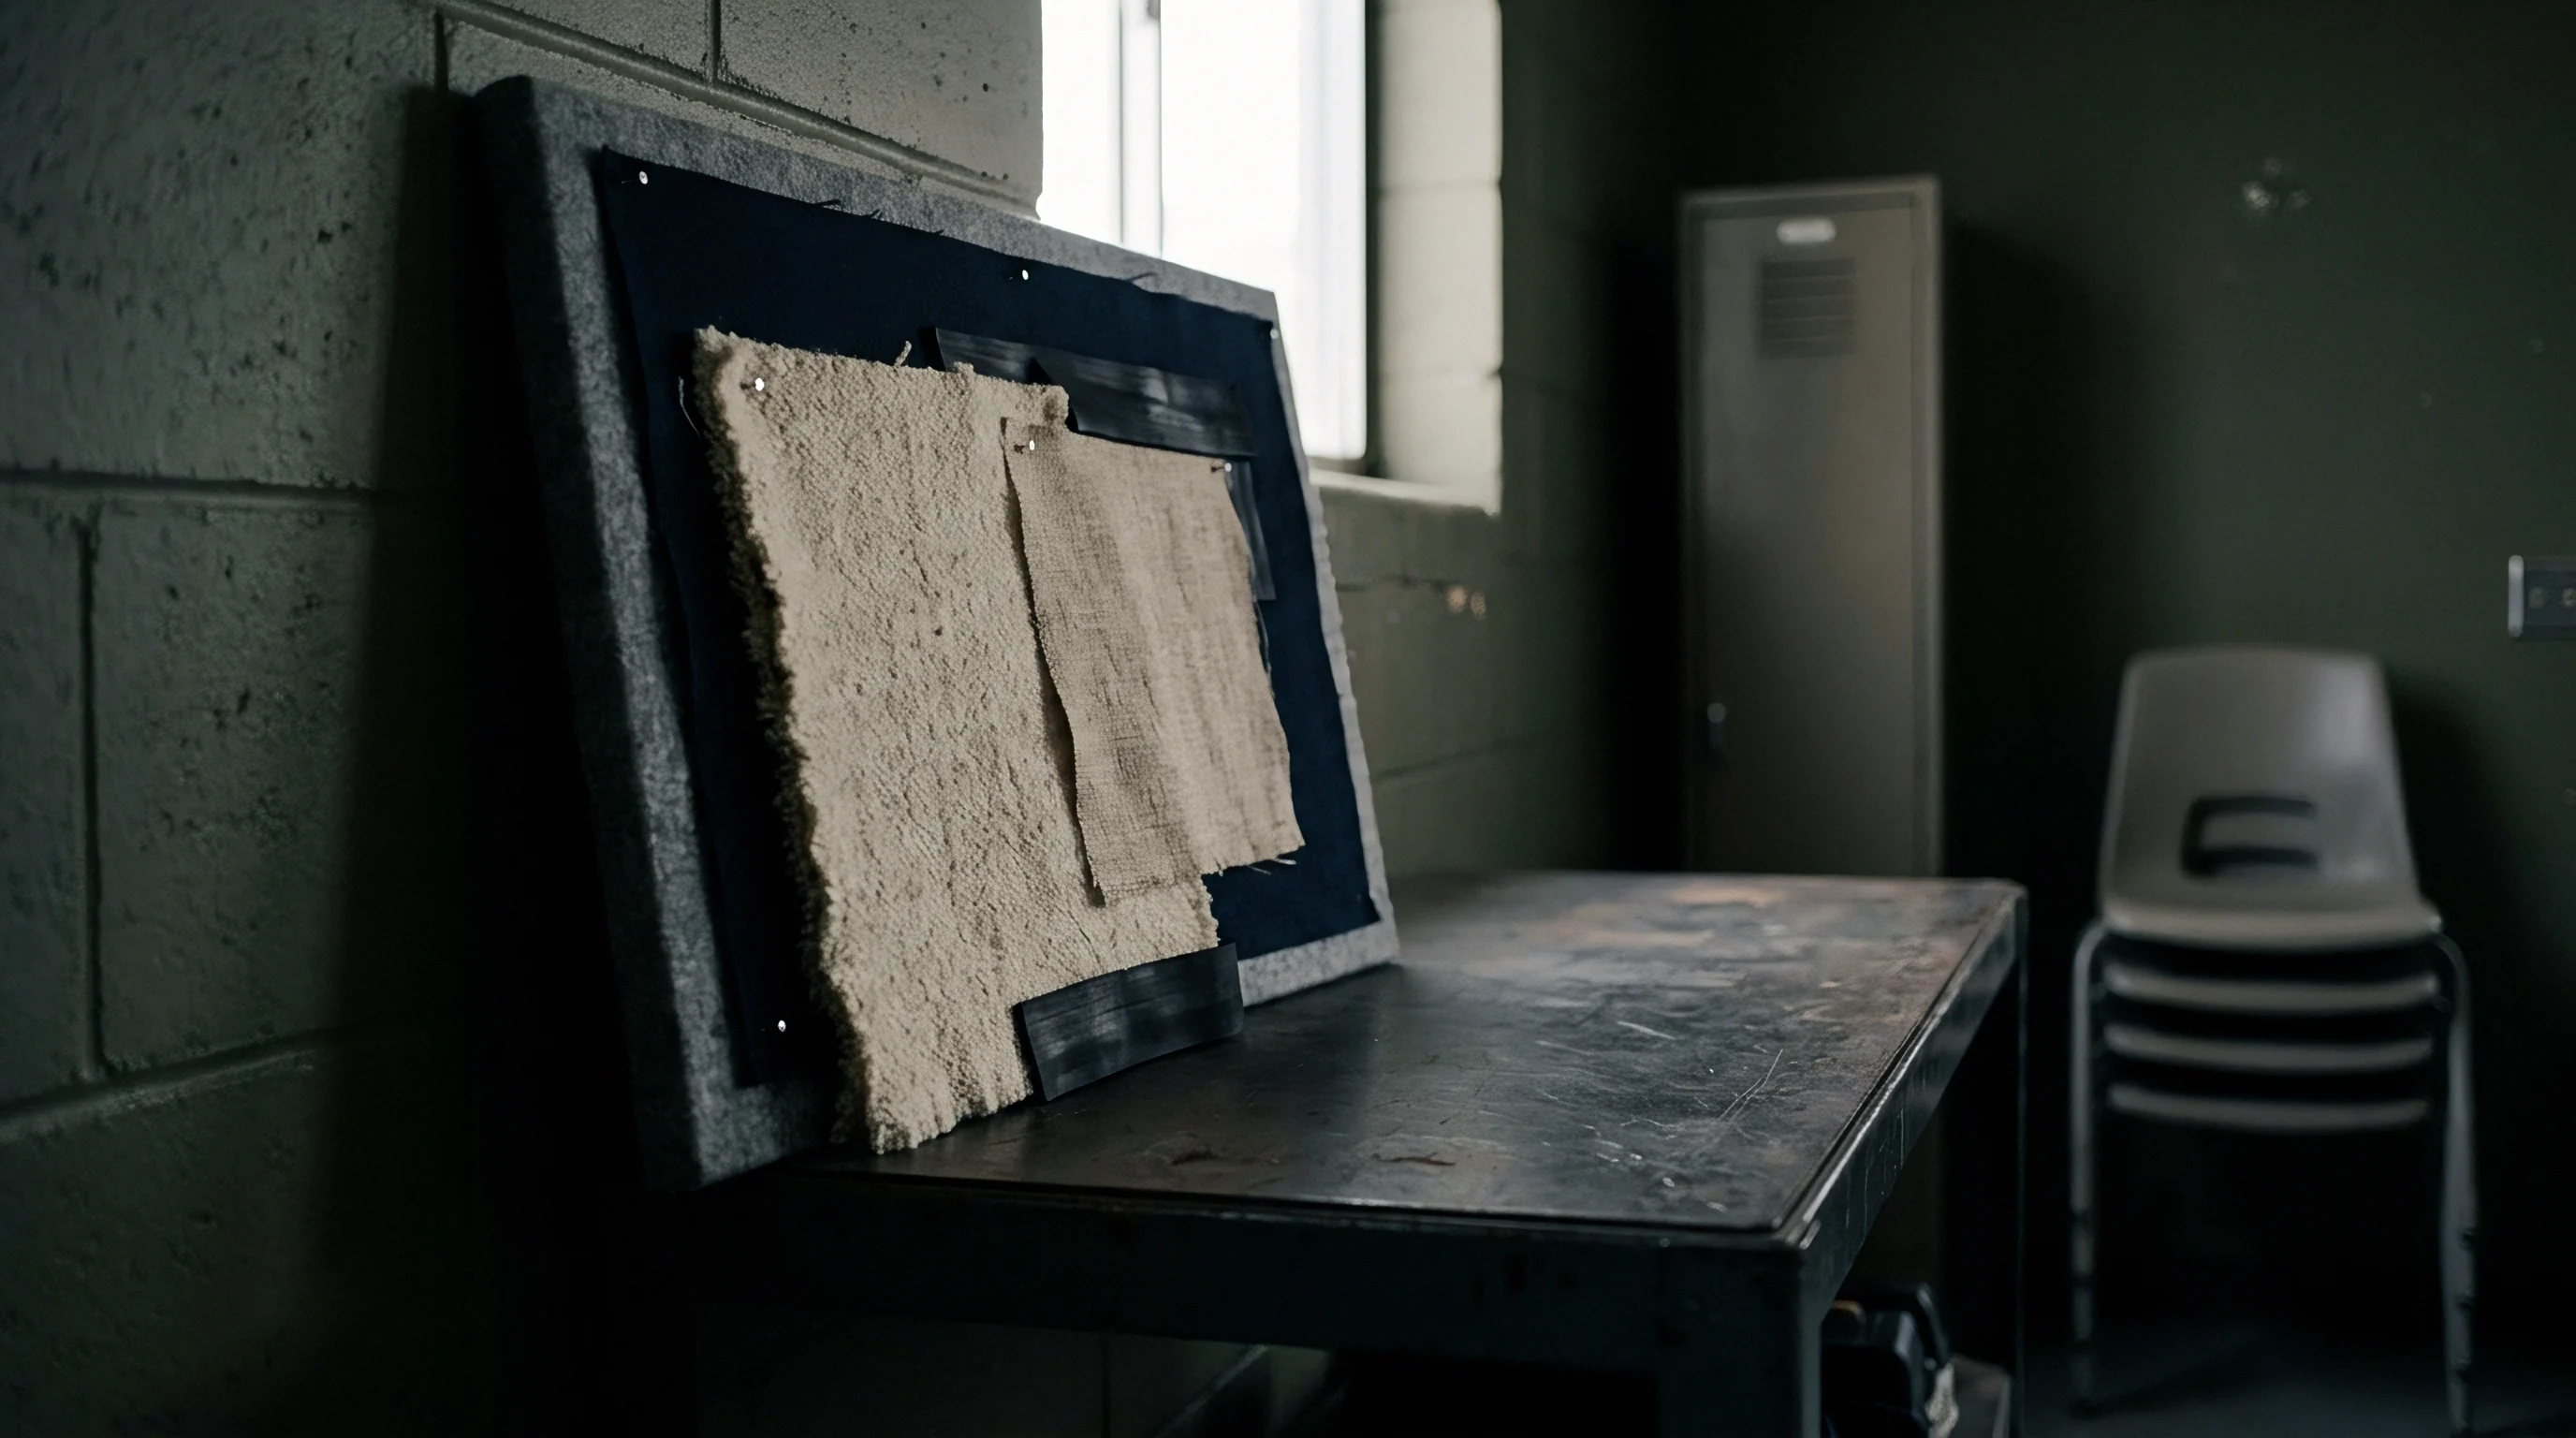
Optics
Length Beard Formation and Photodiode Attenuation
High Volume Instrument length stations calculate the fibrograph curve using optical attenuation through a mechanized fibre beard. A motorized specimen clamp grasps a thin slice of cotton fibres protruding from a mechanized comb. The comb drafts the cotton through a high-speed rotating brush cylinder to remove unbound, floating filaments and straighten the captured fibres.
This continuous brush motion creates a tapered specimen beard where all captured filaments share a single baseline clamp point. The prepared beard moves at a controlled velocity past a collimated, narrow light beam positioned opposite an array of silicon photodiodes.
The photodiode sensor array generates an analog voltage proportional to the optical transmission of the beard. A completely transparent region registers maximum transmission, while dense clusters near the clamping base attenuate the beam. The system computes the length distribution by processing this optical density gradient into an empirical span length curve.
The Upper Half Mean Length corresponds to the average length by number of the longest fifty percent of the examined fibres. The Length Uniformity Index represents the ratio between the mean length and the Upper Half Mean Length, expressed as a whole percentage.
A one-millimetre error in optical span calibration transfers a full grade deviation onto spinning-mill drafting settings.
Optical variance within the length measurement system stems from several distinct sources:
- Beard Density Nonuniformity creates erratic attenuation profiles when the specimen clamp fails to collect an even distribution of fibres across its full transverse width, causing local misreadings.
- Short Fibre Dislodgement during the automated combing cycle removes floating fibres under twelve millimetres, artificially shifting the calculated uniformity index toward a higher value.
- Specimen Crimp Persistence along the optical measurement axis distorts length readings if raw fibres maintain residual curvature, making them appear shorter than their true straightened physical dimensions.
- Calibration Tile Degradation from dust accumulation or surface micro-abrasions shifts baseline optical reference voltages, introducing systematic errors across continuous testing shifts.
Dust accumulation and broken fibre fragments deposit on the optical glass surface during high-throughput operation. Even slight particulate deposits scatter the collimated beam, decreasing baseline transmission voltage. The instrument software misinterprets this lower voltage as increased fibre mass in the beard.
Testing facilities clear these surfaces with filtered low-pressure air at defined cleaning intervals to maintain signal fidelity.
Suppliers frequently defend discrepancies by claiming natural field growth caused the variance between original classing certificates and arrival re-tests.

Tenacity
Pneumatic Clamp Jaw Dynamics and Fibre Rupture
Tensile strength evaluation on High Volume Instrument lines occurs immediately after optical scanning on the identical clamped beard. A second set of pneumatic jaws, lined with precision polyurethane or metal inserts, clamps the combed beard at an exact 3.175-millimetre distance from the base clamp. This displacement represents the universal one-eighth-inch gauge length specified in international testing standards.
The moving clamp accelerates outward along an electromechanical drive line at a steady displacement rate, loading the held fibres in pure tension until total mechanical rupture occurs.
The instrument records breaking force in grams-force or centinewtons using a piezoelectric load cell. Specific stress or tenacity expresses the ratio of breaking force to specimen mass within the broken ribbon. Because individual cotton fibres vary in wall thickness, direct gravimetric mass determination on the ruptured specimen is impossible within high-speed testing cycles.
The instrument software solves this limitation by calculating specimen mass through optical attenuation data gathered immediately prior to rupture. Tenacity in centinewtons per tex depends directly on the optical density calibration constant established by reference standard cottons.
| Property Metric | Standard Tolerance | Lab Reproducibility % | Between-Lab SD | Reference Test Method |
|---|---|---|---|---|
| Micronaire | 0.15 units | 98.5 | 0.07 | ASTM D5867 |
| Upper Half Mean Length | 0.76 mm (0.03 in) | 96.8 | 0.31 | ASTM D5867 |
| Length Uniformity | 1.5 % | 94.2 | 0.68 | ASTM D5867 |
| Tenacity | 1.5 cN/tex | 89.0 | 1.15 | ASTM D5867 |
| Color Rd (Reflectance) | 1.0 unit | 98.1 | 0.48 | ASTM D5867 |
| Color +b (Yellowness) | 0.5 unit | 97.4 | 0.26 | ASTM D5867 |
Tensile breakage variance demonstrates higher scatter than other physical measurements on the instrument line. Clamping jaw pressure requires tight regulation around 0.55 to 0.65 megapascals. Lower jaw pressures allow fibres to slip from the polyurethane pads during loading.
Clamp slippage flattens the force-displacement slope, creating an artificially extended elongation measurement and a suppressed tenacity value. Excessive jaw pressure crushes the fragile cellulosic cross-sections, producing mechanical stress concentrations that induce premature fibre breakage at the jaw boundary.
Fibre orientation within the drafted beard introduces additional variation into the measured breaking load. Parallel, straight fibres distribute the tensile load uniformly across the full clamped specimen ribbon. Poorly combed beards with crossed or tangled fibres experience progressive breakage, where early tension concentrates on isolated fibres before the main bundle can engage.
The instrument records this sequential failure as an artificially broad, low-peak rupture curve.
Calibration
Should Calibration Routines Dictate Sample Acceptance?
Traceability in High Volume Instrument testing rests entirely on USDA Universal Standard Cottons. These benchmark cottons supply reference values across international testing chains, ensuring stable performance limits for micronaire, length, uniformity, and tenacity. Benchmarks divide into Long Strong and Short Weak reference categories to bound the working measurement range.
Calibration checks run at mandatory intervals, typically four times per shift or after processing every two hundred bales. Instrument drift occurs over time as operating temperatures fluctuate, pneumatic pressures shift, and residue accumulates on mechanical surfaces.
Linear calibration equations correct raw hardware sensor voltages to match universal benchmark values. The slope and intercept coefficients calculated during baseline routines govern all subsequent test results. If the reference sample test yields values exceeding standard tolerance bands, the software recalibrates its sensor constants.
A reference cotton with an established 31.50-millimetre length tolerance band of plus or minus 0.38 millimetres allows slight systemic measurement bias to pass unchecked if recorded values remain within acceptable limits. Small initial biases will shift the entire population mean when evaluating incoming commercial lots.
A 0.5 cN/tex shift in calibrated tenacity baseline alters contract acceptance rates across entire regional ginning runs.
A rigorous calibration protocol follows a four-step diagnostic cycle:
- Atmospheric Verification confirms chamber temperature and relative humidity remain strictly within ASTM D1776 tolerances before running reference samples.
- Optical Tile Standardisation adjusts white and yellow ceramic references to maintain baseline colorimeter coordinates.
- Pneumatic Flow Zeroing balances vacuum pressure differentials across empty measurement chambers to eliminate thermal transducer drift.
- Standard Cotton Alignment runs multiple replicates of low and high benchmark standards to calculate operational slope and intercept corrections.
The statistical variance observed during routine calibration testing reveals whether instrumental drift or intrinsic material variation dominates test results. If standard cotton specimens yield a standard deviation higher than historical baselines, physical wear in mechanical assemblies is typically the root cause. Worn polyurethane clamp surfaces, leaking pneumatic gaskets, or fouled comb brushes all generate mechanical noise that cannot be solved through software recalibration.
Accepting borderline calibration runs degrades overall measurement precision across commercial operations. When an instrument drifts toward the edge of its tolerance window without failing outright, it increases testing variability across every bale evaluated during that shift. This compounding variance creates significant commercial discrepancies when testing identical cotton bales across different accredited facilities.
Every commercial testing contract should establish strict calibration frequency limits to govern sample validity.

Arbitration

Multi-Laboratory Limits and Commercial Penalties
Disputes in cross-border raw cotton trading center on discrepancies between initial classing data and buyer verification tests. Contracts under the International Cotton Association specify distinct tolerance bands for physical quality parameters. These boundaries account for inherent testing variability across separate testing facilities.
When independent verification measurements diverge beyond defined tolerances, the buyer gains the contractual right to demand financial arbitration or invoice discounts.
Testing discrepancies emerge from three interconnected sources: natural within-bale quality variation, distinct specimen preparation steps across testing lines, and environmental differences between testing locations. Natural within-bale variance forms the largest individual component, with single bales exhibiting internal length ranges up to 1.5 millimetres across different packing zones. Two testing laboratories can extract different core samples from opposing sides of a bale and return statistically distinct results on properly calibrated instruments.
To quantify commercial risk during dispute evaluations, consider a model shipment of 100 metric tonnes of upland cotton: approximately 440 universal density bales. The sales contract stipulates an Upper Half Mean Length of 28.50 millimetres, a minimum tenacity of 29.5 cN/tex, and a base micronaire range of 3.8 to 4.6 index points at an agreed price of 2.10 USD per kilogram. The total transaction value equals 210,000 USD.
The receiving mill executes a core testing audit on twenty percent of incoming bales, drawing 88 paired samples across the shipment.
| Measured Property | Contract Specification | Arrival Core Mean | Discount Level | Total Claim Value |
|---|---|---|---|---|
| Staple Length (UHML) | 28.50 mm (1-1/8 in) | 27.90 mm (1-3/32 in) | 1.50 % base price | 3,150 USD |
| Bundle Tenacity | 29.50 cN/tex | 28.10 cN/tex | 1.00 % base price | 2,100 USD |
| Micronaire Reading | 3.80 to 4.60 | 3.62 index (Low range) | 2.00 % base price | 4,200 USD |
| Color Grade (Rd) | 78.0 minimum | 74.2 (Spotted class) | 3.50 % base price | 7,350 USD |
| Short Fibre Content | 8.0 % maximum | 10.4 % | 1.25 % base price | 2,625 USD |
When arrival test results fall outside contracted tolerance limits, penalty calculations apply directly to the final invoice. If the length variance drops the verified mean by one thirty-second of an inch below agreed thresholds, contract terms enforce an automatic quality penalty. A micronaire drop into the discounted category incurs additional tiered charges.
Combined discrepancies compound across the whole shipment, quickly eroding margins if dispute tolerances are poorly defined.
The ICA arbitration rules establish that arrival re-tests supersede original certificates only when deviations exceed published mutually agreed testing thresholds. If arrival tests show Upper Half Mean Length variance within 0.76 millimetres, original commercial valuations remain binding. When measured deviations exceed this limit, the second testing laboratory conducts mandatory duplicate runs.
The mean of these paired arbitration tests becomes the binding legal value for calculating final contract settlement figures.
Unclear contract clauses governing sampling depths, testing temperatures, or arbitration thresholds reliably convert natural testing variance into costly commercial disagreements between shippers and spinning mills.

Sorting
Warehouse Lot Selection and Spinning Mill Performance
Spinning mills consume cotton across multi-bale opening lines to produce consistent slivers. A standard automated blowroom line blends cotton from thirty to sixty opened bales simultaneously using a reciprocating plucker. The blend strategy relies on automated bale management software to smooth quality fluctuations across individual bales.
The software groups incoming bales into narrow property bands, distributing high and low extremes evenly across continuous production runs.
Within-bale variation identified in core tests creates hidden challenges for blowroom blending. High Volume Instrument tests capture property values from a single local core plug, but reciprocating pluckers harvest fibres across the full bale height in thin horizontal layers. If internal properties vary sharply between outer faces and the bale core, the actual fibre composition delivered to the carding machines drifts away from planned targets.
Micronaire fluctuations in the carded web lead to uneven dye uptake in finished woven or knitted fabrics.
Yarn manufacturing costs increase when fibre property variance is improperly managed during warehouse sorting. Elevated short fibre content combined with weak tensile strength directly increases yarn end-break rates on ring spinning and open-end rotor frames. Each broken end interrupts the spinning spindle, reducing machine efficiency and requiring manual piecing that introduces thick defects into the spun yarn.
The table below illustrates carding and spinning outcomes across different cotton property variations.
| Fibre Property Shift | Carding Speed Impact | Comber Noil Loss % | Spindle Break Rate | Yarn Tenacity (Rkm) |
|---|---|---|---|---|
| Length Deficit (-0.8 mm) | Maintained nominal | +1.8 to +2.5 % | +12 breaks / 1000 sp-hr | -1.2 to -1.8 cN/tex |
| Low Tenacity (-2.0 cN/tex) | Maintained nominal | Negligible change | +18 breaks / 1000 sp-hr | -2.2 to -2.6 cN/tex |
| Micronaire Drop (-0.4) | Reduced by 10 % | +2.0 to +3.2 % | +8 breaks / 1000 sp-hr | -0.5 to -0.8 cN/tex |
| Short Fibre Increase (+3 %) | Reduced by 15 % | +3.5 to +4.8 % | +25 breaks / 1000 sp-hr | -1.8 to -2.4 cN/tex |
Effective warehouse bale management relies on robust statistical grouping rather than isolated point values. Sourcing managers establish target ranges for length, strength, and micronaire, setting absolute coefficient of variation thresholds across every laydown. If incoming lot variation exceeds historical norms, the warehouse team divides the bales across a higher number of production mixes to dilute individual bale extremes.
This statistical smoothing stabilizes drafting operations through drawframes and roving processes.
A rigorous quality management system evaluates incoming raw material through continuous statistical process control. Plotting length uniformity and bundle tenacity on daily control charts highlights supplier-specific quality shifts before raw bales enter the opening room. When incoming lots exhibit unstable variance, yarn engineering models correctly predict reductions in spinning speed and comber yield adjustments needed to protect target yarn parameters.
Failure to isolate unstable bale core lots in the warehouse passes raw material variance directly through to finished yarn and fabric manufacturing.