Bimodal Process Variance Optimization under Non Gaussian Edge to Middle Restricted Chemical Distributions
Bimodal chemical variance requires zone-specific edge and center testing to prevent composite dilution from masking localized regulatory threshold failures.
Profile
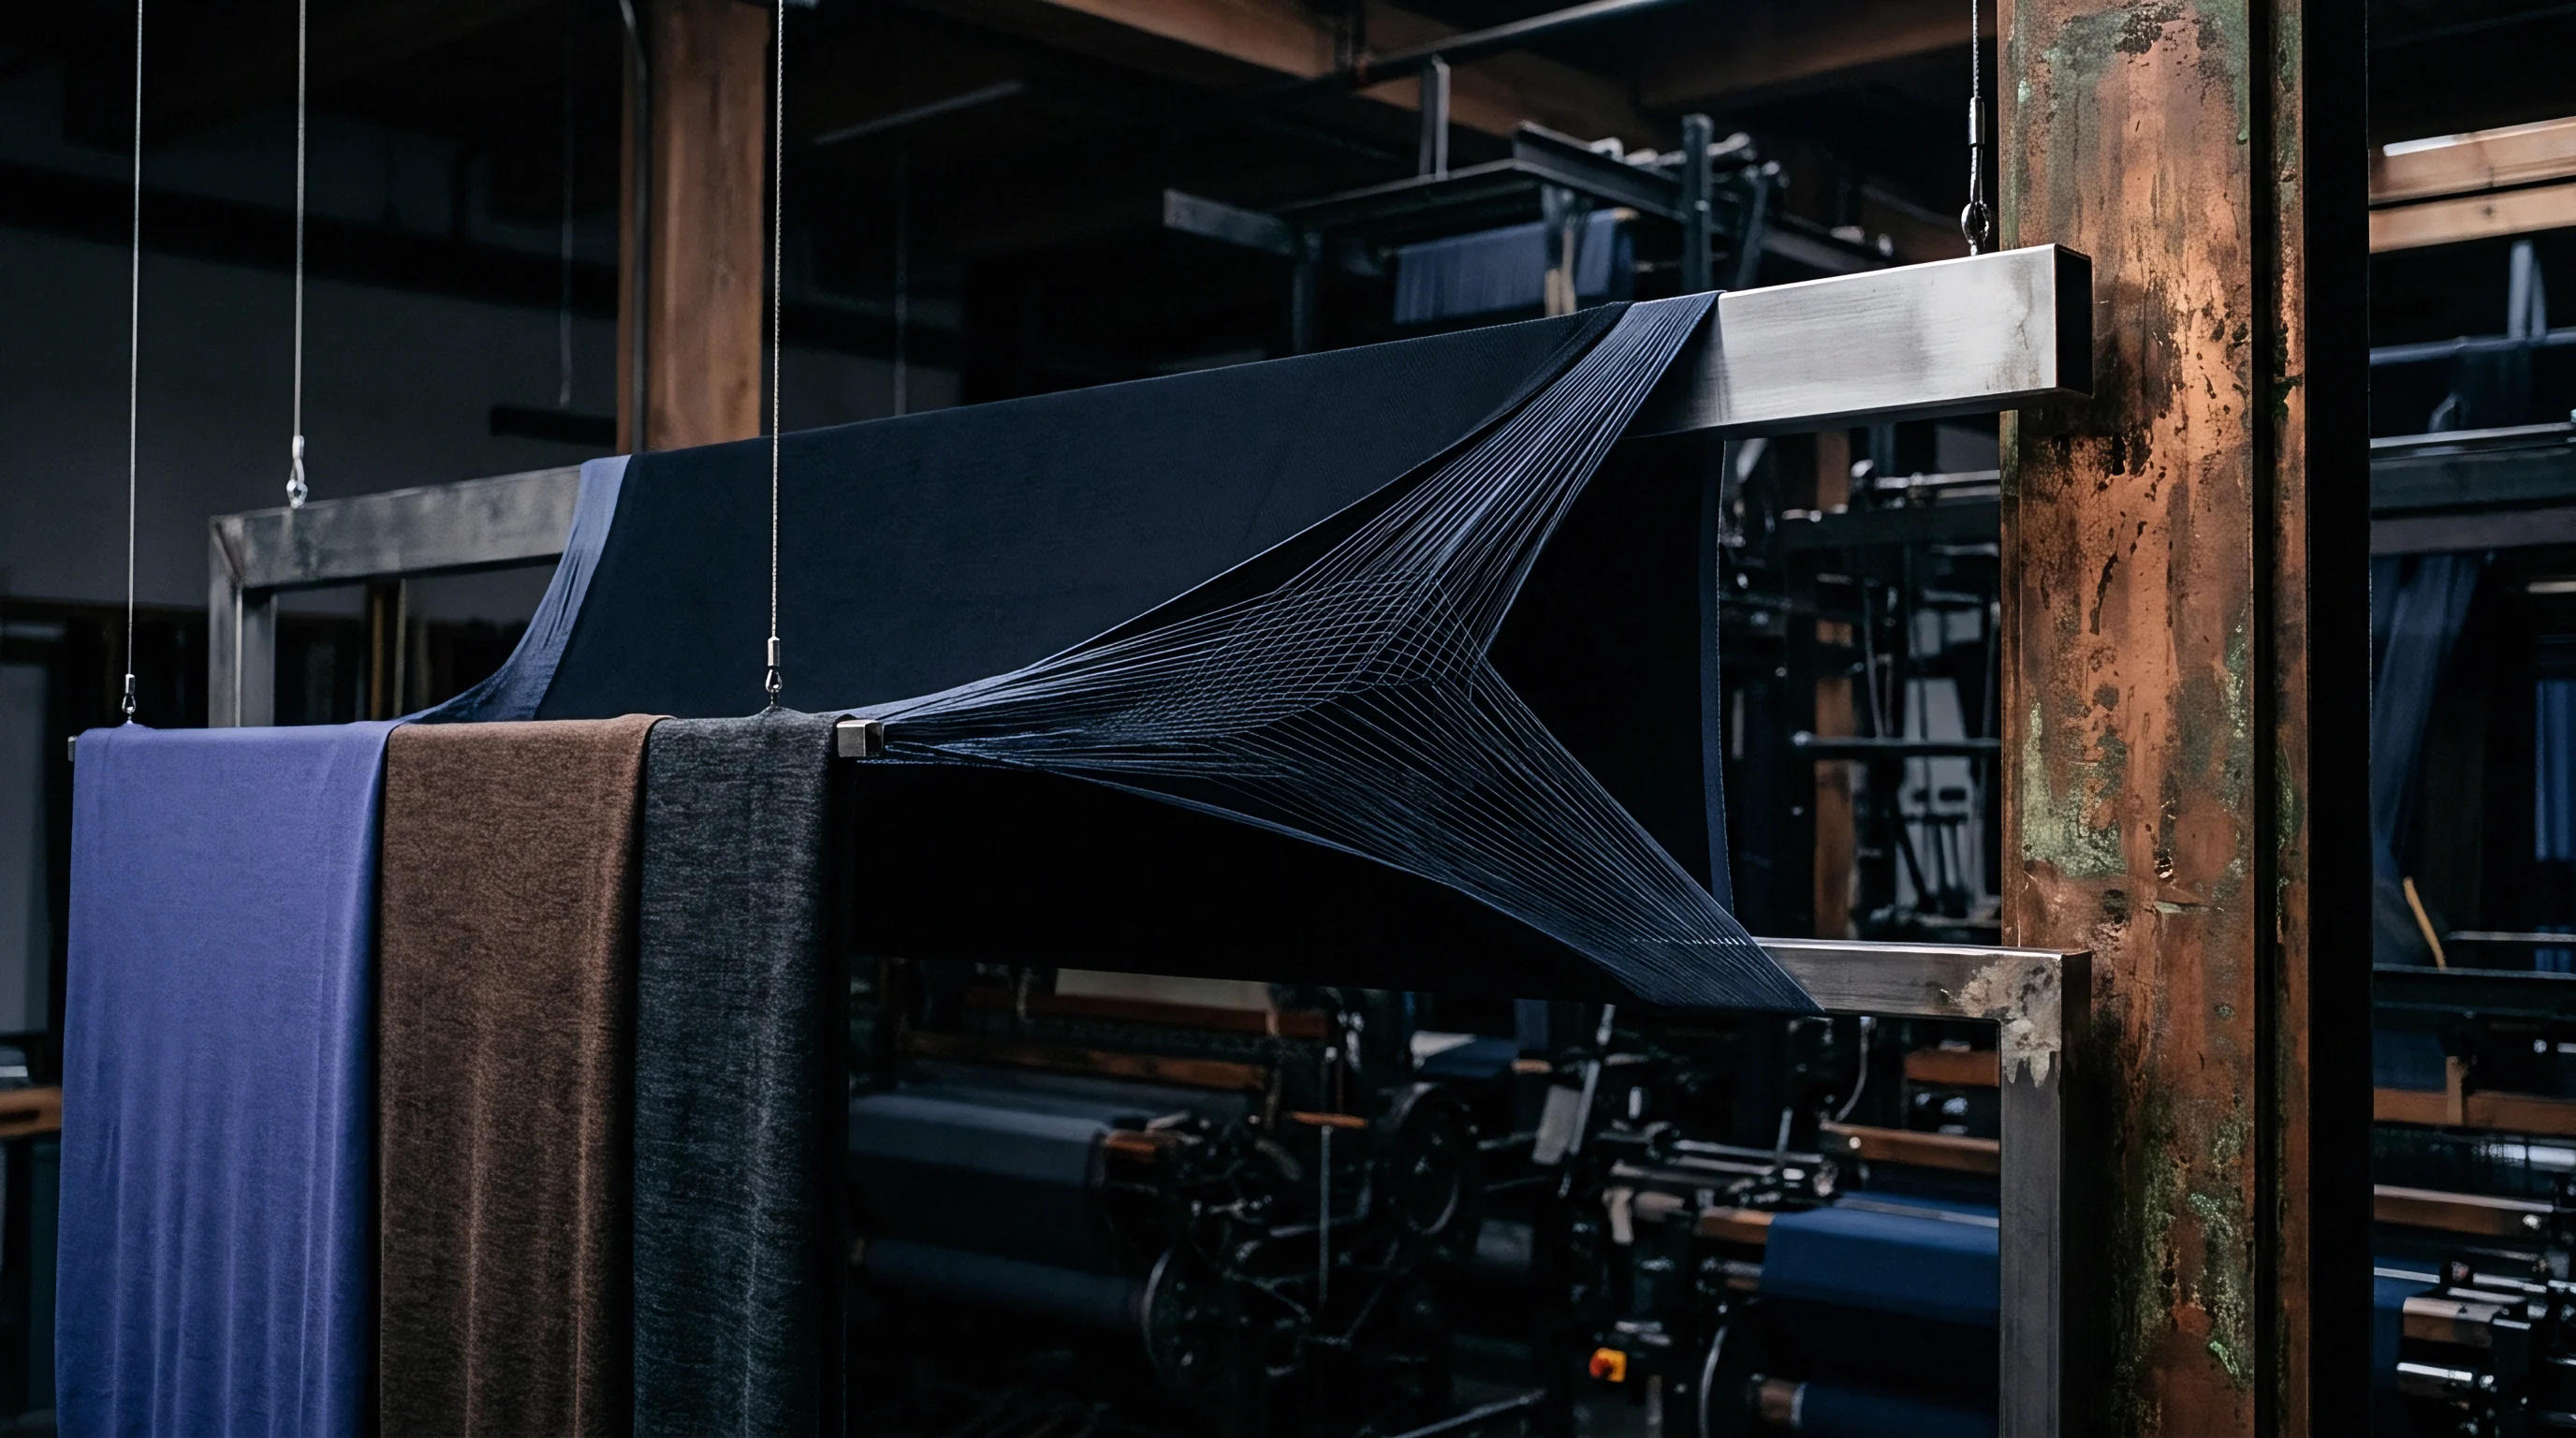
Continuous textile finishing lines run on an uneven transverse plane. When a woven or knitted fabric passes through an impregnation padder, chemical liquor redistributes across the width under unequal nip pressure, differential drying rates, and convective boundary layer airflow inside the stenter. The resulting concentration of finish chemistry does not arrange itself along a single normal bell curve.
Cross-roll analytical testing repeatedly reveals two discrete mathematical peaks: one concentration regime occupying the two fabric edges near the pin chains or clips, and a secondary concentration regime across the fabric center. This constitutes a classic bimodal edge-to-middle distribution.
The operational danger emerges when restricted substances hide within these finish systems. Alkylphenol ethoxylates in wetting agents, fluorochemical traces from legacy durable water repellents, formaldehyde from cross-linking glyoxal resins, and organotin residues from catalysts show strict maximum concentration thresholds under international regulations and voluntary eco-certifications. A batch running OEKO-TEX STANDARD 100 Class I compliance for baby articles faces an extractable formaldehyde threshold of 16 milligrams per kilogram.
Under standard European Union REACH Annex XVII entry 72 restrictions, selected CMR compounds in consumer apparel carry a legal cap of 30 milligrams per kilogram.
A laboratory report declaring a lot compliant based on swatches taken fifteen centimeters from the selvedge leaves central panel non-compliance legally active.
Standard quality assurance relies heavily on parametric capability indices. Mill managers calculate process capability metrics by aggregating thirty specimens gathered indiscriminately across a production run. Because the underlying data comprises two superimposed normal populations with distinct means and standard deviations, standard arithmetic averaging produces a severe statistical illusion.
The aggregate arithmetic mean drifts toward the central tendency, while the calculated standard deviation inflates to span the bimodal gap. Quality controllers assume a capable process based on calculated indices, yet the actual fabric edges or roll center persistently cross regulatory ceiling limits.
Regulatory authorities and brand audit laboratories do not pull fifty wide specimens and average their chemical concentrations. Under customs market surveillance protocols across the European Union, market surveillance authorities take a targeted grab swatch from an imported garment. If that garment came from the high-density edge zone of a wide-width stenter run, the extraction value registers the upper mode of the chemical distribution.
Customs seizes the consignment regardless of the supplier roll-average report.
Suppliers routinely insist that wet pickup was adjusted to a nominal sixty-five percent across the entire foulard bowl.

Trough
Liquor application begins inside the pad trough. As greige or pretreated goods enter the chemical bath, fabric absorptive capacity changes based on yarn tension and yarn density. The edges of the open-width fabric run under lower warp tension than the center.
Lower tension permits looser yarn spacing, promoting faster capillary uptake of the bath liquor. As the fabric leaves the dip and meets the pad rollers, mechanical deflection of the squeeze bowls creates the primary physical variance.
Industrial foulards utilize rubber-covered steel bowls spanning widths from 180 to 340 centimeters. Hydraulic or pneumatic cylinders apply compressive loading at the roll journals. Unless the padder uses a crowned rubber profile, an internally pressurized swimming roll, or mechanical cambering, the applied load deflects the cylinder core.
Compression pressure reaches its maximum near the journal ends and drops to its minimum at the physical midpoint of the bowl. The center of the fabric web receives less mechanical expression than the edges.
Capillary transport accelerates downstream during drying. The fabric enters the initial drying chambers carrying a non-uniform moisture profile. Infrared pre-dryers and hotflue nozzles direct high-velocity heated air onto both faces of the moving web.
The fabric selvages dry significantly faster than the wet center due to three factors:
- Boundary Layer Thinning reduces convective heat transfer resistance along the extreme lateral perimeters of the fabric web where airflow forms turbulent vortices.
- Metallic Chain Heat conducts additional thermal energy directly through pin plates or clip assemblies into the fabric borders, raising local evaporation rates.
- Solute Migration Flux pulls mobile chemical molecules toward areas of elevated water evaporation, depositing high concentrations of auxiliaries right inside the pin margin.
The transport of water-soluble crosslinkers and anti-pilling chemicals follows the evaporating water front. This physical phenomenon, known in wet processing as intermediate migration, concentrates dissolved finishes at the drying hot spots. The dry selvage acts as a continuous moisture sink.
Water wicks laterally from the humid central zone toward the selvages, carrying resin pre-condensates, free catalysts, and residual solvent carriers into the outer ten percent of the fabric width.
| Process Station | Physical Variable | Edge Value | Center Value | Variance Driver |
|---|---|---|---|---|
| Padding Foulard | Linear Nip Pressure | 42 N/mm | 31 N/mm | Journal load roll core bending deflection |
| Padding Foulard | Wet Pickup | 58 percent | 74 percent | Inadequate camber profile compensation |
| Infrared Pre-Dryer | Surface Temperature | 124 deg C | 98 deg C | Uneven quartz emitter radiation geometry |
| Stenter Air Nozzles | Air Velocity | 28 m/s | 19 m/s | Side exhaust duct plenum pressure drop |
| Pin Chain Track | Direct Conductive Heat | 165 deg C | Ambient | Thermal mass of return chain links |
When the fabric exits the curing section, the finished roll contains two overlapping chemical realities. Across the outer margins, intense drying drives chemical saturation. Across the wide center, higher residual moisture retards initial fixation, concentrating unreacted resins during late-stage evaporation.
The chemical distribution splits into two distinct modes across the fabric width. Adjusting simple process levers like stenter line speed shifts both peaks simultaneously without collapsing the distance separating them.
Thermal migration during curing fixes this split permanently into the cellulose matrix.

Metric
Why Do Classical Process Capability Indices Fail?
Standard manufacturing control relies on the assumption of a normal Gaussian distribution. When quality teams calculate capability using standard formulations, they compute the distance between the process average and the specification limits divided by three standard deviations. The mathematical architecture of this calculation assumes a single unimodal curve centered within the tolerance band.
When bimodal edge-to-middle segregation occurs, the aggregate sample variance reflects the sum of within-mode variance and between-mode variance. The combined distribution exhibits negative excess kurtosis or platykurtic behavior with two distinct probability densities. The calculated standard deviation balloons.
This inflated standard deviation penalizes the standard capability index calculation, indicating an out-of-control process even when both individual modes sit entirely inside the legal tolerance window.
The inverse failure presents an even greater commercial hazard. If the two modes are spaced widely apart, the simple arithmetic mean falls precisely into the valley between the two peaks. If an engineer sets nominal target dosing based on this false central mean, the upper mode breaches the upper specification limit while the aggregate mean remains safely centered.
The classical index reports a compliant process, yet every meter of fabric cut from the edge zone violates restricted substance limits.
A calculated process capability index exceeding 1.33 provides zero legal protection when the underlying sample distribution breaks into two uncoupled modal populations.
Statistical optimization under edge-to-middle bimodal constraints mandates decomposing the dataset into finite mixture models. The chemical concentration across the fabric width must be evaluated as two separate parametric distributions weighted by their geometric area proportions across the roll width. Expectation-Maximization algorithms separate the observed density into an edge population and a middle population, generating individual location and scale parameters for each zone.
- Decompose Transverse Data by isolating chemical assay values into distinct geometric bins across the roll width, separating outer margins from center cuts.
- Estimate Modal Parameters using maximum likelihood estimation to establish individual mean and variance values for both edge and center regimes.
- Calculate Segment Capability by evaluating each sub-population against restricted substance limits using boundary-specific standard deviations.
- Optimize Overlapping Densities through foulard crown adjustments until the joint probability of upper specification breach across both zones reaches the target parts-per-million threshold.
Once separated, optimization focuses on shrinking the distance between the two modal means. True chemical uniformity occurs only when the edge distribution mean matches the middle distribution mean within analytical measurement uncertainty. Traditional continuous improvement methodologies stall because line supervisors treat chemical variation as random noise rather than systematic mechanical-thermal segregation.
A buyer applying unimodal statistics to cross-roll chemical testing unknowingly accepts an unquantifiable rate of border seizure.


Sampling

Should Laboratories Blend Edge and Center Swatches?
Commercial testing laboratories frequently commit an error during sample preparation. When an inspection agency pulls a full-width fabric cut from a finished roll, technicians routinely cut multiple swatches across the width, dice them into small fragments, combine them in an extraction vessel, and shake them to create a single composite test solution. This preparation method is known in analytical chemistry as composite homogenization.
Homogenization physically computes a mechanical average of the fabric chemistry before the extract reaches the chromatography column. The high concentration of a restricted chemical residing at the selvage dissolves into the larger solvent volume alongside the cleaner central fabric. The resulting concentration reported by gas chromatography-mass spectrometry or liquid chromatography-tandem mass spectrometry drops below the reporting limit of the equipment.
The mill receives a passing test certificate, and the garment factory cuts the roll into panels.
| Sample Position | Distance from Edge | Assay Value (mg/kg) | EN ISO 14184-1 Limit | Compliance Status |
|---|---|---|---|---|
| Left Selvage Margin | 5 cm | 28.4 | 16.0 mg/kg | Definite Failure |
| Left Intermediate Panel | 45 cm | 18.2 | 16.0 mg/kg | Definite Failure |
| Center Web Panel | 140 cm | 7.6 | 16.0 mg/kg | Conforming Pass |
| Right Intermediate Panel | 235 cm | 19.1 | 16.0 mg/kg | Definite Failure |
| Right Selvage Margin | 275 cm | 31.5 | 16.0 mg/kg | Definite Failure |
| Composite Whole-Width Blend | Blended Full Width | 14.8 | 16.0 mg/kg | False Positive Pass |
A pattern-maker lays cutting markers across the full width of the delivered cloth. In a typical markers layout, sleeve panels, collars, and waistbands fall directly along the selvage margins to maximize markers efficiency and minimize fabric scrap. The finished garments produced from these edge panels contain chemical concentrations matching the upper mode of the original roll distribution.
When a consumer protection agency tests one of these isolated collars, the composite test certificate issued to the mill becomes legally irrelevant.
Testing protocols must stipulate zone-specific extraction. Swatches cut within ten percent of either selvage must undergo individual solvent extraction without mixing with center-cut material. If a brand sources wide goods exceeding two meters, five discrete extraction zones represent the absolute minimum analytical resolution: left edge, left center, middle, right center, and right edge.
This granularity exposes the underlying bimodal distribution and prevents mills from concealing edge non-compliance behind composite dilutions.
A master purchase agreement specifying whole-width composite testing transfers entire chemical liability to the apparel importer of record.

Recourse
Managing non-Gaussian chemical variance requires precise commercial documentation. Standard purchase orders state that goods shall comply with OEKO-TEX STANDARD 100 or REACH Annex XVII without identifying sampling geography or statistical distributions. When a container faces rejection at an EU or American port of entry, mills point to whole-width laboratory test reports showing passing average values.
Without explicit testing clauses, proving breach of contract becomes exceptionally complex and costly.
Procurement agreements must define the exact physical sampling geometry and statistical acceptance criteria. The contract must mandate that no individual zone across the usable width shall exceed the specified restricted substance threshold. By eliminating composite averaging from the legal definition of conformity, the brand forces the finishing plant to tune padder nip profiles, adjust air ducting dampers, and calibrate infrared pre-drying zones before initiating bulk production.
When an edge failure occurs during incoming lot audits, the dispute centers on laboratory arbitration. Mills argue that trimming the selvages resolves the issue. Trimming five centimeters from each margin removes the most extreme peak, but it reduces the usable fabric width below purchase order specifications.
If the pattern room cannot lay the markers on the narrowed width, the entire lot is rendered commercially useless. Re-curing or post-washing the fabric to strip surface chemicals introduces color shifts, shrinkage, and loss of tensile strength.
Does mechanical re-cambering of the foulard roll eliminate the edge-to-middle chemical concentration divide across wide-width technical textiles without altering surface hand?