Kinetic Modeling of Salt Mediated Dye Penetration Boundaries in Heavy Ring Spun Twills
Linear salt dosing coupled with controlled liquor flow balances surface exhaustion and pore diffusion to eliminate core pale zones in heavy ring spun twills.

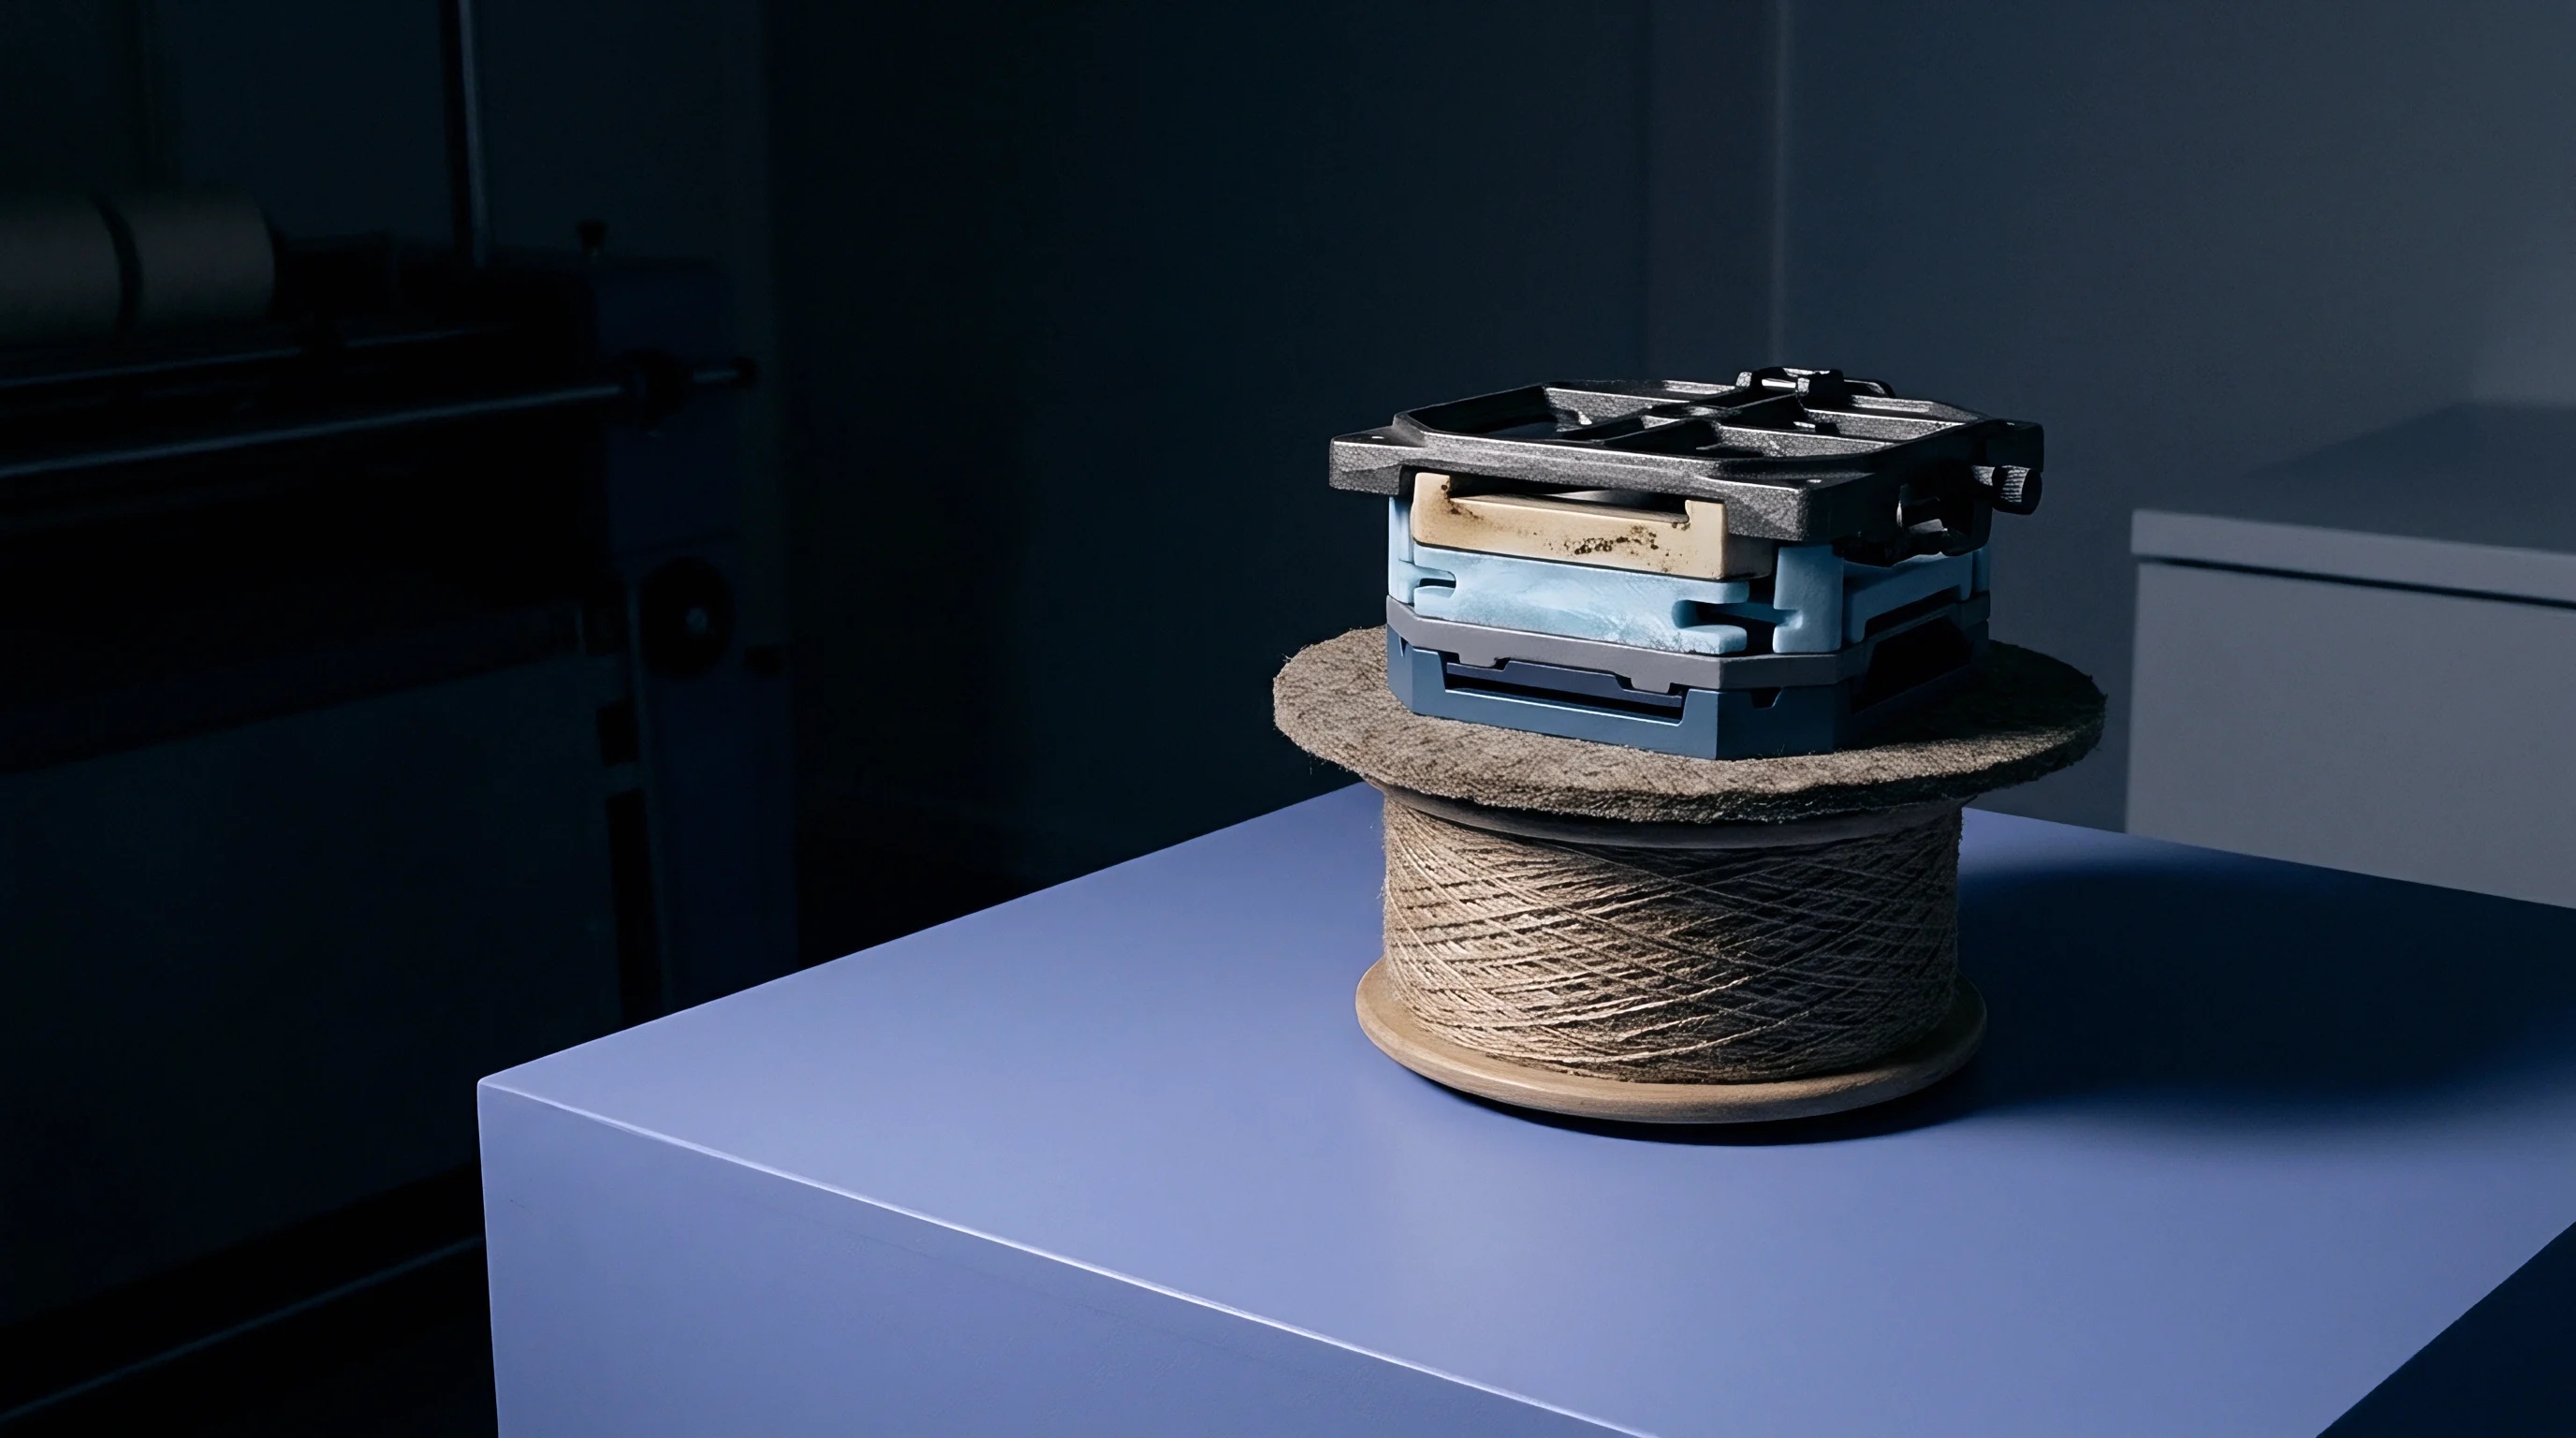
Gradient
Heavy twill fabrics made from ring-spun yarns show sharp density differences between their outer sheath and inner fiber core. In aqueous dye baths, high yarn twist suppresses convective flow, leaving mass transfer almost entirely to capillary movement and diffusion. The heavy fabric mass ~ typically 380 GSM to 520 GSM in 3/1 twill weaves ~ compounds this resistance.
Outer yarn surfaces take up dye rapidly on initial liquor contact, while the tightly packed interior fibers stay unexposed during early bath stages.

Boundary Mechanics in Heavy Ring Spun Twills
Initial wetting forces dye liquor into the voids between yarns. Inside each ring-spun yarn, fibers twisted under tension form a clear radial compaction gradient: the fiber volume fraction near the core often exceeds 0.65, while the outer sheath sits below 0.35. This density gap resists the inward radial migration of large reactive dye molecules.
Dissolved dye aggregates build up around the yarn perimeter, creating a sharp boundary between heavily dyed surface fibers and pale or undyed cores.
Adding salt shifts this equilibrium. Electrolytes like sodium sulfate lower the negative surface charge on cotton fibers, driving rapid surface adsorption. If electrolyte levels climb too quickly, surface sorption runs far ahead of internal diffusion.
Dye molecules fix to exterior fibers before capillary movement carries the liquor into the center. This produces high surface shade depth alongside severe ring dyeing, exposing pale fiber cores when the finished fabric is washed or abraded.
At a liquor ratio of 1:8 and a sodium sulfate concentration of 60 g/L, reactive dye surface adsorption reaches 78 percent within 15 minutes while interior penetration remains below 22 percent of yarn radius.
Failure to control the rate of boundary migration creates long-term quality risks for heavy twills. Outer surface saturation yields satisfactory visual shade matching in early inspections, but subsequent processing reveals severe performance deficits. Common operational failures linked to uncontrolled boundary gradients include:
- Unbalanced Surface Crockfastness where heavy dye deposition on exterior fibers causes dry rubbing fastness to drop below Grade 3 under ISO 105-X12 testing.
- Abrasion Streak Formation occurring when garment washing strips outer fibers, exposing un-dyed white yarn cores along high-wear seams and pocket edges.
- Metameric Shade Shifting caused by uneven dye concentration profiles across the yarn diameter altering light scattering under secondary illuminants.
- Differential Enzymatic Washout where cellulase treatments remove heavily dyed sheath fibers, rapidly degrading shade depth and tone consistency.
Dyehouse technicians often attribute core pale zones in heavy ring-spun twills to yarn spinning oil residues rather than bath exhaustion rates.


Twist
Yarn packing density dictates how much void space remains accessible to dissolved dye molecules. Ring spinning uses high torsion to lock fibers into tight concentric helices. Warp yarns from 10s Ne to 14s Ne require twist multipliers between 4.2 TM and 4.8 TM to meet durability targets for heavy twill.
This compact structure restricts fluid movement through internal channels, lowering the effective diffusion coefficient of dye within the yarn bundle.

Fiber Packing Density and Radial Porosity Profiles
Radial porosity in ring-spun cotton drops exponentially from the outer edge toward the axis. Average pore radius drops from roughly 12 micrometers at the perimeter to under 2 micrometers at the core. Dye liquor fills larger outer pores through rapid bulk flow but meets severe microporous resistance deeper inside.
Because hydrodynamic resistance scales inversely with the fourth power of pore radius, fluid flux slows dramatically near the yarn center.
Fabric geometry compounds these yarn-level diffusion barriers. In a 3/1 warp-faced twill, warp yarns float over three wefts, combining long open face segments with tightly pinched crossover crowns. High yarn packing paired with a heavy cover factor (76 ends/inch warp sett, 44 picks/inch weft sett) compresses these intersections under weaving tension.
The resulting local pinch points block flow between yarns, leaving radial diffusion as the primary path into the fiber assembly.
| Yarn Count (Ne) | Twist Multiplier (TM) | Fabric Weight (GSM) | Pore Radius Core (μm) | Boundary Depth (% Radius) |
|---|---|---|---|---|
| 8s / 1 | 4.6 TM | 510 GSM | 1.8 μm | 28 % |
| 10s / 1 | 4.4 TM | 450 GSM | 2.4 μm | 36 % |
| 12s / 1 | 4.2 TM | 410 GSM | 3.1 μm | 45 % |
| 14s / 1 | 4.0 TM | 380 GSM | 4.0 μm | 58 % |
Selecting yarn specifications for heavy twill production requires balancing mechanical durability against dye liquor accessibility. Key yarn construction criteria govern dye penetration depth across heavy twill weight classes:
- Twist Factor Selection keeping warp yarn twist multipliers between 4.0 TM and 4.3 TM to avoid over-compacting yarn core fibers during spinning.
- Fiber Staple Length Uniformity utilizing combed cotton fibers exceeding 1-1/8 inch staple to maintain yarn strength without requiring excessive twist insertion.
- Loom Reed Tension Control lowering warp sheet tension during weaving to prevent excessive flattening and compression at twill crossover crowns.
- Sizing Removal Efficiency enforcing total desizing to ensure complete removal of hydrophobic starch films blocking pore entrances across warp floats.
Higher twist multipliers produce sharper boundary delineation between the dyed outer sheath and the undyed inner fibers.
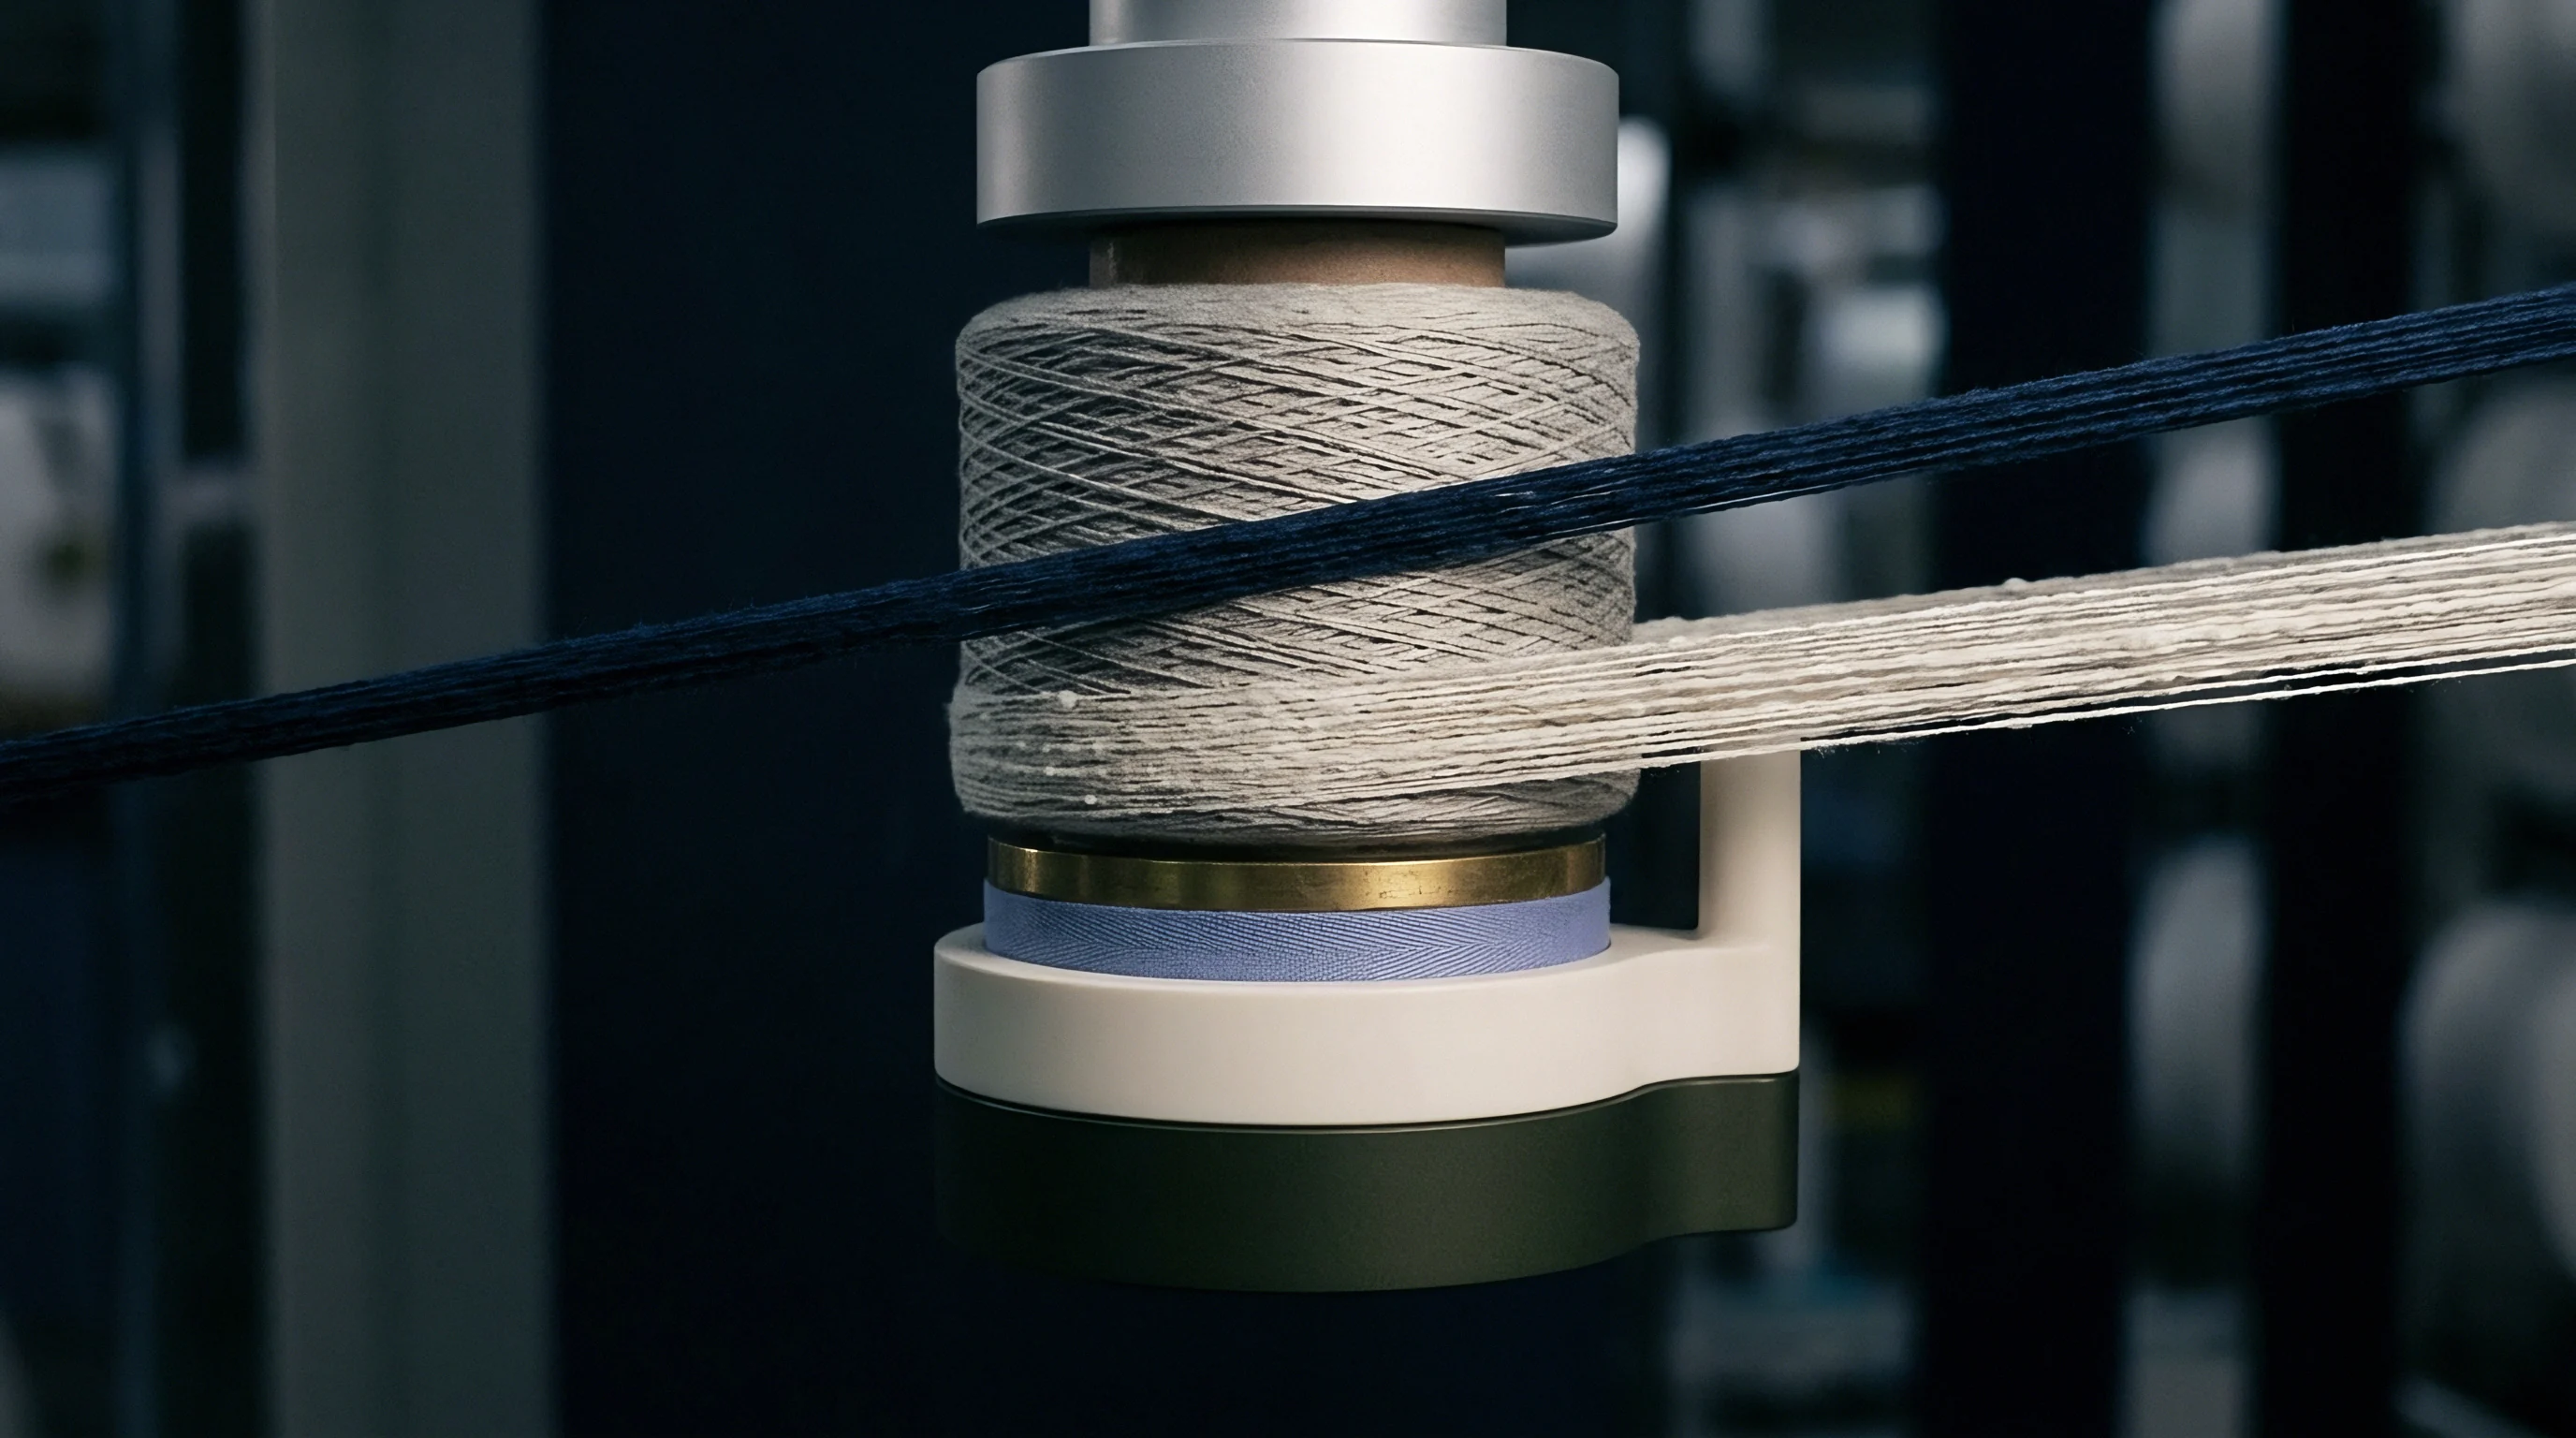

Electrolyte
Sodium sulfate suppresses the negative electrical potential on cotton fiber surfaces. In neutral water, cotton carries a negative zeta potential between -15 mV and -30 mV, which electrostatically repels reactive dye anions. Adding salt introduces sodium cations that screen this charge, allowing dye molecules to move within range for chemical bonding.

Kinetic Modeling of Salt Mediated Adsorption
Modeling salt-mediated penetration relies on modified Fickian diffusion that accounts for electro-kinetic equilibrium. The apparent diffusion coefficient (Deff) of reactive dye inside the bundle depends directly on electrolyte concentration (Cs) and local porosity (ε). Higher salt levels accelerate the surface exhaustion rate (ke) exponentially:
ke = k0 · exp(b · Cs)
where k0 is the intrinsic kinetic rate constant and b is the ionic screening parameter. If Cs is elevated early in the cycle, ke rapidly outpaces internal pore diffusion (Dpore). Dye aggregates on outer fibers, building a saturated surface boundary that strips dye from the advancing liquid front.

How Does Salt Dosing Profile Alter Penetration Depth?
The timing of salt addition controls where dye sits in the yarn cross-section. Adding all electrolyte up front quickly drops zeta potential, triggering rapid surface exhaustion. The dye front moves through outer pores but depletes before reaching the center.
By contrast, progressive dosing keeps salt levels low during early bath phases, delaying surface binding so unattached dye can diffuse deep into interior capillaries under thermal agitation.
| Sodium Sulfate (g/L) | Zeta Potential (mV) | Surface Exhaustion Rate (%/min) | Diffusion Coeff (10⁻¹¹ m²/s) | Core Boundary Velocity (μm/min) |
|---|---|---|---|---|
| 20 g/L | -18 mV | 1.2 %/min | 4.5 m²/s | 1.8 μm/min |
| 40 g/L | -10 mV | 2.8 %/min | 3.1 m²/s | 1.2 μm/min |
| 60 g/L | -4 mV | 5.4 %/min | 1.8 m²/s | 0.6 μm/min |
| 80 g/L | -1 mV | 8.9 %/min | 0.9 m²/s | 0.2 μm/min |
When salt dosing runs faster than thermal migration, surface fibers absorb up to 90 percent of the dye, leaving inner fibers uncolored. Holding back initial salt dosing extends the migration window, allowing dye to distribute across the yarn cross-section before alkali addition triggers fixation.
Failure to achieve a minimum 60 percent dye penetration boundary across the yarn cross-section triggers automated rejection under ISO 105-X12 crocking compliance thresholds.
Section 4.2 of the mill delivery specification converts shade rejection from a visual grading dispute into a non-conformance charge when core penetration falls below fifty percent of the yarn radius.


Kinetics
Progressive dosing schedules regulate surface exhaustion rates in dense cotton assemblies. Holding the bath at 60 °C while metering sodium sulfate over 45 minutes prevents surface saturation from spiking. Controlled dosing keeps surface exhaustion at or below the rate of internal radial diffusion, ensuring liquor penetrating inner capillaries retains an active dye concentration.
Capillary Migration and Mathematical Boundary Modeling
The advance of the dye boundary (δ) over time (t) follows a modified pore diffusion model with salt-dependent boundary equilibrium:
fracdδdt = fracDeffδ · left( fracCsurface – CinteriorCsurface right)
where Csurface is dye concentration at the outer yarn perimeter and Cinterior is concentration at the advancing front. If sudden electrolyte addition spikes Csurface, a steep initial gradient drives fast boundary movement, but rapid local sorption soon depletes Csurface, causing dδ/dt to stall before δ reaches the core.
Calibrating jet dyeing machines for heavy ring-spun twills requires systematic adjustments to liquor flow rates, salt dosing curves, and temperature ramps. Execution follows a defined kinetic control sequence:
- Charge the dye vessel with scoured twill fabric and soft water at a liquor ratio of 1:8, establishing main bath circulation at 60 °C.
- Inject dissolved reactive dye over 15 minutes without salt additions, allowing un-bound dye molecules to distribute uniformly throughout inter-yarn capillaries.
- Initiate progressive salt dosing using a non-linear parabolic profile, introducing 10 percent of total sodium sulfate over the first 15 minutes, 30 percent over the next 15 minutes, and the remaining 60 percent over the final 15 minutes.
- Hold the bath at 60 °C for 20 minutes post-dosing to allow radial equalization of dye concentration between yarn sheath and interior fibers.
- Dose soda ash alkali solution over 30 minutes to initiate covalent fixation only after microtome sampling confirms core penetration exceeds 65 percent of yarn radius.
Extending salt dosing over a progressive parabolic curve reduces surface boundary sharpness and yields uniform penetration across dense ring-spun yarn structures.
Skipping hold steps between salt addition and alkali fixation leads to severe ring dyeing. Fixing this requires costly strip-and-redye cycles that degrade fiber quality and add up to 0.45 EUR per meter to landed fabric costs.
Premature salt injection causes superficial ring dyeing that rubs off under abrasive wear, forcing full batch reprocessing and unbudgeted liquor treatment cycles.

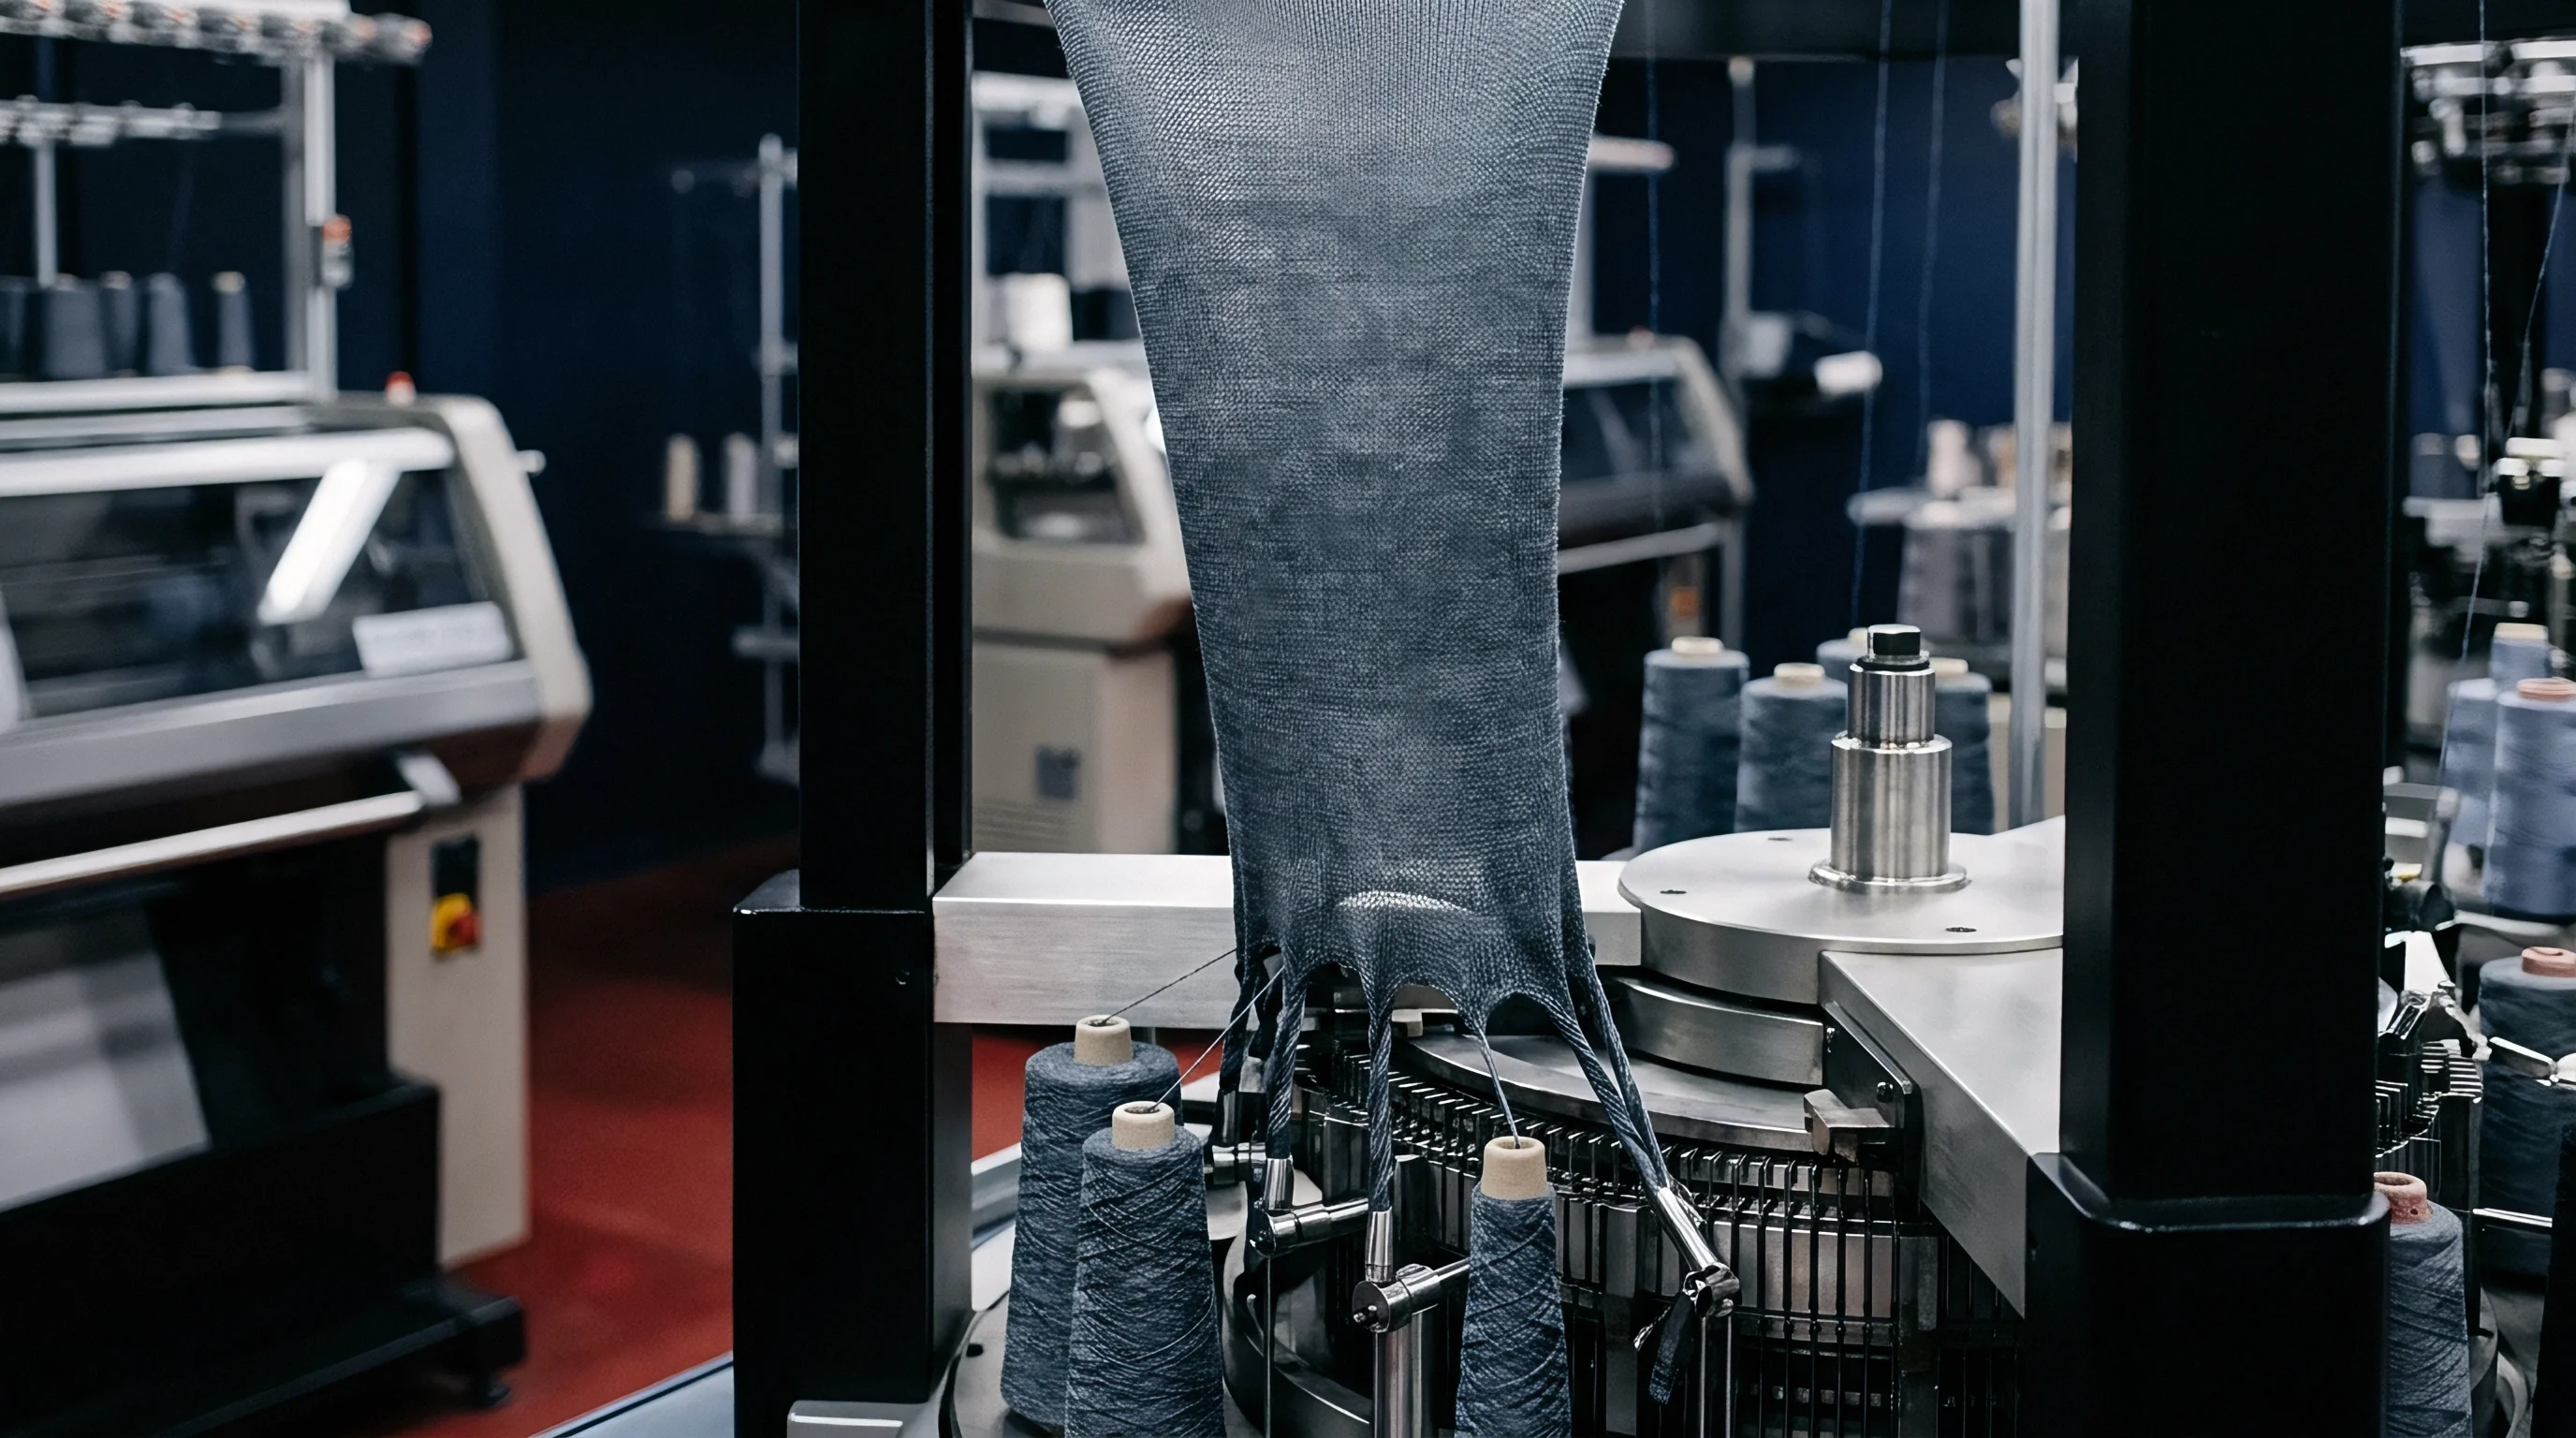
Fixation
Adding alkali initiates covalent bonding between reactive dye molecules and hydroxyl groups on cellulose chains. Sodium carbonate elevates bath pH from 6.8 to 11.2, converting hydroxyls into nucleophilic cellulosate anions. Once fixation occurs, dye molecules can no longer migrate through pores, making the spatial distribution at alkali addition permanent.
Fixation Kinetics versus Internal Diffusion Velocity
Dye fixation must proceed more slowly than internal diffusion during initial alkali dosing. If alkali is added too quickly, substitution or addition reactions fix dye at the yarn perimeter in minutes. The reaction rate constant (kfix) outpaces diffusion (Deff), freezing the boundary layer in place; any unfixed dye inside the core washes out in subsequent rinsing, leaving an uncolored interior.
| Dosing Curve Type | Liquor Ratio | Fixation Yield (%) | Dry Crock (ISO 105-X12) | Wet Crock (ISO 105-X12) | Core Depth Ratio |
|---|---|---|---|---|---|
| Single Addition | 1 : 6 | 82 % | Grade 3.0 | Grade 2.0 | 0.24 |
| Linear Dosing | 1 : 8 | 78 % | Grade 4.0 | Grade 3.0 | 0.48 |
| Parabolic Dosing | 1 : 8 | 76 % | Grade 4.5 | Grade 3.5 | 0.68 |
| Parabolic + Hold | 1 : 10 | 74 % | Grade 4.5 | Grade 4.0 | 0.82 |
Lower liquor ratios (1:6) raise effective salt and dye concentrations, accelerating surface fixation but degrading wet crockfastness because of shallow core penetration. Moving to 1:10 dilutes electrolyte activity, slowing fixation slightly while allowing dye to penetrate deeper into dense ring-spun cores.
Sourcing specifications for heavy twill fabrics destined for industrial laundering or vintage garment washing must enforce strict dye penetration metrics. Mill dossier submissions must include verified testing parameters:
- Minimum Core Penetration Depth mandating that microtome optical analysis confirms dye presence across at least 65 percent of warp yarn cross-sectional area.
- Crockfastness Qualification requiring ISO 105-X12 dry rubbing fastness of Grade 4.0 or higher and wet rubbing fastness of Grade 3.5 or higher on bulk production rolls.
- Enzyme Wash Stability confirming shade tone retention within Delta E 1.2 (CIELAB under D65) following a standard 45-minute cellulase bio-wash treatment.
- Fixation Efficiency Target maintaining total covalent dye fixation between 72 percent and 78 percent to prevent unfixed surface dye accumulation.
Whether ultra-low liquor ratios can achieve complete interior penetration without extending the bath dwell time beyond commercial efficiency remains unproven across industrial jet dye vessels.


Metrology
Evaluating dye penetration depth quantitatively relies on optical microscopy of thin yarn cross-sections. Technicians embed dyed yarn bundles in epoxy matrix blocks before cutting 5-micrometer sections with diamond microtome blades. Calibrated white-light microscopy reveals the radial boundary between dyed exterior fibers and undyed cores, allowing direct calculation of penetration depth (rdyed) against total yarn radius (rtotal).

Cross-Sectional Microtomy and Spectrophotometric Profiling
Digital image analysis yields the Ring Dyeing Index (RDI) from cross-sectional area ratios:
RDI = fracAdyedAtotal = fracrtotal2 – (rtotal – δ)2rtotal2
where Adyed is the colored cross-sectional area, Atotal is total yarn area, and δ is boundary depth. An RDI of 1.0 indicates full penetration to the core. Heavy ring-spun twills dyed with unoptimized salt profiles frequently show RDI values under 0.40, reflecting severe ring dyeing.
Stepwise mechanical peeling paired with reflectance spectrophotometry gives secondary verification of dye distribution. Precision stripping equipment abrades yarn layers sequentially while spectrophotometers measure reflectance (R) at each layer to determine K/S color strength via the Kubelka-Munk equation:
fracKS = frac(1 – R)22R
Plotting K/S values against radial depth generates a continuous concentration profile. Comparing K/S decay curves across different electrolyte schedules highlights the deeper core yields achieved through progressive salt additions.
Cross-sectional microtome image analysis directly measures the boundary migration velocity of reactive dye molecules into the yarn interior.
Colorimetric readings across step-peeled yarn layers provide the definitive concentration profile from the exterior fiber envelope to the central axis.