Predictive Geometric Modeling of Loop Length and Stitch Density Controls in Technical Knits
Predictive loop length modeling eliminates fabric weight and yield variations by matching positive yarn feed settings directly to fully relaxed geometric constants.


Cam
Mechanical stitch formation depends on the exact physical movement of the needle during knockover. As a slider or latch needle moves down inside the cylinder trick, it forces yarn over the sinker belly, pulling the length that forms a single loop. Loop length dictates fabric mass.
If stitch draw depth varies by even a fraction of a millimeter across feeder locations, structural defects show up immediately in the unfinished roll as horizontal striping, inconsistent wale spacing, and weight fluctuations.
On high-speed industrial machines, yarn tension alters final loop geometry before knockover is complete. Friction builds up as yarn moves from the package through tension discs, stop motions, and the positive feed tape. If tension fluctuates as yarn enters the needle trick, the effective loop length changes even when the mechanical setting on the lower stitch track stays fixed.
Controlling stitch length requires tight synchronization between needle movement and yarn feed speed.
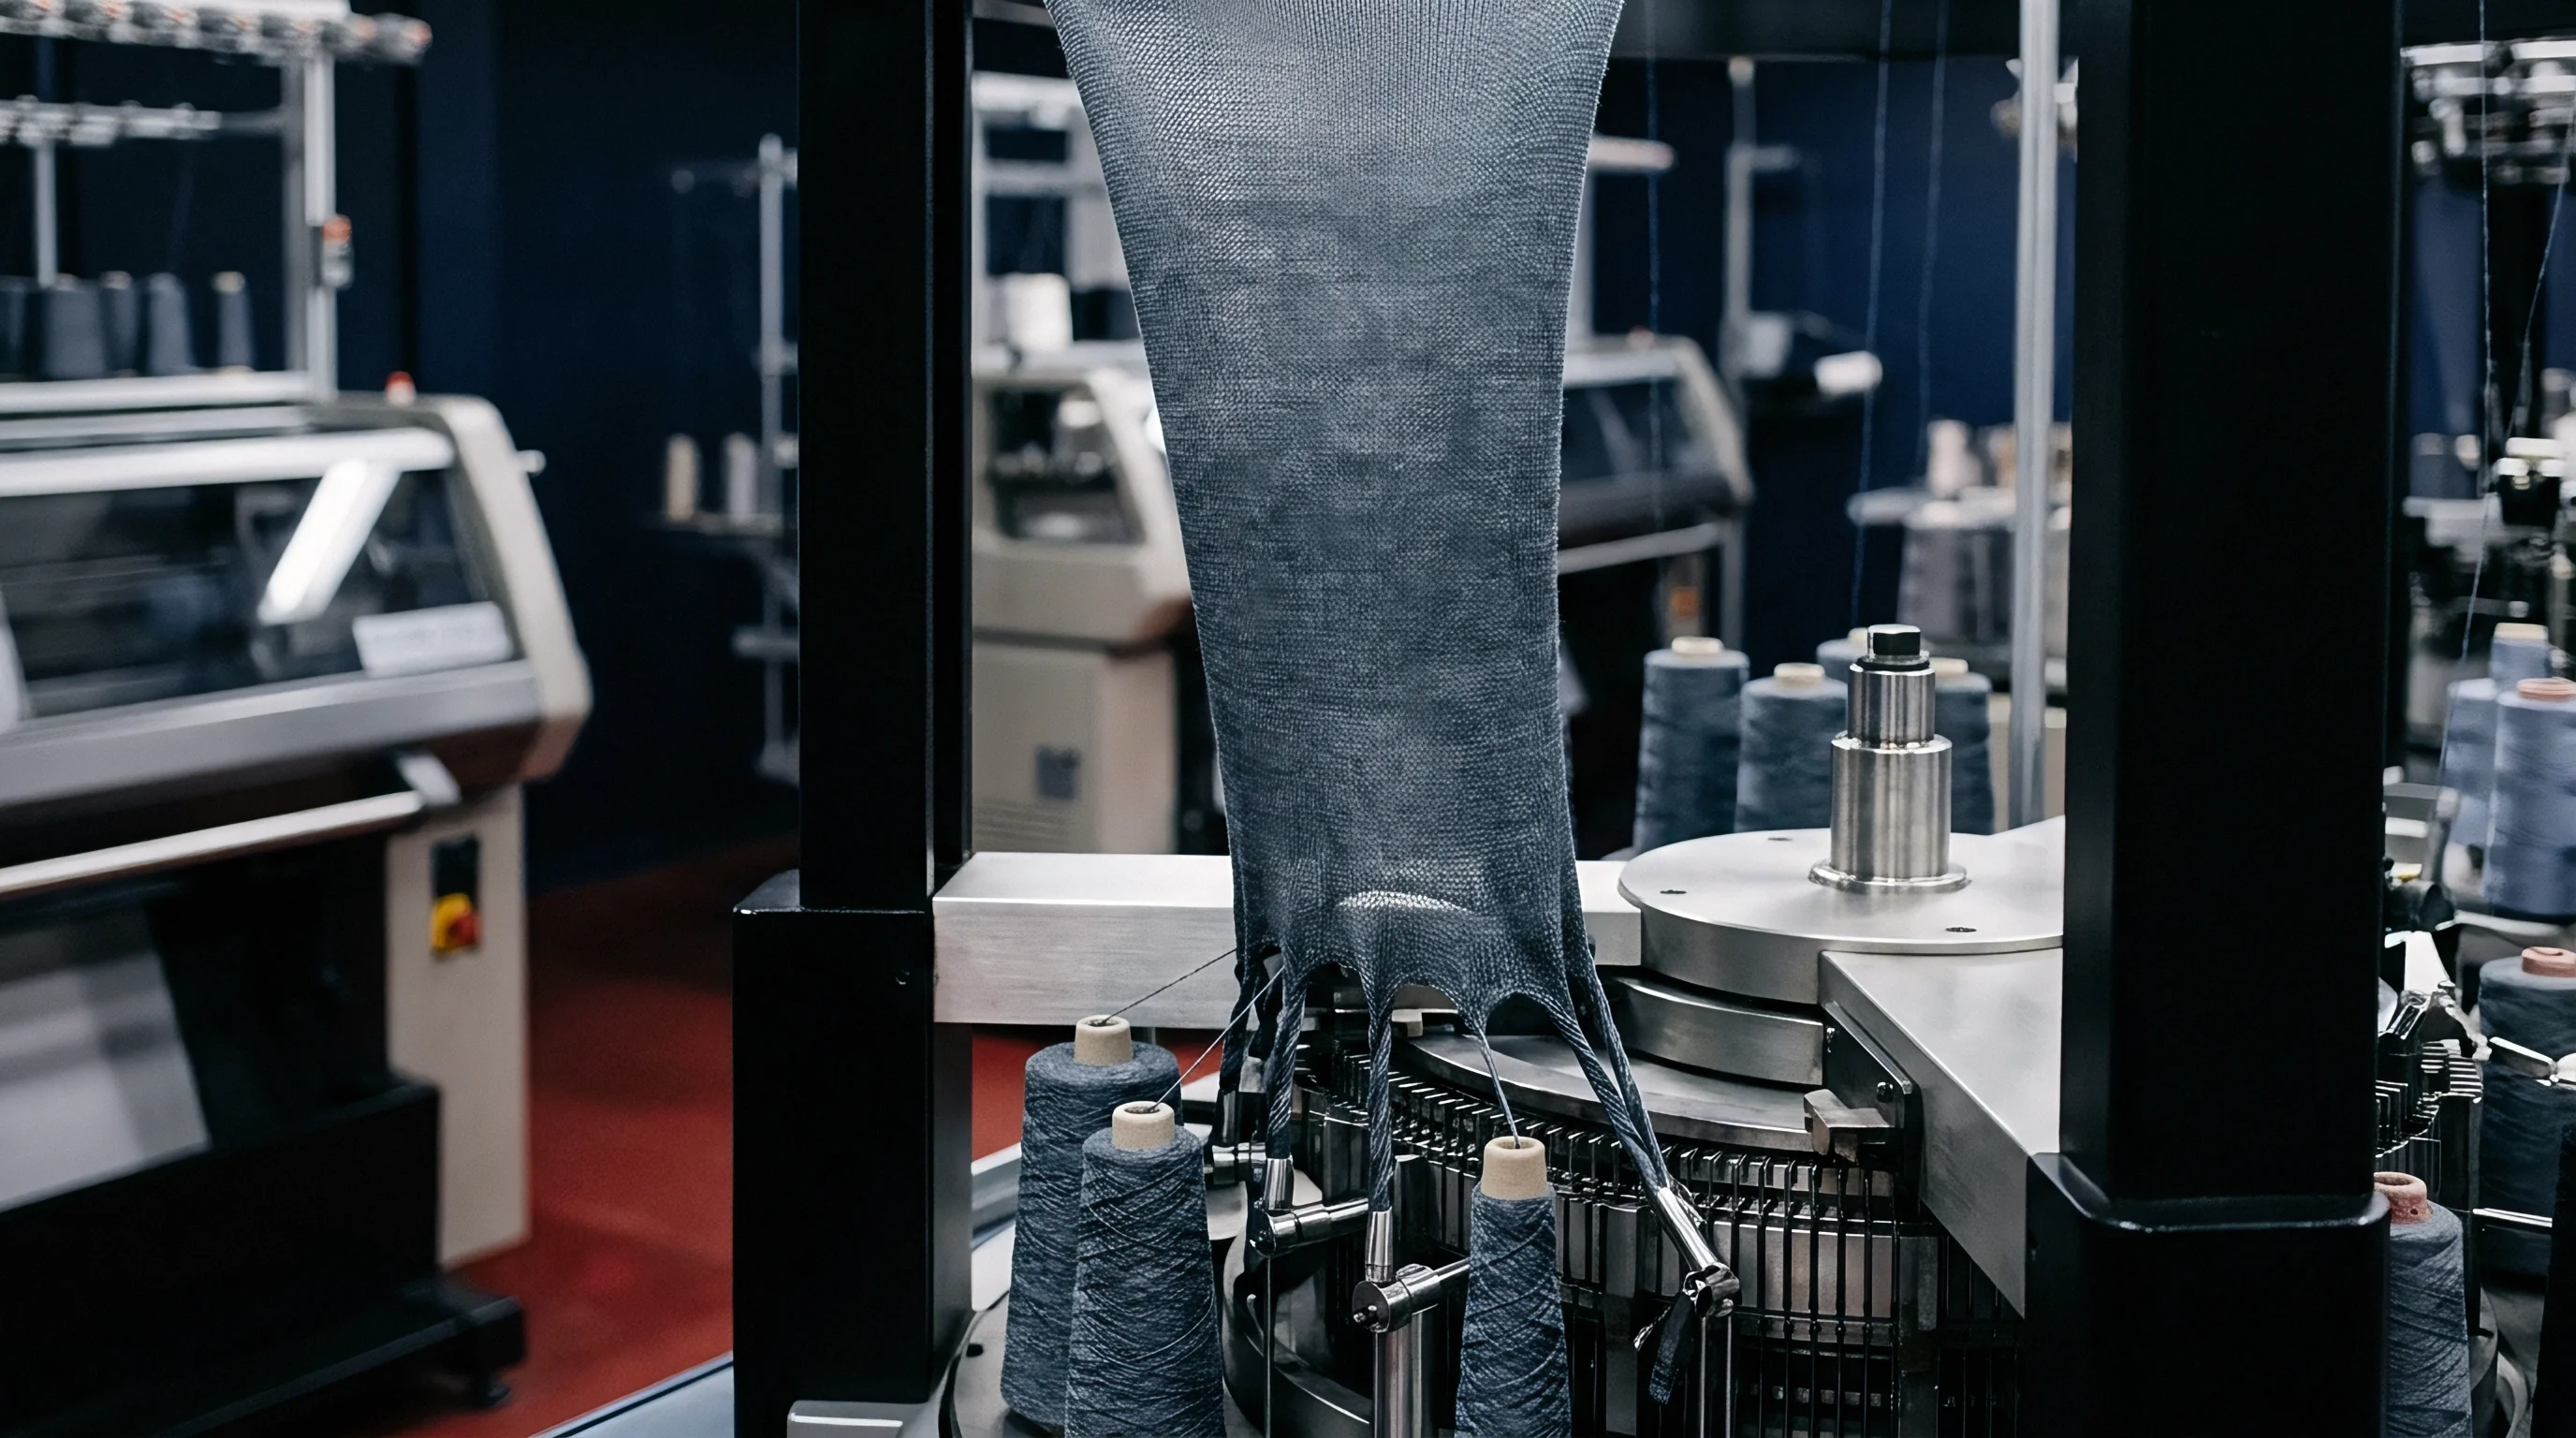
Kinematics of Needle Knockover and Loop Bending
The needle goes through four distinct phases during loop formation: clearing, yarn intake, loop pulling, and knockover. How far the needle hook drops below the sinker nib sets the theoretical loop length. As the needle travels down the linear angle of the cam track, it draws yarn from two places ~ the feeder guide eye and the adjacent, newly formed loop.
This horizontal yarn transfer between neighboring needles, called rob-off, reduces the new loop’s actual length before the latch fully closes.
Rob-off reduces actual stitch length by three to eight percent, depending on yarn friction, needle hook size, and stitch cam angle. Steep cam angles accelerate needle deceleration at the bottom of the stroke, driving transient tension spikes into the yarn. That tension stretches the yarn during bending, which then snaps back elastically as soon as the needle clears the low point.
The resulting relaxed loop comes out shorter than the theoretical path calculated from needle stroke alone.
Stitch cam adjustments alter total yarn intake faster than changes in yarn input tension.
Predictive geometric models account for this loss by adding a rob-off coefficient to the basic loop length equation. Loop shape is evaluated by isolating individual course lengths off the machine. The true stitch length (l) combines the theoretical loop circumference drawn by the needle stroke (lt) and the length loss delta (Δ l) driven by yarn-to-yarn and yarn-to-metal friction coefficients (μ).
Cam depth sets loop length, but when multi-feed circular machines run above thirty revolutions per minute, vibration and centrifugal forces shift the micro-positioning of adjustable stitch components. Feeder box micrometric settings need calibration with optical yarn speed meters instead of relying on the frame’s visual scale markings. A setting offset of just 0.05 mm between adjacent feeders creates weight banding that stays visible all the way through dyeing and finishing.
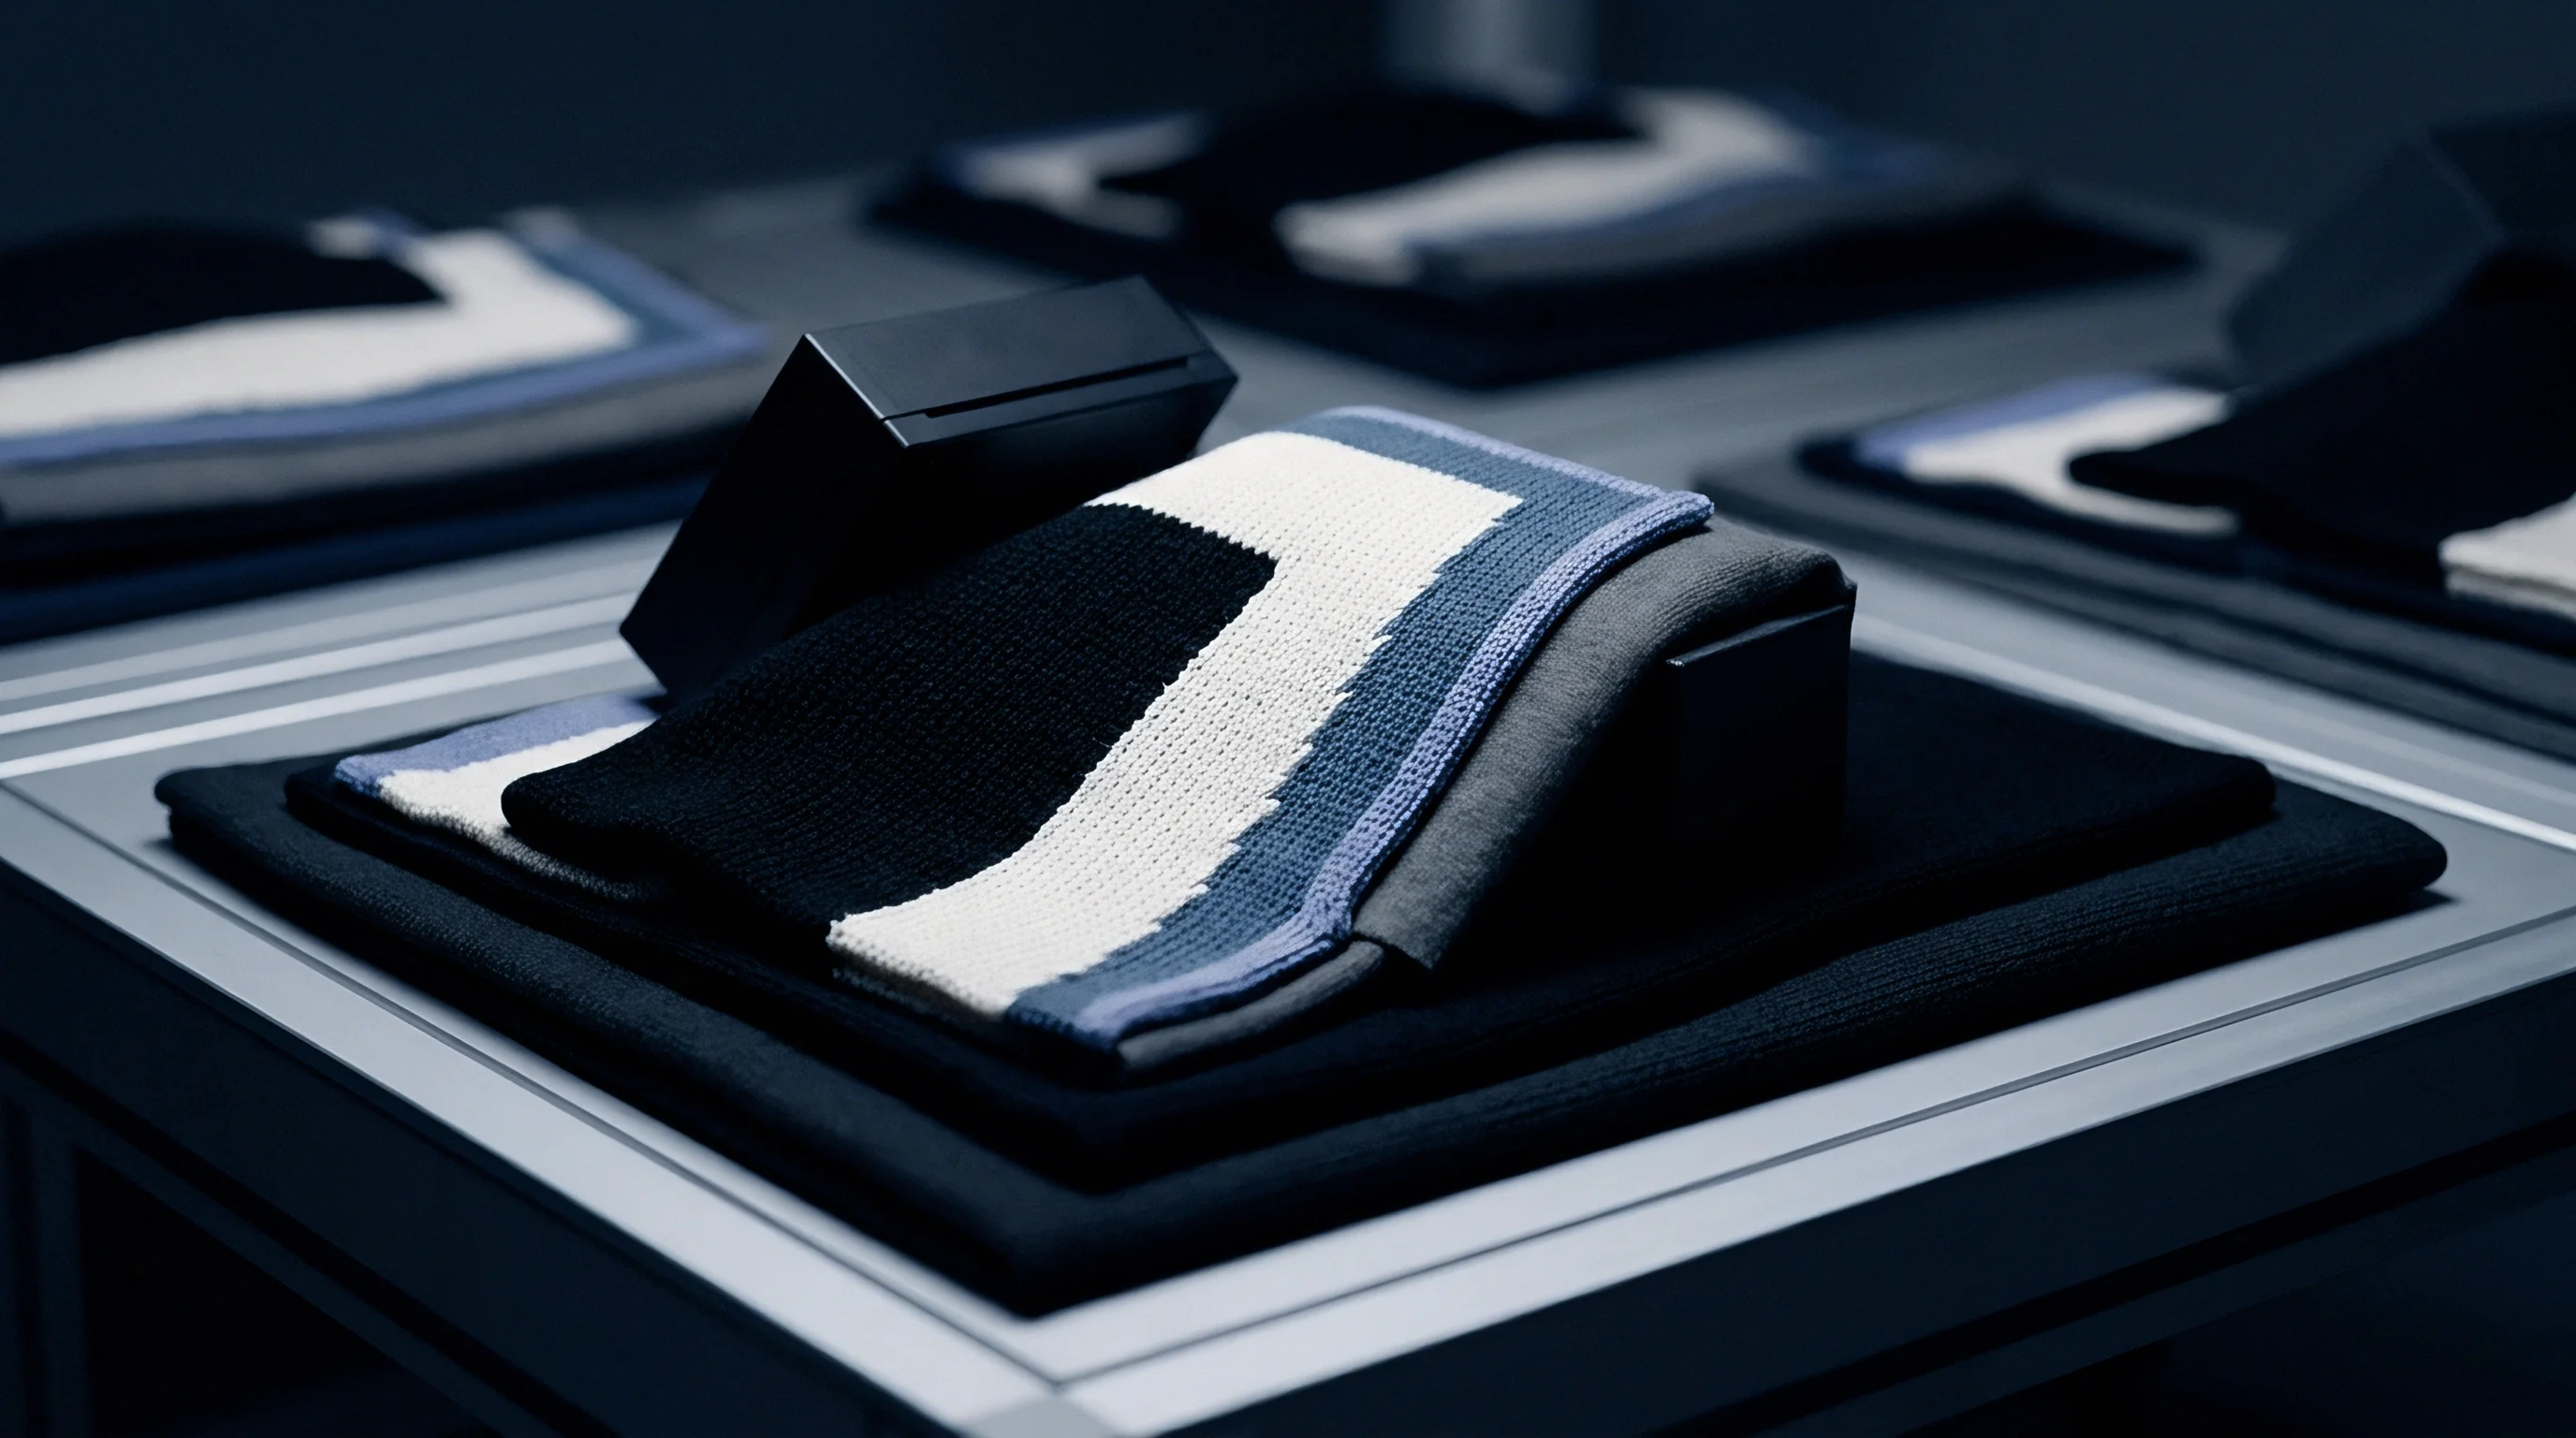
Positive Yarn Feeding Mechanics and Dynamic Tension
Positive yarn feeders eliminate stitch length variation by delivering a fixed, precise length of yarn for every revolution of the needle cylinder. Drive belts linked directly to the main shaft drive wheel turn the tape feeders at a fixed speed ratio. Matching the feed rate to the exact length needed for one revolution overrides tension fluctuations coming off the package.
The speed ratio between the positive feeder wheel and the machine cylinder determines loop length, locking in fabric structural density before the needle ever penetrates. If an operator tries to tighten fabric density by lowering stitch depth without adjusting feeder speed, yarn tension between the pulley and needle hook spikes dramatically. Excessive tension breaks filaments.
Yarn tension drives loop size. Keeping input tension within 1.5 to 2.5 centinewtons per tex protects filaments and keeps loop formation consistent. Mechanical feedback loops on modern storage feeders adjust local tension discs automatically to absorb variations in package density before dynamic tension spikes distort the stitch profile.
Controlling stitch formation at high production rates requires tracking yarn behavior across specific failure points along the needle bed:
- Rob-off yarn exchange happens when peak tension draws yarn from the preceding loop into the active hook, narrowing the fabric and increasing structural density.
- Cast-off tension spikes occur as the old loop slides over the latch, causing micro-abrasion and broken filaments whenever lubricant levels drop below two percent by weight.
- Sinker timing misalignment forces the needle to pull against a sinker nib that has not fully retracted, skewing loop legs and distorting local geometry.
- Input feeder slip occurs when positive drive tapes lose traction on the feed wheels, causing unmanaged loop length drift across individual feeds.
Losing control of physical loop length at high speeds destabilizes the geometry of technical knits. Inconsistent loop dimensions create local stress points that degrade bursting strength, impair dimensional recovery, and produce noticeable mass variation across the finished roll batch.


Matrix
Predictive geometric models translate yarn dimensions, structural constants, and machine settings into physical outcomes. Plain loop geometry depends on the spatial relationship between course pitch, wale pitch, and yarn diameter. Peirce’s early dimensional models showed that a relaxed loop can be approximated by interlocking circular arcs and straight lines.
That geometry still forms the mathematical basis for predicting stitch density, fabric cover, and weight per unit area before mounting yarn on the machine.
Refining these models, Munden and Doyle showed that fully relaxed knits reach a stable state where dimensional ratios depend almost exclusively on stitch length. The dimensionless constants kc, kw, and ks relate loop length (l) to course density (c), wale density (w), and total stitch density (S). In a fully relaxed state, these constants hold steady across wide ranges of yarn linear density as long as the tightness factor remains within normal structural bounds.

Peirce Geometry and Munden Constant Derivations
Calculating expected fabric dimensions starts by defining course and wale densities as inverse functions of loop length. Course density is the number of courses per unit length, written as:
c = frackcl
Wale density counts needle columns per unit length:
w = frackwl
Stitch density (S) gives the total loops per unit area, calculated by multiplying course density by wale density:
S = c × w = frackc × kwl2 = fracksl2
The constant ks serves as the core structural multiplier for fabric density. For fully relaxed plain jersey, ks usually sits between 21.0 and 22.5 when loop length is measured in millimeters and stitch density in loops per square centimeter. Shifts in yarn friction, twist factor, or cross-sectional shape nudge these constants slightly, requiring precise calibration when working with high-tenacity technical yarns.
| Structure Type | Course Constant (kc) | Wale Constant (kw) | Stitch Constant (ks) | Aspect Ratio (kc/kw) | Nominal Cover Factor (K) |
|---|---|---|---|---|---|
| Plain Single Jersey | 5.30 | 4.10 | 21.73 | 1.29 | 1.25 – 1.45 |
| 1×1 Rib | 3.80 | 3.00 | 11.40 | 1.27 | 1.10 – 1.30 |
| Interlock | 5.60 | 3.80 | 21.28 | 1.47 | 1.35 – 1.55 |
| 2×2 Rib | 4.00 | 2.40 | 9.60 | 1.67 | 1.15 – 1.35 |
Fabric tightness factor (K), or cover factor, measures how much surface area is filled by yarn rather than open space. It is calculated from yarn linear density in tex and loop length in millimeters:
K = fracsqrtTexl
Tightness factor governs air permeability. Technical knits designed for precise porosity ~ like filtration media or breathable barriers ~ require tight adherence to target values. Running below a tightness factor of 1.1 yields loose, unstable loops that snag easily and skew under tension.
Going above 1.6 distorts loops, packs yarn tightly against yarn, and breaks needles under heavy knockover force.

Energy Minimization Frameworks for Technical Loop Profiles
Classical geometric models rely on clean circular arcs, but real technical yarns show bending hysteresis, torsional rigidity, and transverse crushing. Advanced modeling turns to energy minimization to find the true three-dimensional equilibrium of a loop, solving for the lowest total strain energy stored across the bent and twisted yarn structure.
Total strain energy (Utotal) within a single loop cell breaks down into bending energy (Ub), torsional energy (Ut), and lateral compression energy (Uc):
Utotal = Ub + Ut + Uc
Bending energy depends on yarn flexural rigidity (B) and local curvature (κ) along the central axis over the loop length (s):
Ub = frac12 int0l B · κ(s)2 , ds
Torsional energy captures the twist torque created as neighboring loops interlock, governed by torsional stiffness (C) and the rate of twist change (τ):
Ut = frac12 int0l C · τ(s)2 , ds
Lateral compression energy accounts for cross-sectional flattening where loops press together at contact points. High-modulus yarns like para-aramid or continuous filament carbon have high flexural rigidity (B), forcing the loop head into a broad, flattened shape instead of a parabolic arc. Energy minimization models capture this lateral spreading, predicting the drop in course density before running fabric on the machine.
A ten percent reduction in loop length increases fabric mass per unit area by over twenty percent under constant relaxed conditions.
Munden constants establish reference baselines before wet processing. Feeder positions can show three percent variation during trial runs. Implementing these predictive mathematical models requires systematic execution through calibration and validation:
- Determine yarn linear density in tex under standard atmospheric conditions per ISO 139 after complete moisture equalization.
- Measure single-yarn bending rigidity (B) and frictional coefficient (μ) using standardized cantilever and capstan testing equipment.
- Calculate target loop length (l) based on desired end-use mass per unit area (g/m2) and cover factor requirements.
- Input calculated parameters into the energy minimization algorithm to derive theoretical course (c) and wale (w) densities.
- Adjust machine cam depth and positive feeder pulley ratios to match the calculated theoretical stitch length within a 0.5 percent margin.
Worked Calculation of Greige Stitch Density and Yield
To see how predictive modeling works in practice, consider a technical single jersey engineered from 160 dtex (16 tex) textured polyester filament. Target finished weight is specified at 180 grams per square meter fully relaxed.
First, calculate required loop length (l) using the empirical mass yield equation for single jersey:
Weight (g/m2) = fracS × l × Tex100
Substituting the Munden stitch constant relationship (S = ks / l2) into the mass equation yields:
Weight (g/m2) = fracks × Tex100 × l
Using the established relaxed stitch constant ks = 21.73 for single jersey and inserting known values:
180 = frac21.73 × 16100 × l = frac347.68100 × l = frac3.4768l
Solving directly for target loop length (l):
l = frac3.4768180 = 0.019316 meters = 2.93 mm
With target loop length set at 2.93 mm, expected course and wale densities follow from Munden constants kc = 5.30 and kw = 4.10:
c = frac5.302.93 mm = 1.8088 courses/mm = 18.09 courses/cm
w = frac4.102.93 mm = 1.3993 wales/mm = 13.99 wales/cm
Calculate predicted stitch density (S):
S = 18.09 × 13.99 = 253.08 loops/cm2
Finally, check fabric tightness factor (K) to verify feasibility:
K = fracsqrt162.93 = frac4.02.93 = 1.365 , tex1/2/mm
A tightness factor of 1.365 sits comfortably inside the 1.25 to 1.45 window typical for stable single jersey. This confirms the structure can be run without excessive needle wall friction or loop distortion.
How do multi-axial yarn interactions alter dynamic loop geometry when elastomeric inlay yarns are introduced into complex warp-knitted technical fabrics under continuous high-speed industrial tension?
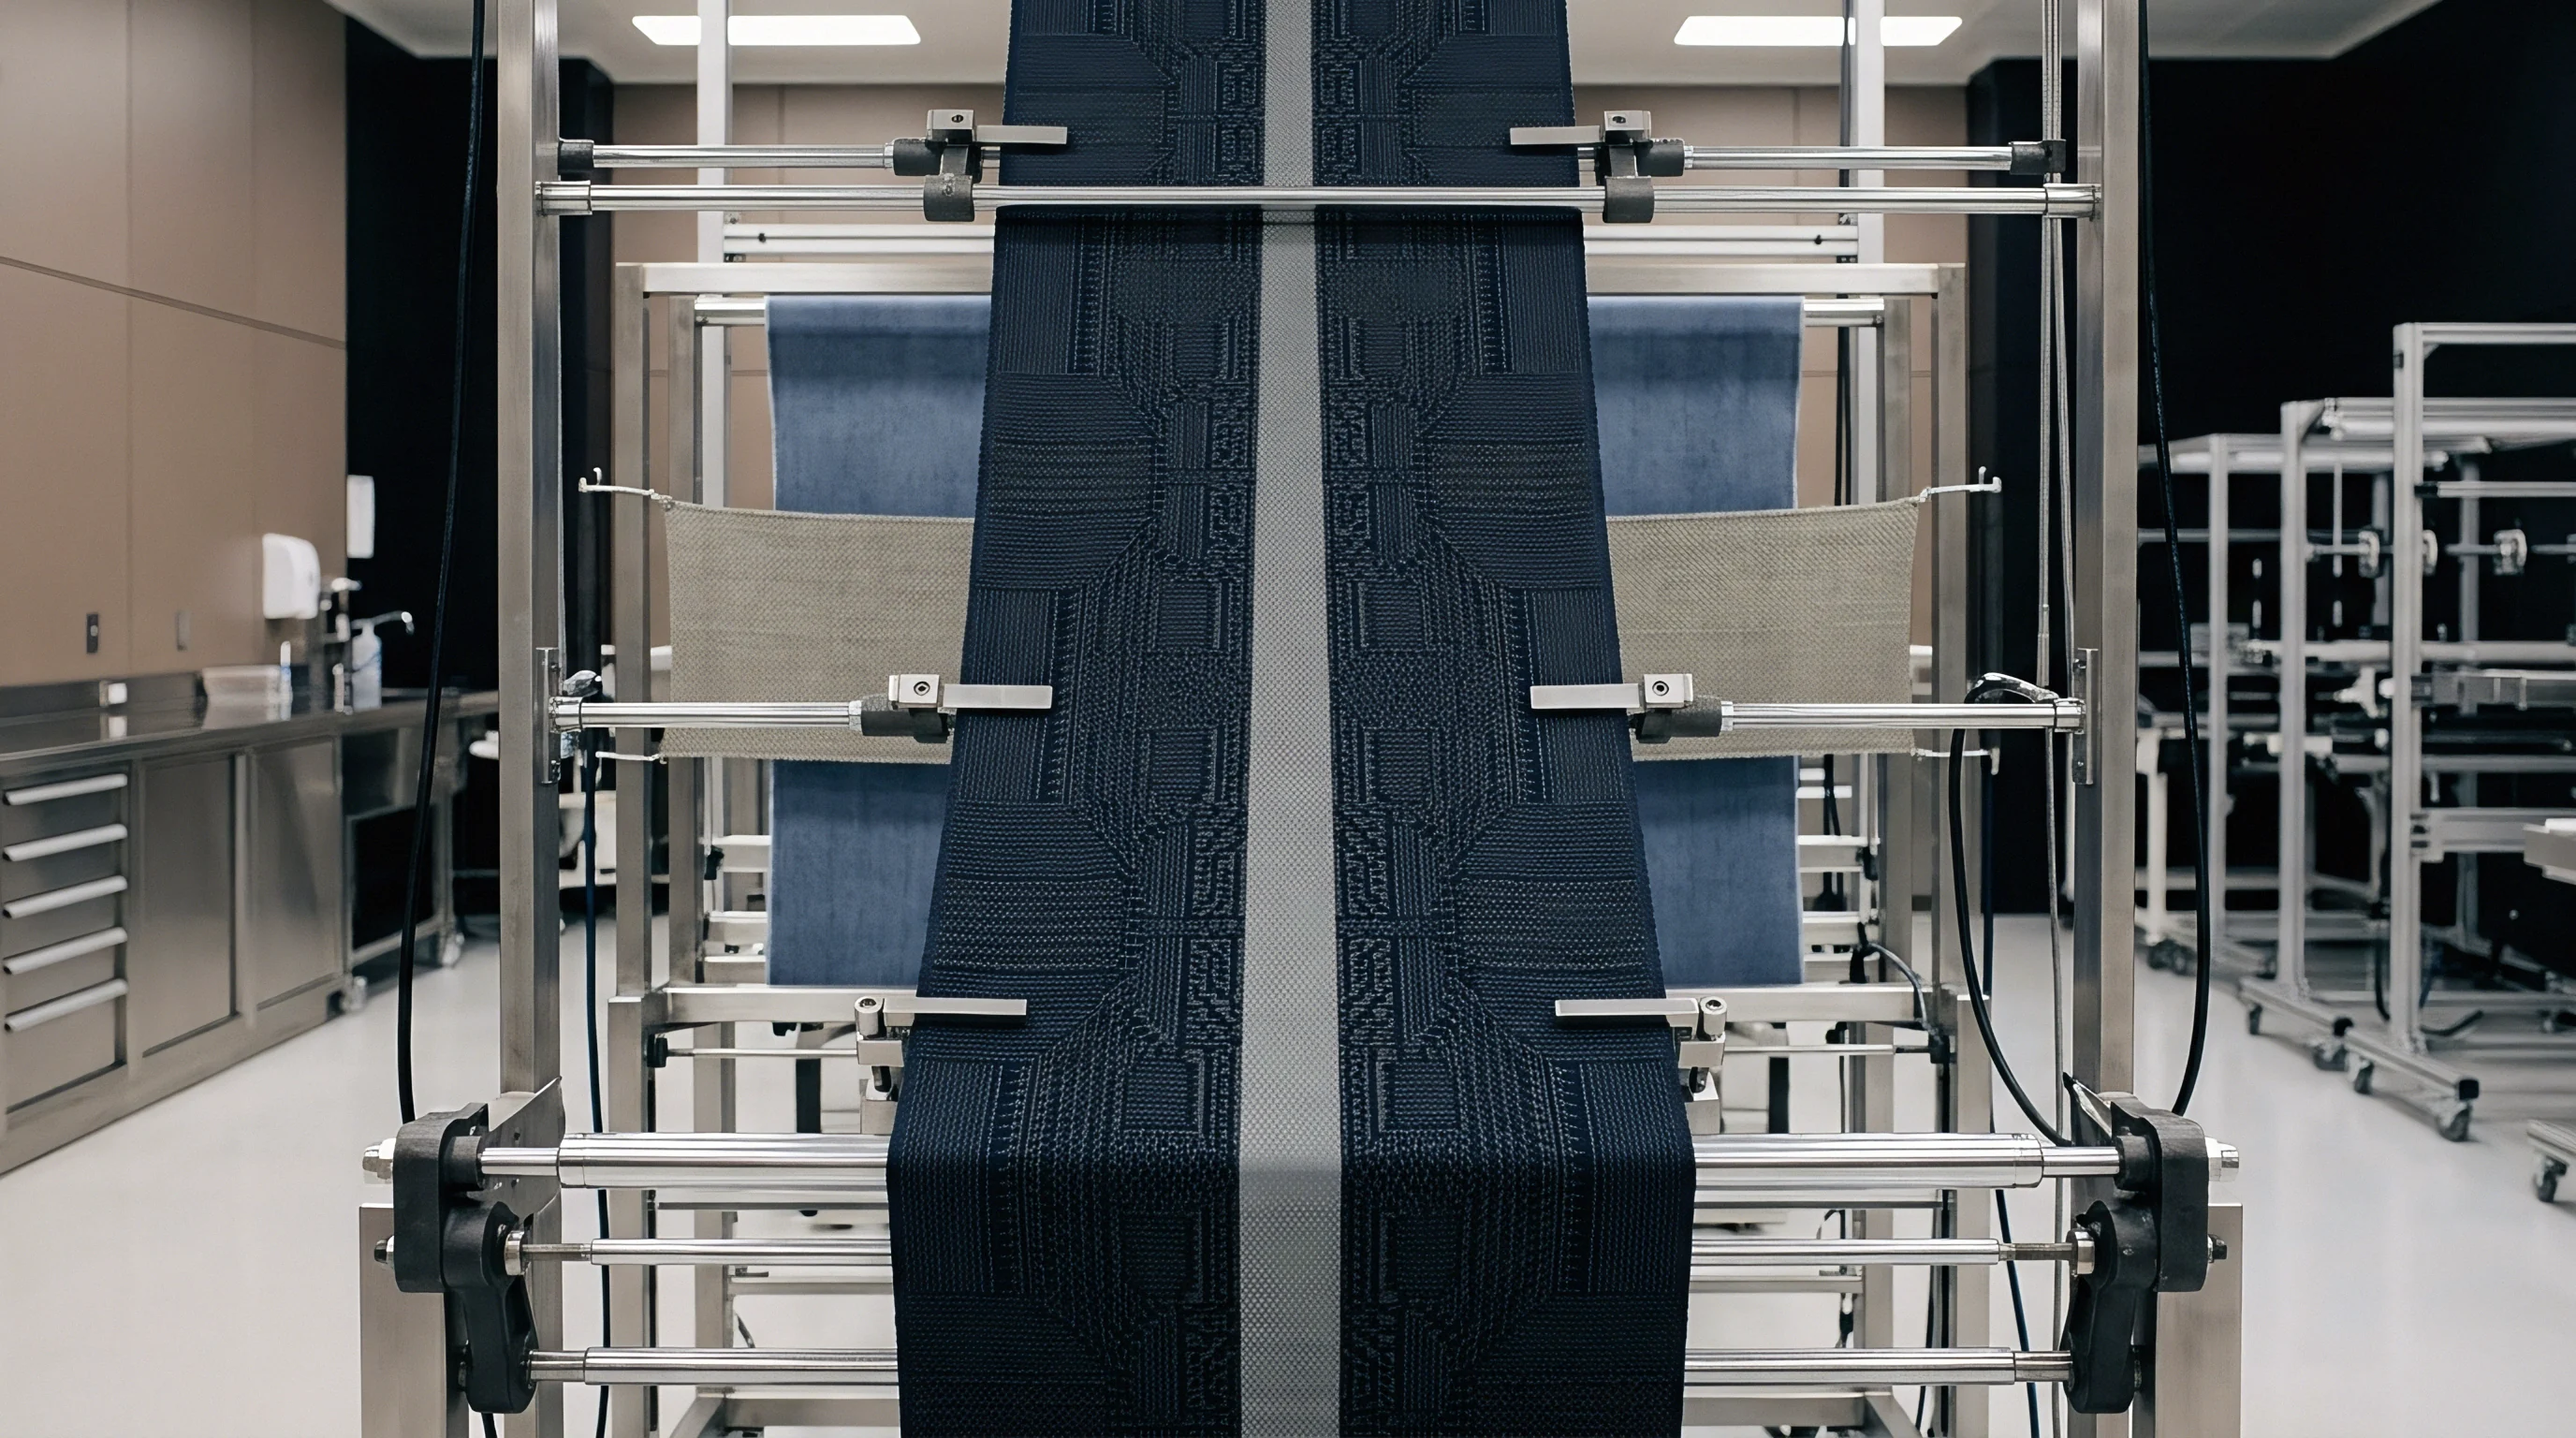

State
Dimensional stability in technical knits comes down to the mechanical energy locked into the yarn during knitting. Off-the-loom greige fabric is full of internal stress. Needle traction, feeder tension, and take-up winding drag loops away from their natural, minimum-energy geometry, which is why greige measurements tell you very little about final fabric performance.
Relaxation releases that stored energy, letting loop geometry shift from an artificially stretched shape back toward equilibrium. Dimensional changes unfold across distinct stages: dry relaxation, wet relaxation, and heat-set equilibrium. Predicting final fabric yield and stitch density requires clear transformation coefficients between these phases.
Does Wet Processing Overwrite Mechanical Stitch History?
Greige fabric resting on rolls undergoes basic dry relaxation as elastic recovery slowly pulls extended loops back toward shorter lengths. But dry relaxation barely touches deeper structural strain. Friction between individual filaments locks temporary distortions in place, so ambient exposure alone will never bring the fabric to its true minimum energy state.
| Relaxation Stage | Test Standard | Length Shrinkage (%) | Width Shrinkage (%) | Stitch Density Shift (%) | Mass Density Shift (%) |
|---|---|---|---|---|---|
| Off-the-Loom Greige | Direct Measurement | Base (0.0) | Base (0.0) | Base (0.0) | Base (0.0) |
| Dry Relaxed (24h Ambient) | ISO 139 Ambient | -2.5 to -4.0 | -1.0 to -2.0 | +3.5 to +6.0 | +3.0 to +5.5 |
| Wet Relaxed (Soak & Flat Dry) | ISO 6330 Ambient Soak | -8.0 to -12.0 | -3.0 to -5.0 | +12.0 to +18.0 | +10.0 to +16.0 |
| Fully Relaxed (3x Wash Cycle) | ISO 5077 / ISO 6330 4N | -14.0 to -18.0 | -6.0 to -9.0 | +22.0 to +28.0 | +20.0 to +26.0 |
| Heat Set Equilibrium | Stenter Fixed 180°C | -1.5 to -3.0 | -1.0 to -2.0 | +1.0 to +3.0 | +0.5 to +2.5 |
Immersion in liquid breaks that filament friction by swelling the fibers and providing lubrication. Water lets bent yarn segments move, releasing trapped torque. Loops shorten and widen simultaneously, driving rapid compaction.
Wet processing does not erase mechanical stitch history ~ it unlocks stored potential, driving loop geometry directly toward the equilibrium dictated by its knitted loop length.
Tracking dimensional movement requires three washing cycles per ISO 6330. Standardized testing shows that water temperature and mechanical action control how fast equilibrium is reached. Cold static soaking only releases part of the strain; full dimensional stability requires dynamic agitation at higher temperatures to clear the energy barriers keeping fibers out of alignment.

Relaxation Kinetics under Washing and Thermal Fixation
Laundering per ISO 5077 causes marked dimensional contraction along both courses and wales. Loop legs rotate out of their flat greige plane, rising into three-dimensional saddle shapes that thicken the fabric. Fabric weight per unit area increases in direct proportion to shrinkage, driving course density up while loop length stays constant.
Fabric dimensional stability test results per ISO 5077 require three consecutive 4N washing cycles to establish true equilibrium stitch density.
Heat setting knits made with elastomeric components ~ like bare or covered polyurethane ~ fixes loop dimensions by restructuring polymer chains. Heating synthetic yarns past their glass transition point (Tg) releases internal stresses built up during drawing and spinning. Held under controlled width and length on a stenter frame, the fabric meets high-velocity hot air that freezes its geometry into place.
Because greige shrinks as it relaxes, stenter overfeed settings must be calculated to match the fabric’s natural relaxed stitch density. If pin chains stretch the fabric wider than its natural wale spacing, internal strain is reintroduced ~ guaranteeing severe width contraction later on when the customer washes it.
Excessive chain tension during heat setting pulls loop legs straight and distorts loops into long rectangles. Over-stretching worsens dimensional instability, cuts bursting strength, and causes severe spirality in single jersey. Proper thermal processing matches stenter overfeed directly to calculated wet-relaxed course density, locking in stability without building in residual stress.
Finished fabric stability requires matching heat-setting conditions directly to the contraction potential engineered into the greige stitch.
Gauge
Needle trick pitch defines the mechanical limit for yarn volume in the knitting zone. Machine gauge (E), measured as needles per inch along the cylinder or bed, sets the boundaries for usable yarn linear density. Trying to knit heavy continuous filament yarn on a high-gauge machine causes severe abrasion, frequent latch breakage, and needle binding.
Running thin yarns on low-gauge machinery does the opposite, producing loose, unstable fabrics with inadequate cover. Keeping yarn count aligned with machine gauge depends on maintaining a proper ratio between yarn diameter and trick pitch. Matching linear density to trick pitch preserves needle clearance and stops yarn from crushing laterally during knockover.

Trick Pitch Limits and Yarns under Tension
The gap between needle tricks limits how much yarn bulk can pass through the knitting zone without binding. Maximum recommended yarn diameter (dy) should stay under twenty percent of needle trick pitch (Pt). Trick pitch is calculated directly from gauge (E):
Pt = frac25.4E mm
On a 28-gauge machine, trick pitch works out to 0.907 mm. That puts the upper limit for yarn diameter at roughly 0.181 mm ~ about 30 tex for spun yarn or 300 dtex for continuous filament. Going past this limit crushes yarn against the trick walls, degrading filaments and wearing out needles prematurely.
Running high-modulus fibers close to trick pitch limits spikes yarn-to-metal friction exponentially. That friction raises peak loop-pulling tension, causing surface abrasion and fuzzing. Keeping needle beds clean and using low-viscosity synthetic needle oils reduces friction coefficients, helping maintain loop geometry even under tight settings.
Plating Dynamics and Elastomer Core Centrality
Plating involves feeding two distinct yarns into a single needle hook at once, positioning them so one stays on the technical face while the other forms the back. Elastomeric plating pairs continuous filament polyurethane core yarn with high-tenacity nylon or polyester ground yarn to produce high-stretch compression fabrics.
Clean plating requires strict control over where both yarns enter the needle hook. Ground yarn must sit higher than the elastomeric core yarn at intake. Even minor tension imbalances can cause plating inversion, where the core pops through to the fabric face ~ leaving undyeable streaks and uneven stretch.
High-gauge technical knitting requires systematic checks across machine settings and feed lines:
- Needle hook dimension selection sized to the yarn bundle prevents clipping filaments as the latch closes.
- Yarn guide positioning accuracy aligned within 0.2 mm of the needle line prevents feed angle shifts that cause plating inversion.
- Elastomer input draft control calibrated with positive electronic feeders keeps stretch percentage and fabric weight stable.
- Sinker track clearance optimization removes lint and dried spin finish to keep sinkers moving freely.
Elastomeric core yarn tension must remain precisely double ground yarn tension at the feeder intake to ensure uniform plating coverage.
Choosing the right machine hardware prevents unexpected structural failures when running high-tenacity or abrasive technical yarns.
Machine temperature fluctuations during overnight shifts expand cylinder diameter, causing loop length variation.


Margin
Yield calculations connect stitch parameters directly to manufacturing costs and final fabric pricing. Fabric is produced by weight but cut into garments or components by surface area. If loop length drifts up by even two percent during a run, fabric weight drops, width expands, and structural performance can fall out of specification.
Uncontrolled stitch density creates real financial risk. Overweight fabric burns through yarn inventory and erodes margins on fixed-price contracts. Underweight fabric triggers rejections for failed burst strength, high air permeability, or off-shade depth.
Tight control over loop length sets the operational boundary that protects commercial margins.
Commercial Yield Equations and Off-Spec Scrap Rates
Linear yield measures how many running meters of usable fabric come from a kilogram of yarn. Calculating yield (Ym) integrates finished mass per unit area (Wg, in g/m2) and usable cuttable width (Wc, in meters):
Ym = frac1000Wg × Wc meters/kg
Off-spec density drives up cutting scrap. When stitch density drifts beyond agreed tolerances, yield changes and waste climbs on automated cutting tables. Pattern pieces cut from inconsistent rolls do not match dimensions, causing assembly defects and costly scrap.
| Control Class | Stitch Density Tolerance (%) | Mass Variance (g/m²) | Width Tolerance (mm) | Commercial Scrap Risk |
|---|---|---|---|---|
| Medical Compression (Class III) | ± 1.5 | ± 2.5 | ± 5.0 | Extreme (Lot Rejection) |
| Automotive Upholstery | ± 2.0 | ± 4.0 | ± 10.0 | High (Pattern Misalignment) |
| Active Performance Wear | ± 3.5 | ± 8.0 | ± 15.0 | Moderate (Garment Sizing Drift) |
| General Industrial Liners | ± 5.0 | ± 12.0 | ± 25.0 | Low (Acceptable Trim Loss) |
Yield dictates landed cost. Modeling loop length accurately lets purchasing teams calculate true raw material costs before committing capital to production runs. Scrap rates can be projected directly from greige loop length variance using standard statistical process control methods.
Specifying stitch density tolerances at the greige stage prevents dyehouse distortion. Setting these boundaries forces wet processing plants to keep stenter settings within set geometric limits, protecting performance across every delivered roll.
Specification Clauses for Fabric Weight and Stitch Count Control
Enforceable fabric contracts rely on clear, testable engineering specifications. Terms like heavy-weight or high-density offer no legal protection during quality disputes. Specifications must define target values, strict tolerance limits, and standardized test methods for loop length, course density, wale density, and weight per unit area.
Uncontrolled loop length drift triggers cascading failures in finished technical fabrics:
Clear technical specifications protect both buyers and mills by establishing compliance benchmarks before bulk production starts.
Purchasing agreements must specify that mass per unit area be determined according to ISO 3801 after full relaxation per ISO 6330, with course and wale densities conforming to a maximum allowable variance of plus or minus two percent from the approved reference standard sample, where any non-conforming roll shall be subject to immediate rejection at the mill’s expense.