Inline Optoelectronic Sensor Parameterization for Blowroom Synthetic Polymer Removal
Inline optoelectronic parameterization requires balancing SWIR and polarization gain settings against transport air velocity to remove synthetic polymers without excessive fiber loss.


Duct
Raw cotton comes into the blowroom contaminated with synthetic polymer packaging ~ extruded polypropylene strapping, clear polyethylene film, and woven tapes hidden deep inside dense bales. As high-speed opening lines tear these bales into tufts at throughputs over 1500 kilograms per hour, the packaging gets shredded into thousands of clear, translucent, or white filaments. Pneumatic transport ducts carry these opened tufts at air speeds between 12 and 22 meters per second.
Traditional cleaning machinery relies on density differences and mechanical beating to knock out heavy trash like sand, stems, and seed coat bits. Because synthetic polymers have densities similar to or lower than cotton, mechanical gravity separation cannot catch them. That leaves optoelectronic detection channels built directly into transport ducts as the main defense against synthetic film reaching carding and spinning lines.
The transport duct acts as the physical frame for optical sensors. Air velocity profiles, tuft density, and glass clarity define how well those sensors can perform. Inspection chutes use optical-grade toughened glass or anti-reflective sapphire windows mounted flush with the inside duct walls.
During routine runs, dust, micro-dust, and cotton wax quickly coat the glass. At high air speeds, boundary layer effects pull light polymer film against the windows, blocking light paths and blinding line-scan cameras. To combat this, continuous air wipe systems operating at 6 bar pulse against the inner window faces at set intervals.
If that wipe timing slips even slightly, thin wax films build up, cutting down illumination and causing the system’s baseline calibration to drift within hours.
Polypropylene film moving through transport ducts at 18 meters per second exhibits a minimum target dwell time of 0.8 milliseconds across a 15-millimeter optical inspection window.
Optical detection breaks down if duct aerodynamics turn unstable. Turbulence from sharp elbows or sudden transitions in duct diameter bundles tufts into dense, opaque clumps. These heavy bunches shadow the light source, triggering false detections or hiding embedded pieces of white polypropylene tape from the cameras.
Keeping the fiber layer thin and uniform requires specialized duct geometry. Inspection zones use flattened rectangular cross-sections that keep tuft depth under 10 to 15 millimeters. Just upstream of the cameras, an accelerating airflow opens up the tufts so high-intensity light can reach the inner fibers.
Synthetic contaminants cause different operational problems in blowroom ducts depending on their shape and material properties.
- Polypropylene bale strapping comes in as stiff, high-density tape that resists opening rolls, jams feed rollers, and shatters into thousands of glinting shards down transport chutes.
- Transparent polyethylene film is thin and flexible, wrapping tightly around tufts so it stays hidden inside fiber bunches where visible light color detection misses it entirely.
- White polypropylene woven bags shred into individual filaments that match cotton fibers in length and thickness, making them visually identical under standard diffuse lighting.
- Foamed polyurethane packing crumbles into light, static-charged bits that stick to duct walls, creating persistent shadows across the sensor arrays.
Optoelectronic systems in transport ducts process huge volumes of optical data on the fly. Continuous line-scan arrays capture up to 30,000 lines every second across duct widths from 800 to 1600 millimeters. Tuning these systems means balancing sensitivity against air speed and fiber throughput.
Set the detection thresholds too tight, and ejection valves fire constantly, dumping clean cotton tufts into the waste bin. Back off too much, and clear film fragments slip through to carding, drawing, and spinning, where they get pulled into fine yarn and leave un-dyeable streaks in finished fabric.
Automatic optical cleaning systems are built to remove synthetic contamination without operator intervention, but in practice optical windows inevitably get dirty, duct profiles wear unevenly, and shifting wax levels alter optical baselines over the course of a single shift.

Spectrum
Spotting synthetic polymers inside cotton transport ducts relies on fundamental physical differences in how materials absorb, reflect, and polarize light. Raw cotton consists of unaligned, twisty, ribbon-like cellulose fibers rich in hydroxyl groups. This structure scatters incoming light and absorbs heavily in the short-wave infrared water-absorption bands.
Polyolefins like polypropylene and polyethylene are long aliphatic carbon chains dominated by single C-H bonds. They carry no natural color, stay highly transparent in thin films, and show sharp absorption peaks in short-wave infrared bands. Setting up optoelectronic sensors starts with mapping these light-matter interactions across visible, ultraviolet, and infrared wavelengths.
Standard RGB color cameras pick up colored polymers like blue polypropylene twine or red packaging strings using three-channel color algorithms. Line-scan CCD or CMOS sensors compare hue, saturation, and intensity against calibrated baseline thresholds. But color detection fails completely when synthetics are clear, white, or colored like cotton.
Modern blowroom systems pair visible color imaging with polarized light and short-wave infrared spectroscopy inside one sensor housing. Polarized systems exploit structural differences between highly ordered synthetic polymers and natural cotton cellulose.
| Polymer Contaminant Type | Dominant Optical Domain | Specific Target Wavelength (nm) | Sensor Technology Type | Key Physical Detection Mechanism |
|---|---|---|---|---|
| White Polypropylene Tape | Polarized Visible / SWIR | 1195 and 1390 | InGaAs SWIR Line Scan | C-H overtone absorption and specular polarization reflection |
| Clear Polyethylene Film | Short-Wave Infrared (SWIR) | 1215 and 1410 | InGaAs Linear Array | Narrow-band differential C-H stretch absorption vs. cellulose O-H |
| Fluorescent Polyamides | Ultraviolet (UV) / Visible | 365 excitation / 440 emission | CCD Line Scan with UV Source | Optical brightener excitation and UV-induced blue fluorescence |
| Colored Polyester Fibers | Visible RGB Color Space | 450, 540, 630 | High-Speed RGB CMOS | Chrominance delta relative to cotton fiber color background |
| Polyurethane Foam Shards | NIR / Polarized Light | 1510 and 1680 | Dual-Polarization InGaAs | Phase shift in reflected polarized beam and N-H bond absorption |
Polarized illumination passes light through linear filters before hitting the fiber stream. Cotton fibers have irregular, twisted lumen cross-sections that depolarize reflected light, scattering it randomly in all directions. Extruded films and stretched polypropylene tapes have smooth, highly oriented planar molecular structures.
These synthetic surfaces preserve the polarization angle of incoming light, sending strong specular reflections back to the sensor array with their original orientation intact. Dual-polarization cameras use two orthogonal sensor banks; calculating the ratio of parallel to perpendicular light intensity exposes flat clear or white polymer surfaces, even when their color matches the cotton exactly.
Short-Wave Infrared spectroscopy provides definitive material identification by measuring molecular vibrational overtones. InGaAs arrays operating from 1000 nm to 1700 nm track specific light absorption ratios. Polypropylene and polyethylene exhibit pronounced C-H bond absorption overtones at 1195 nm, 1215 nm, and 1390 nm.
Cellulose shows strong O-H absorption at 1450 nm and very little C-H absorption at polyolefin bands. By calculating real-time intensity ratios between 1200 nm light pulses and 1450 nm reference pulses, SWIR systems flag clear polyethylene wrap even when hidden under thin layers of cotton.
Polarized light systems identify transparent polymer films by calculating the ratio of preserved specular reflection against depolarized light scattered by convoluted cotton cellulose fibers.
Ultraviolet units target synthetic filaments containing optical brighteners or residual monomeric fluorescence. High-output UV-A LED arrays emitting at 365 nm illuminate the moving fiber stream. Synthetics with embedded stilbene or triazine compounds absorb UV energy and re-emit visible blue light between 420 and 460 nm.
Line-scan cameras fitted with UV-cut filters capture this secondary emission. Because cotton exhibits virtually no natural fluorescence under 365 nm light ~ unless contaminated by specific fungi or mineral oils ~ the signal-to-noise ratio for catching fluorescent synthetics is extremely high.
Sensor tuning requires tight control over LED strobe timing. Modern sensor heads cycle through multiple lighting modes across consecutive line scans: line one fires polarized visible LEDs to evaluate surface orientation, line two pulses UV-A LEDs to check for fluorescence, and line three fires 1200 nm SWIR LEDs to measure C-H absorption. Merging these sequential scans into a unified spatial map allows real-time multi-spectral classification at scan rates above 20 kilohertz.
System settings must adjust for exposure times, LED output decay, and ambient light leaking through duct joints.
Can shifts in raw cotton moisture regain alter short-wave infrared cellulose baselines enough to cross synthetic decision boundaries under humid blowroom conditions?


Threshold
Configuring an inline optical sensor requires setting digital decision boundaries that convert raw pixel brightness, polarization ratios, and spectral absorption readings into valve trigger commands. Every pixel from high-speed camera arrays generates a numerical value from 0 to 255 in 8-bit systems, or 0 to 4095 in 12-bit setups. Signal processing algorithms group neighboring pixels that exceed set variance limits into contiguous clusters called spatial blobs.
Technicians must calibrate blob area, minimum contrast, dynamic gain, and spectral thresholds to maximize synthetic removal without throwing away good fiber.
Noise filtering is the first step in setting up parameters. High transport speeds cause airborne dust, micro-lint, and loose fibers to flutter across the inspection glass. If sensitivity is set too high, single floating cotton fibrils trigger false alarms and fire ejection valves continuously.
Noise suppression parameters establish minimum blob dimensions, typically requiring a contaminant image to cover 1.0 to 2.5 square millimeters across at least two consecutive line scans before registering a valid detection.
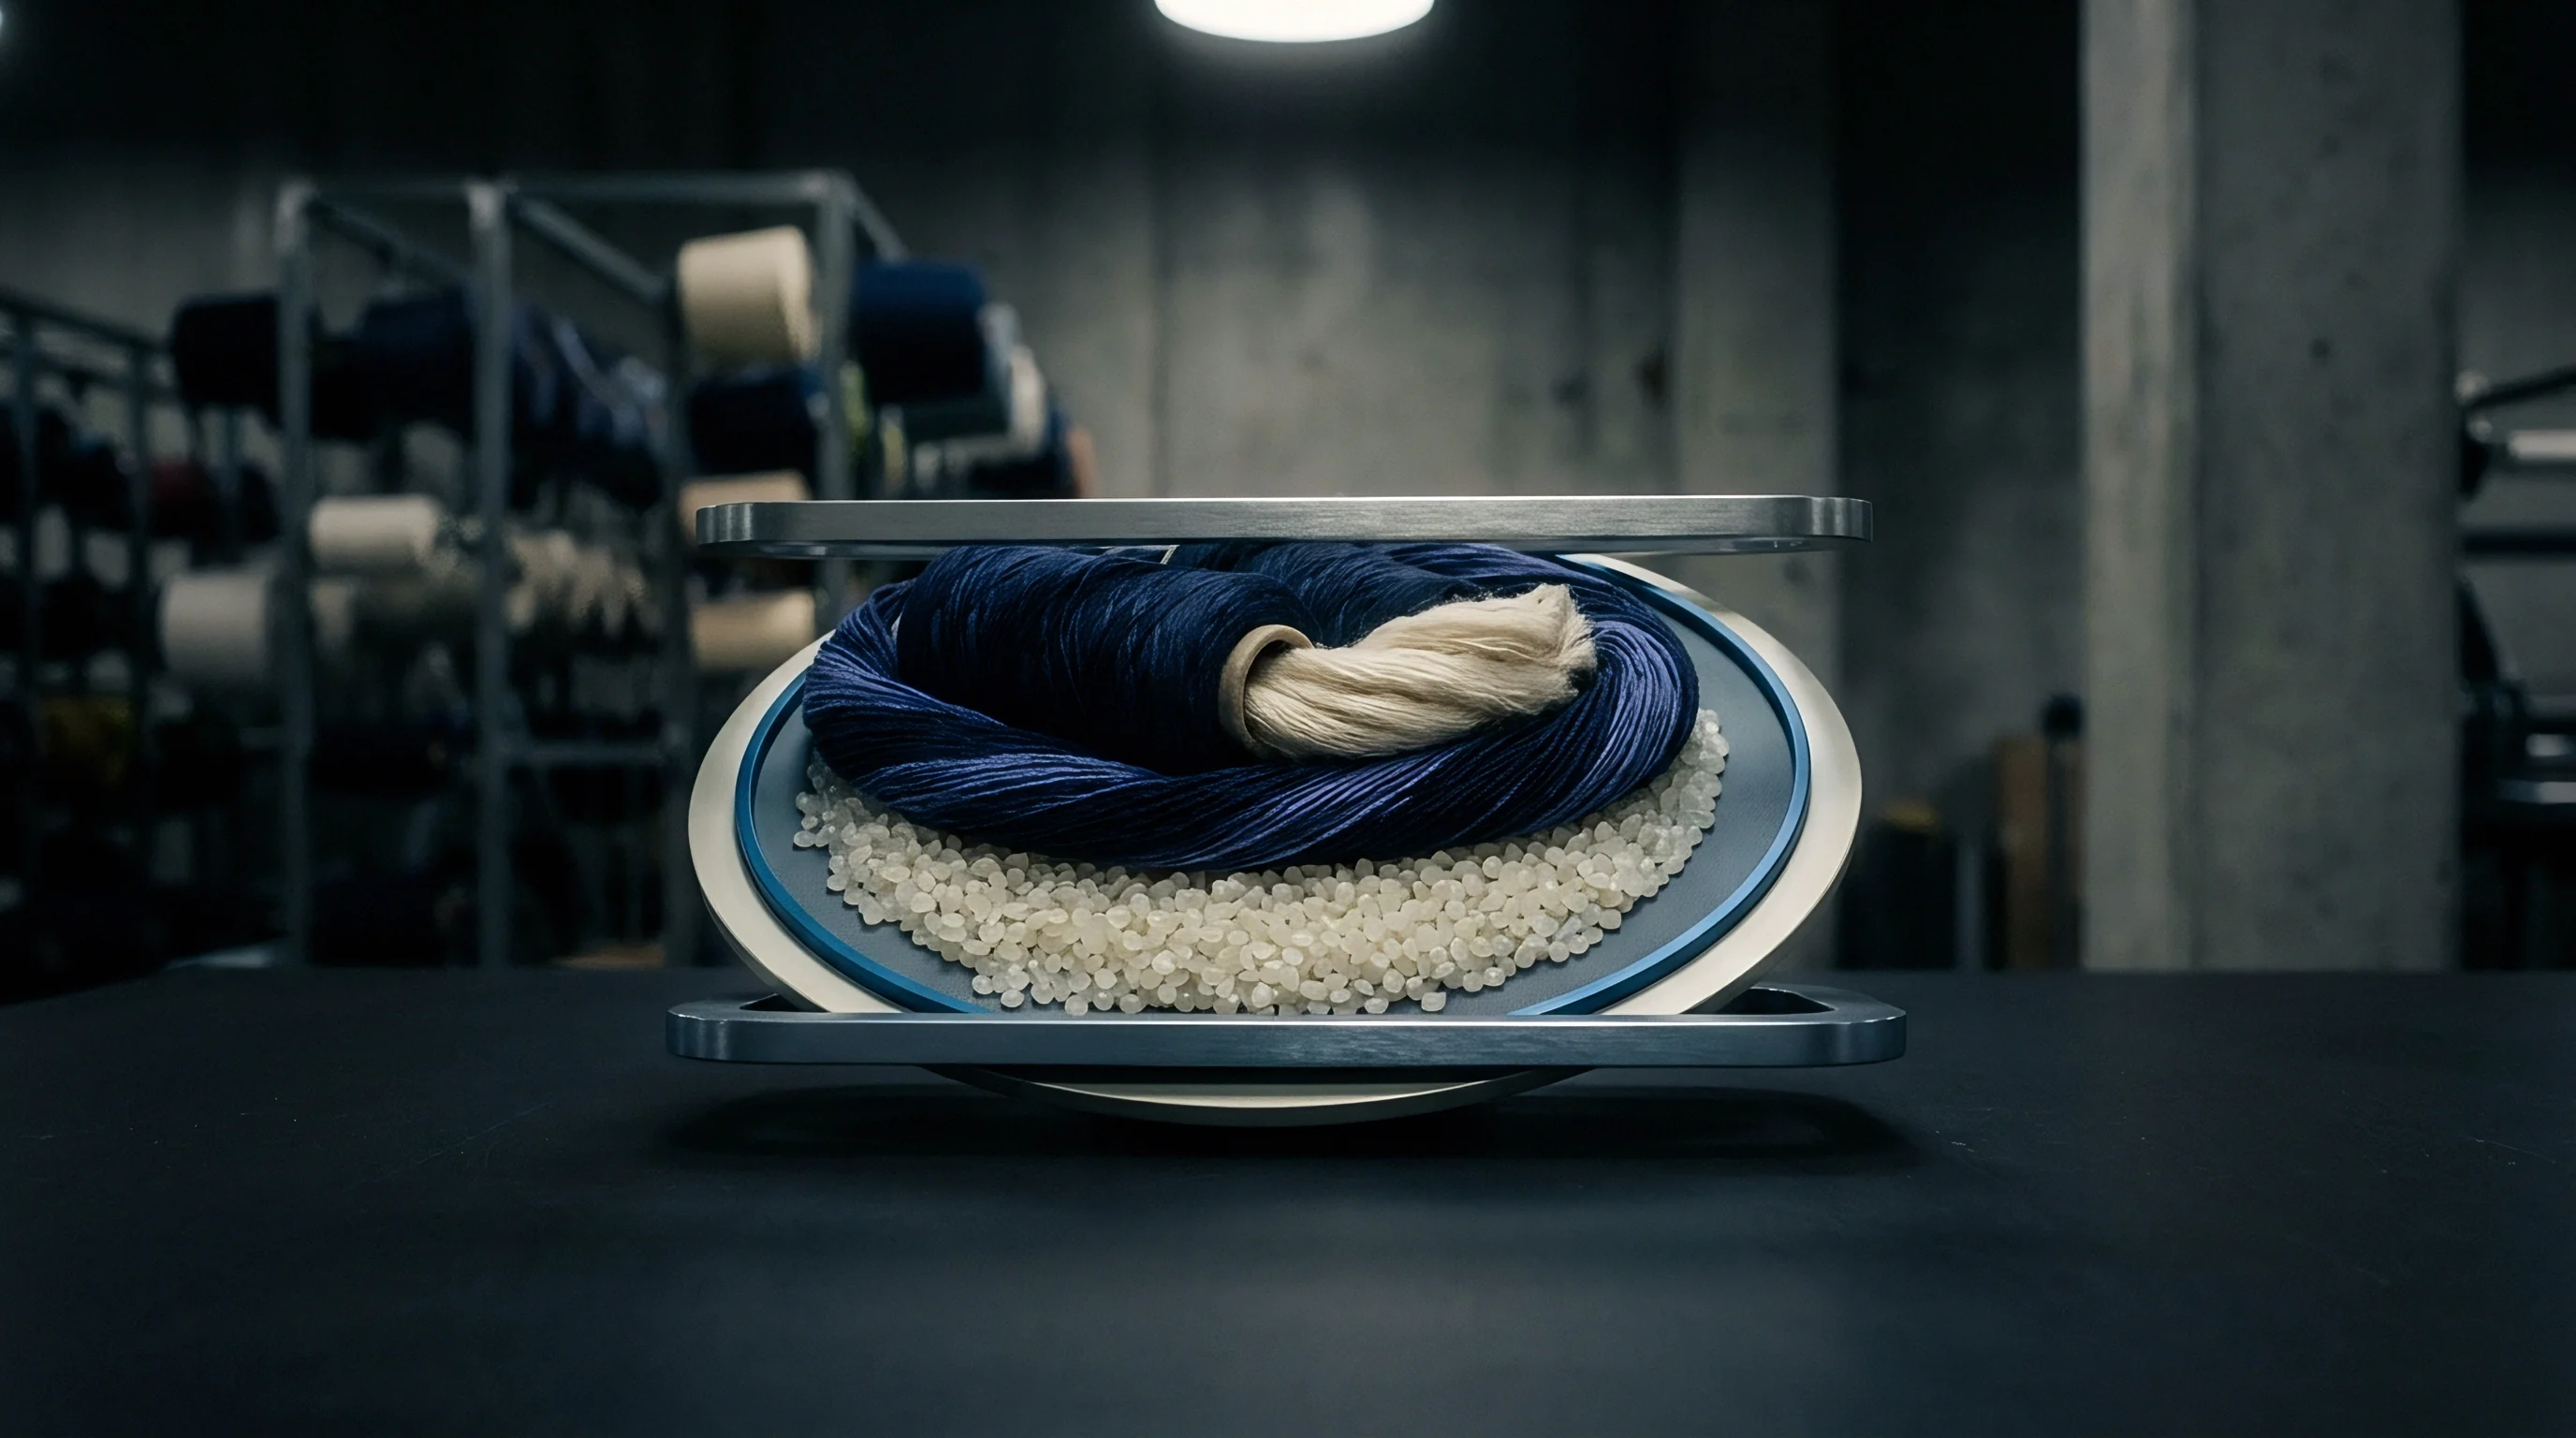
Which Parameter Adjustments Prevent False Polypropylene Triggers?
Preventing false polypropylene triggers requires separating optical contrast from surface reflectivity. Dark seed coats and natural trash in white cotton cause sharp drops in visible light contrast that look like dark synthetic particles. Technicians avoid this by mapping dynamic chromatic thresholds on two-dimensional hue-saturation matrixes.
Instead of relying on a flat grayscale threshold, the vision engine evaluates color vectors in spatial chromaticity space. Cotton colors fall within a tight elliptical cluster in the yellow-red quadrant. Synthetic materials outside this ellipse trigger alarms, while dark natural seed coat fragments inside specific chromatic boundaries get routed to mechanical drop gates rather than high-pressure pneumatic ejectors.
| Parameter Name | Standard Value Range | Unit of Measure | Direct Operational Impact | Consequence of Over-Parameterization |
|---|---|---|---|---|
| Blob Area Threshold | 1.0 to 3.5 | mm² | Filters out loose lint and micro-dust noise | Small synthetic film shards pass undetected |
| Polarization Ratio Sensitivity | 1.3 to 2.2 | Intensity Ratio | Triggers on flat specular synthetic surfaces | Luster-rich mercerized or silky cotton triggers false blasts |
| SWIR C-H Channel Gain | 15 to 45 | dB Digital Gain | Amplifies polyolefin C-H absorption peaks | Thermal sensor noise generates false polymer flags |
| Spatial Coincidence Window | 2 to 5 | Consecutive Lines | Verifies target persistence across line scans | High-velocity thin film strip escapes detection window |
| Dynamic Baseline Tracking Rate | 0.05 to 0.50 | Signal Shift / min | Compensates for window dust and wax build-up | Slowly passing large film sheets absorbed into baseline |
SWIR calibration demands careful adjustment of differential channel gains. Polypropylene algorithms compare pixel intensity at 1195 nm against a reference reading at 1450 nm, using the ratio RSWIR = I1195 / I1450 as the main decision metric. Clean, dry cotton yields an RSWIR value well above 1.8 due to strong cellulose moisture absorption at 1450 nm.
Polypropylene drops RSWIR below 0.8 because of heavy 1195 nm absorption combined with reflection at 1450 nm. Setting the trigger threshold at RSWIR = 1.1 guarantees catching polypropylene, but risks false positives if incoming cotton bales show wide moisture variations across unconditioned lots.
ITMF contamination survey rules dictate that synthetic white film remains the single most costly raw material defect in spinning mills, driving parameter strategies toward maximum removal efficiency despite fiber loss penalties.
Sensor calibration follows a strict logic hierarchy so overlapping optical channels don’t conflict.
- Optical baseline dynamic calibration automatically tracks gradual light loss from window dust, adjusting camera gains to keep baselines stable over 24-hour runs.
- Spatial boundary masking ignores the outer 10 millimeters near duct corners where boundary layer friction slows air down, preventing false triggers from lingering cotton masses.
- Polarization differential thresholding picks out specular polyolefin tape reflections by setting parallel-to-perpendicular light intensity limits above natural cotton scattering levels.
- Spectral ratio verification checks visible and polarized triggers against short-wave infrared C-H absorption peaks, filtering out false positives from reflective foil or dense leaf fragments.
- Blob temporal integration matches particle speed against encoder pulses from opening line feed drives to confirm object motion before firing solenoid valves.
Optimizing parameters relies on constant operational feedback. Bumping up SWIR sensitivity by 15 percent on West African cotton heavily contaminated with white woven polypropylene cleared out persistent film traces in sliver samples. That adjustment jumped average ejection rates from 420 events per hour to 1850.
Clean cotton loss in the waste box spiked from 1.2 kilograms per shift to 8.7 kilograms, burning through $24.50 per hour in wasted lint to capture roughly 0.3 grams of polypropylene film. The plant accepted the loss after downstream sliver inspections verified zero synthetic faults got past the new settings.
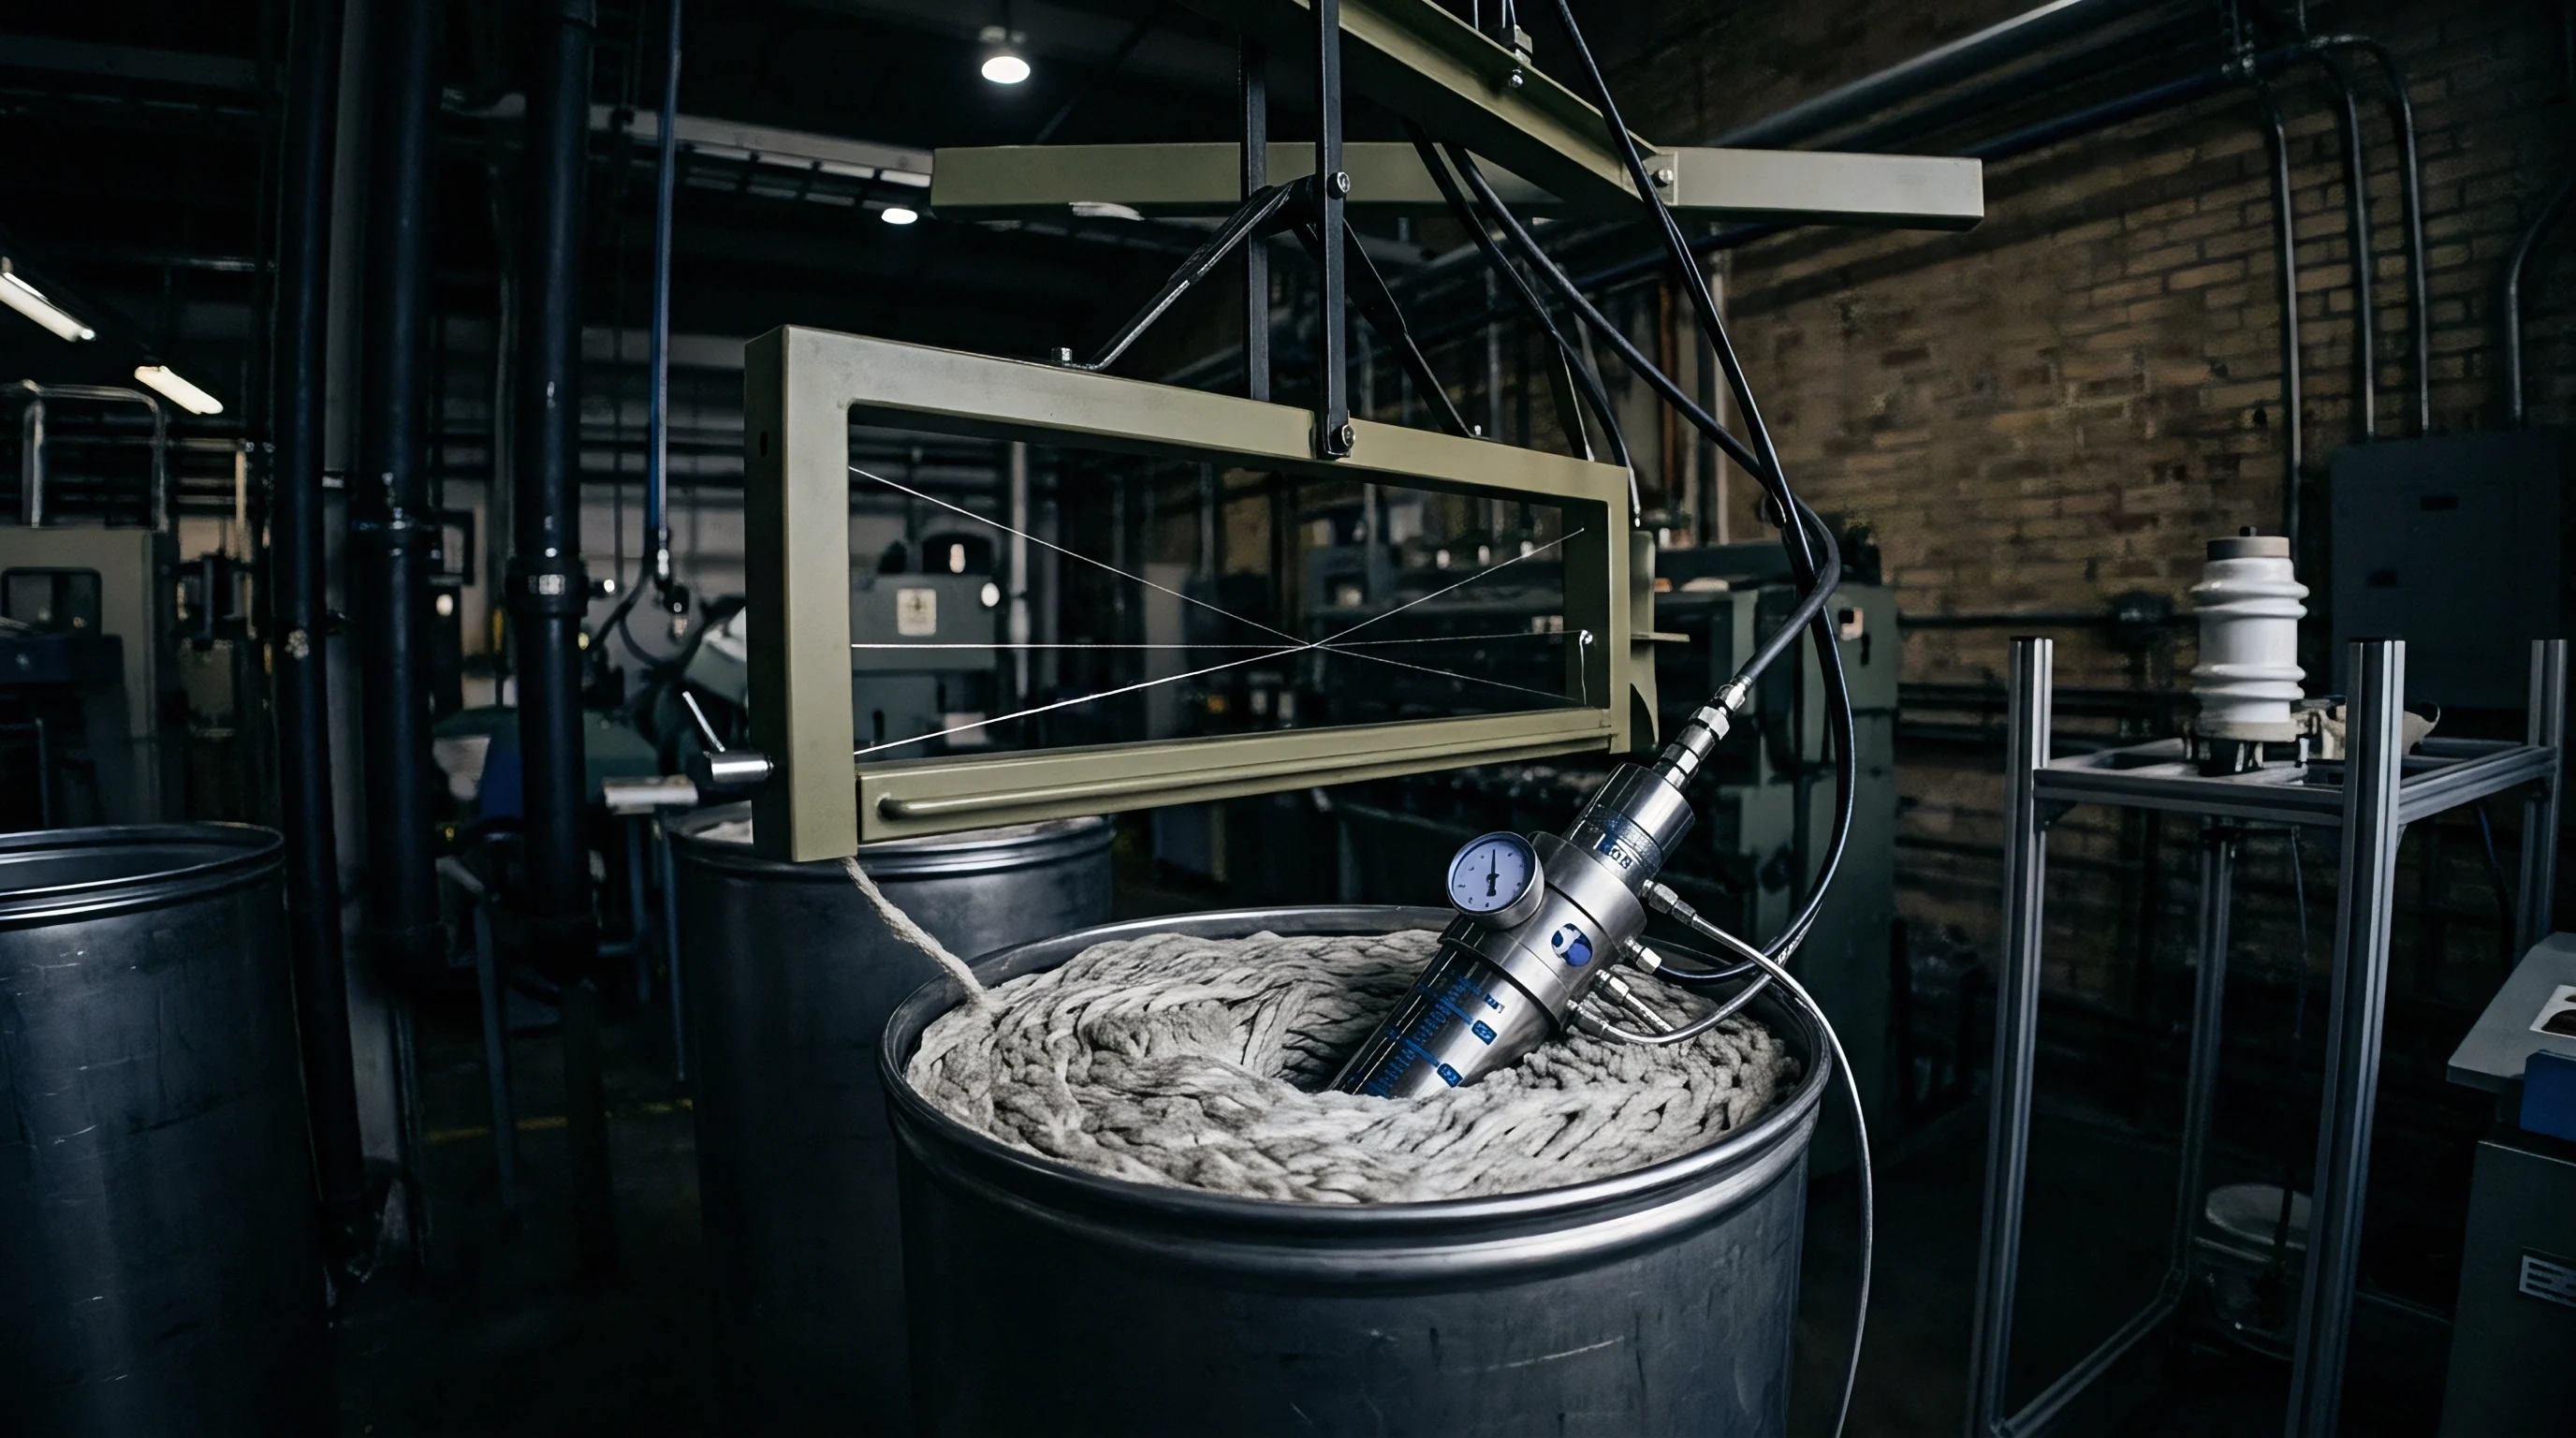
Ejection
Optical detection is useless if the pneumatic ejection system fails to knock contaminants out of the fast-moving tuft stream. Rejection manifolds sit immediately downstream of inspection chutes, housing arrays of fast-acting solenoid valves spaced every 5 to 10 millimeters across the duct width. Transport air carries tufts through the inspection zone at speeds up to 18 meters per second.
With 200 to 350 millimeters between the camera line and the air nozzles, synthetic particles cover that distance in just 11 to 19 milliseconds.
Calculating ejection timing requires exact synchronization between sensor line-scan clocks and valve driver electronics. Ejection timing breaks into three phases: target transit delay, valve opening latency, and air pulse duration. Target transit delay tdelay is the time a detected particle takes to move from the camera view to the nozzle bar.
This calculation relies on real-time air velocity vair measured by differential pressure sensors in the transport chutes:
tdelay = fracdsensor-to-nozzlevair – tvalve-latency
Solenoid valves have a mechanical latency tvalve-latency of 1.2 to 2.5 milliseconds from electrical signal to full open seat. Failing to subtract valve latency means the air blast fires after the polymer fragment has already passed, hitting clean cotton behind it while allowing the contaminant into the card chute.
Air delivery pressure provides the force needed to knock target particles out of the main air stream and into waste chutes. Supply lines run at operating pressures between 4.5 and 6.5 bar. Low pressure produces weak air jets that cannot penetrate dense tufts, leaving polymer film trapped inside fiber bunches.
Overly high pressure creates heavy turbulence inside the ejection chute, forming recirculation eddies that snatch diverted trash and hurl synthetic film back into the clean air channel.
Nozzle pulse duration balances removal efficiency against clean cotton loss. Valves release short compressed air bursts lasting 4 to 12 milliseconds. A 6-millisecond blast at 5 bar expands into a high-velocity air jet spanning roughly 30 to 50 millimeters of stream length.
Since opened cotton tufts measure 10 to 20 millimeters across, a single ejection event diverts the target contaminant along with two to four clean tufts. The ratio of lost clean fiber to ejected synthetic particles defines system selectivity.
Calibrating ejection timing requires a systematic hands-on procedure right on the operating line.
- Mount a high-speed differential pressure transducer into the pneumatic transport chute adjacent to the sensor inspection window to record actual transport air velocity under full load conditions.
- Lock the opening line feed roll speed to establish a steady-state mass flow rate of cotton tufts across transport ducts.
- Pass standard optical test markers containing embedded 5 mm x 5 mm white polypropylene film chips through optical chute inspection zones.
- Record raw temporal delay counts from initial optical detection signals to pneumatic ejection pulse arrivals using digital storage oscilloscope taps on valve driver circuits.
- Adjust target transit delay parameter registers in software until air jet centerlines align precisely with passing test marker locations.
- Set compressed air supply regulators to exactly 5.2 bar while monitoring nozzle bar distribution manifolds for pressure drops during multi-valve firing events.
- Parameterize nozzle pulse duration to the minimum millisecond window that maintains consistent 100 percent capture rates for test markers across ten consecutive passes.
- Verify waste collection chamber contents by weighing total fiber mass ejected across 100 test events to confirm clean cotton carry-over stays below 2.0 grams per trigger.
Selectivity drops sharply when multiple adjacent valves fire together. Spotting a wide sheet of polyethylene film triggers three to six neighboring nozzles across the array. Multi-valve firing drops local header pressure in the air manifold, extending valve closure times and lengthening the overall blast.
This pressure drop weakens the air jet velocity, reducing particle deflection angles into the waste chute. Control logic must enforce interlock limits that prevent more than four adjacent nozzles from opening at once without temporarily slowing down the feed rollers.
A simple rule guides blowroom technicians: if waste collection boxes contain long linked ropes of clean cotton, nozzle pulse duration is set too long or air pressure is too high.

Ledger
Sensor calibration settings ultimately show up on commercial ledgers. Synthetic contaminants that slip past blowroom detection move through carding, drawing, and spinning, turning from removable macro-trash into permanent yarn defects. Testing equipment categorizes synthetic faults using foreign matter frameworks like Uster Classimat metrics, placing polypropylene defects into CP-A, CP-B, CP-C, and CP-D classes based on length and thickness.
A single gram of white polypropylene tape entering the blowroom breaks down into thousands of fine filaments during carding and drawing, generating hundreds of meters of defective yarn.
Calculating financial losses means balancing the cost of clean fiber lost during ejection against commercial penalties on contaminated yarn shipments. Uncontaminated raw cotton costs roughly $2.10 per kilogram delivered to opening rooms. High-sensitivity sensor settings eject about 2.5 grams of good cotton per event.
Processing cotton with 50 synthetic contaminants per bale yields 125 grams of blowroom waste per bale, a direct fiber loss of $0.26 per bale. Easing sensor thresholds to cut waste carry-over to 0.5 grams per event saves $0.21 per bale in fiber cost, but lets residual synthetic tape escape into yarn streams.
| Parameterization Strategy | Ejection Waste per Bale (g) | Polypropylene Removal Efficiency (%) | Classimat CP Faults per 100 km | Yarn Quality Claims Risk ($/kg) | Net Landed Cost Impact per 10,000 m Fabric |
|---|---|---|---|---|---|
| Ultra-Aggressive (Low Threshold) | 250 | 98.5 | 0.2 | 0.00 | +$105.00 (High Fiber Loss) |
| Balanced Technical Optimum | 125 | 94.2 | 1.1 | 0.00 | $0.00 (Baseline Cost) |
| Relaxed (Low Waste Focus) | 35 | 71.0 | 8.6 | 0.45 | +$2,250.00 (Yarn Discounts) |
| SWIR Disabled (Visible Only) | 60 | 42.0 | 24.3 | 1.20 | +$6,000.00 (Fabric Rejections) |
Fabric claims multiply quickly when synthetic faults make it past spinning. Weaving and knitting mills turn contaminated yarn into grey fabric rolls. Synthetic polypropylene filaments do not take anionic, reactive, or direct dyes used for cotton.
After dyeing and finishing, white polypropylene strands stand out as bright white streaks across dark fabric. A single roll of 100 percent cotton woven fabric with just two polypropylene streaks per 100 meters gets downgraded from first-quality to second-quality stock, slashing its market value by 40 to 60 percent. A 10,000-meter batch of piece-dyed twill with synthetic defects can trigger commercial losses over $15,000 ~ dwarfing the annual compressed air and fiber waste costs of an optimized ejection system.
Downstream fabric downgrades caused by un-dyed polypropylene filaments reduce finished cloth value by up to 60 percent, making blowroom fiber ejection waste economically negligible by comparison.
International trade contracts enforce strict contamination terms under International Cotton Association (ICA) bylaws. Buyers receiving bales with heavy synthetic trash can open formal arbitration claims. Proving contamination requires lab evidence from raw cotton samples, blowroom waste logs, and yarn Classimat reports.
Keeping parameter logs from inline sensors gives mill managers verifiable proof of incoming contamination levels, enabling sourcing teams to file claims against merchants for raw material quality failures.
Customs rules and tariff schedules also enforce strict fiber purity definitions. Exporting yarn or fabric declared as 100 percent combed cotton requires meeting strict regulatory standards. Under United States Harmonized Tariff Schedule (HTS) Section XI notes and European Union Combined Nomenclature rules, synthetic contamination exceeding allowed thresholds can invalidate origin classifications, exposing importers to reclassification, higher duty rates, and misdeclaration penalties.
Standard purchase contracts for high-grade combed cotton now routinely include explicit quality clauses: “The buyer reserves the right to reject raw cotton lots that generate exceeding 120 optoelectronic rejection events per 100 kilograms processed at standard parameter settings, or to debit the seller $3.50 per kilogram for all blowroom ejection waste collected above baseline thresholds.”