Quantifying Head to Tail Color Tailing in Continuous Dyeing
Continuous color tailing is quantified by calculating spectro CIE2000 deltas along the run length and prevented by matching pad feed dosing factors to dye substantivity rates.
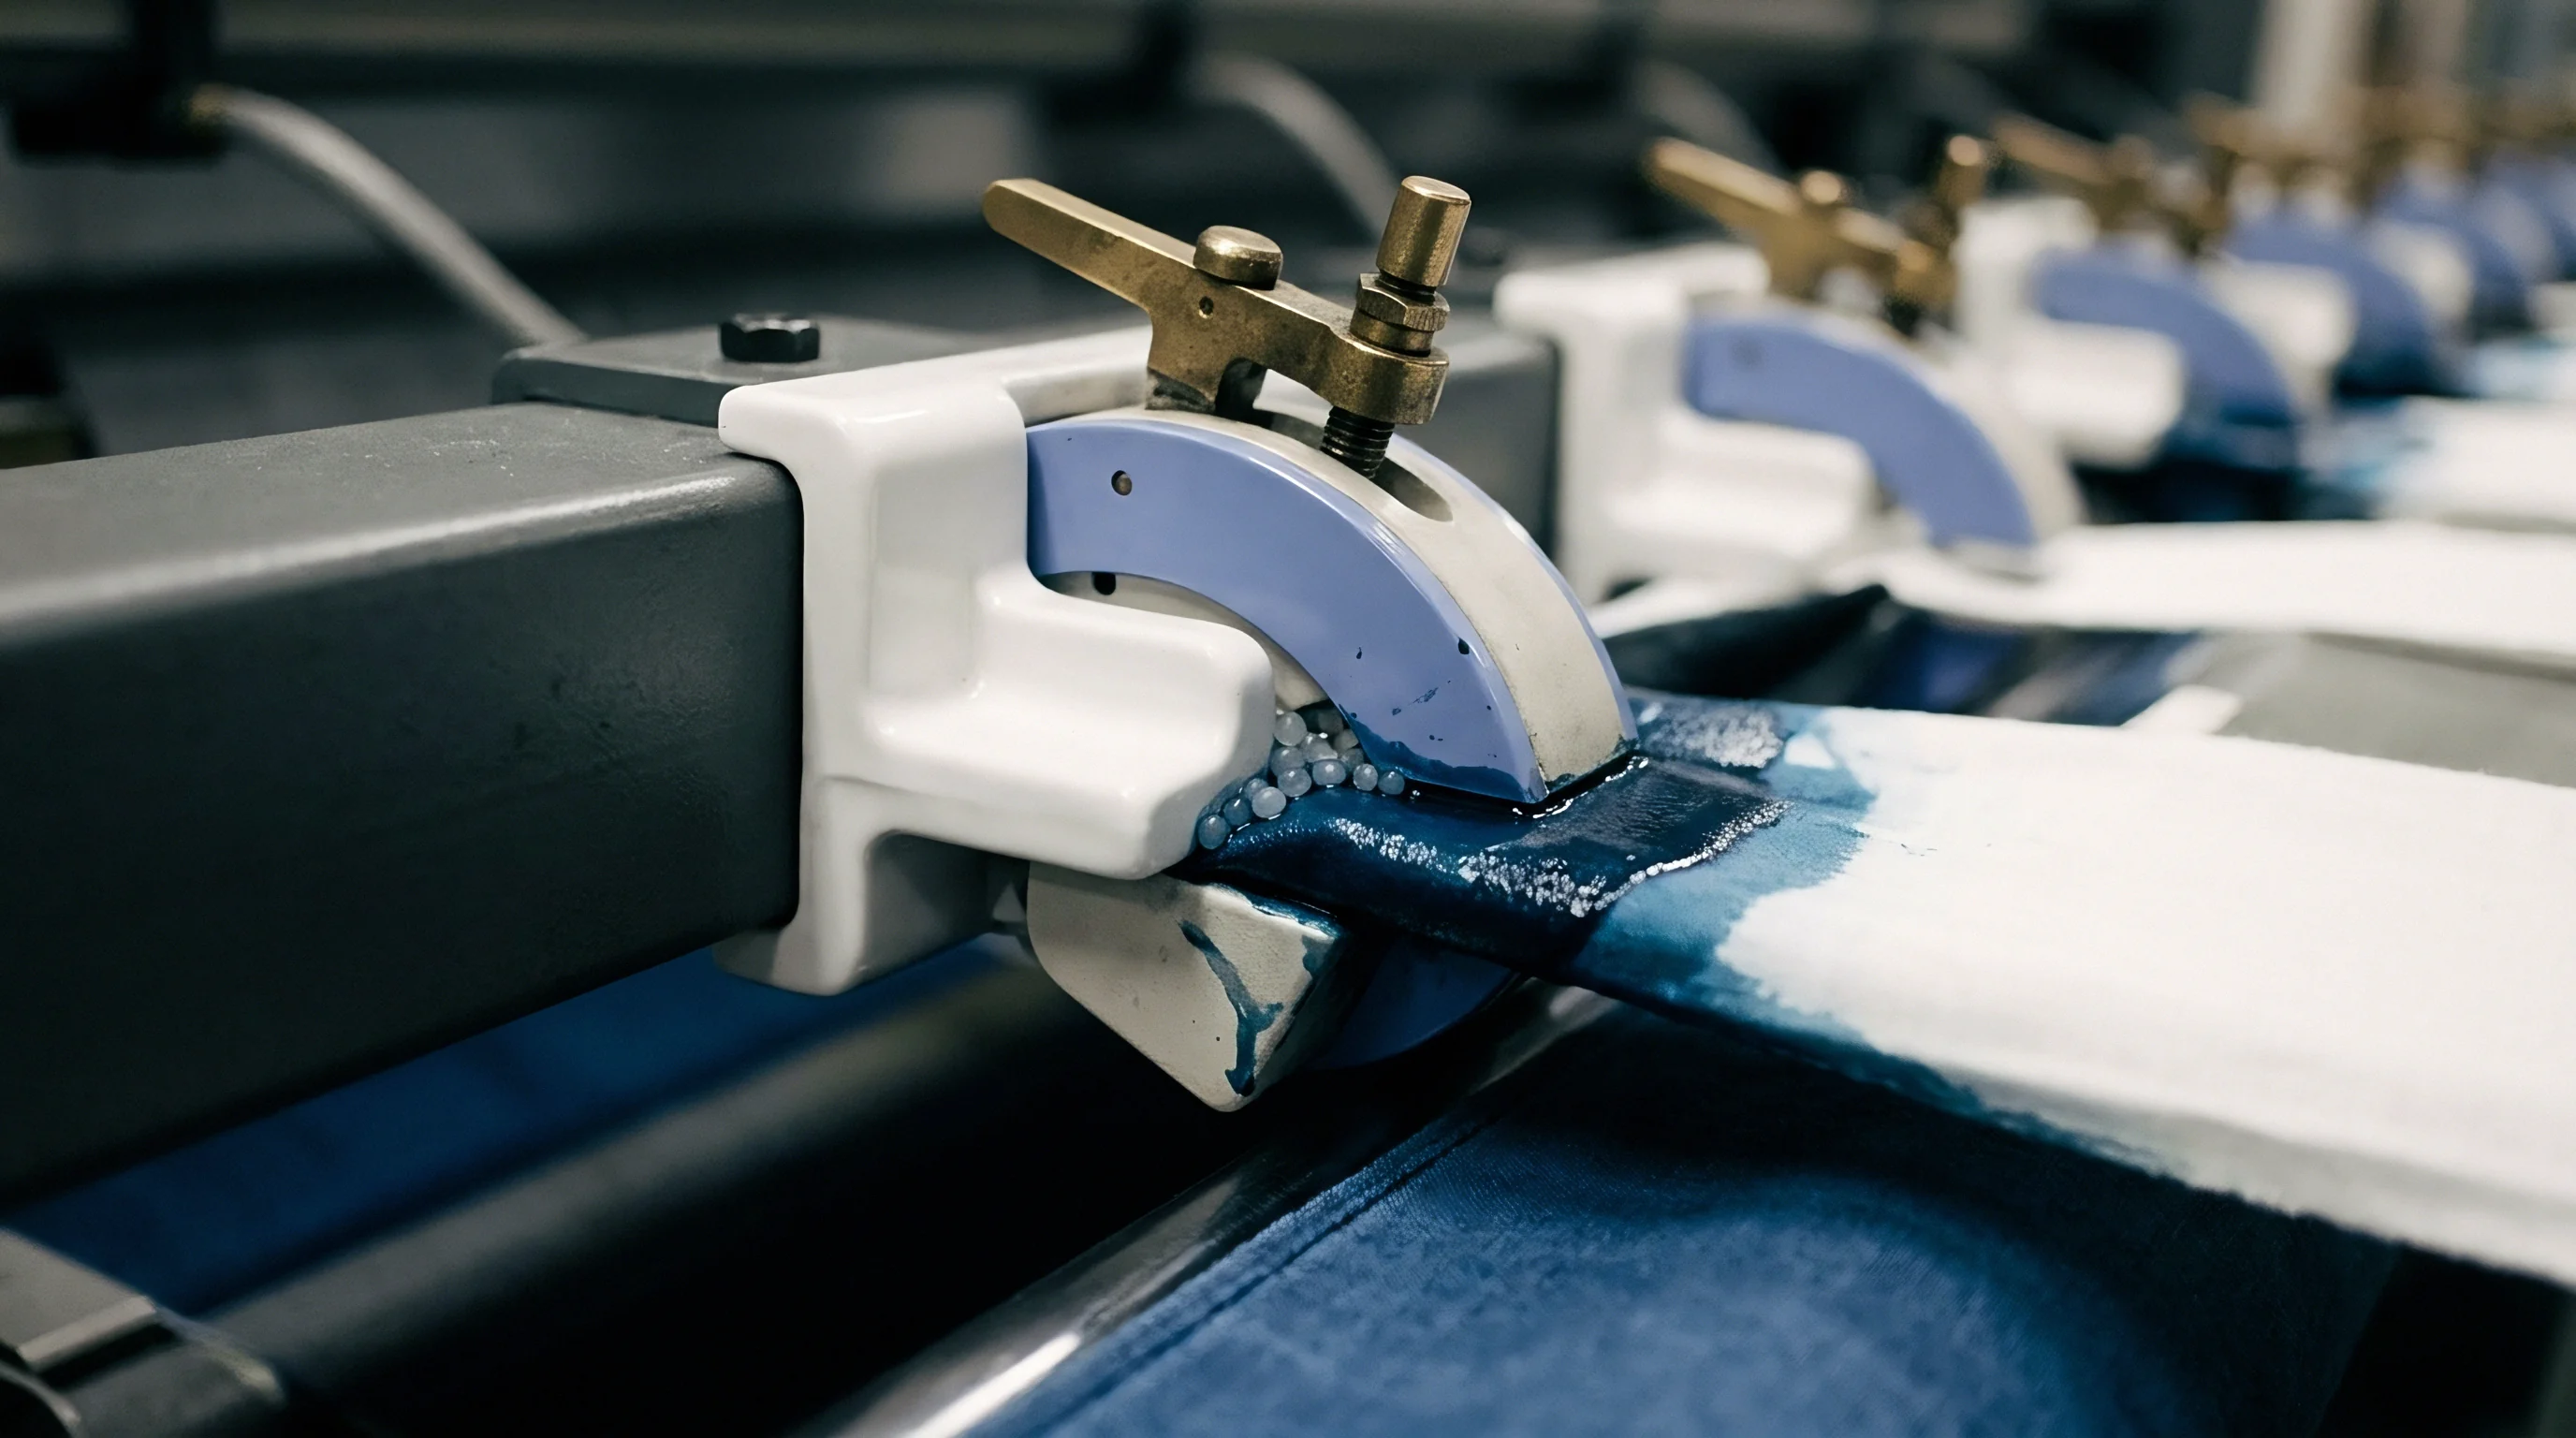

Depletion
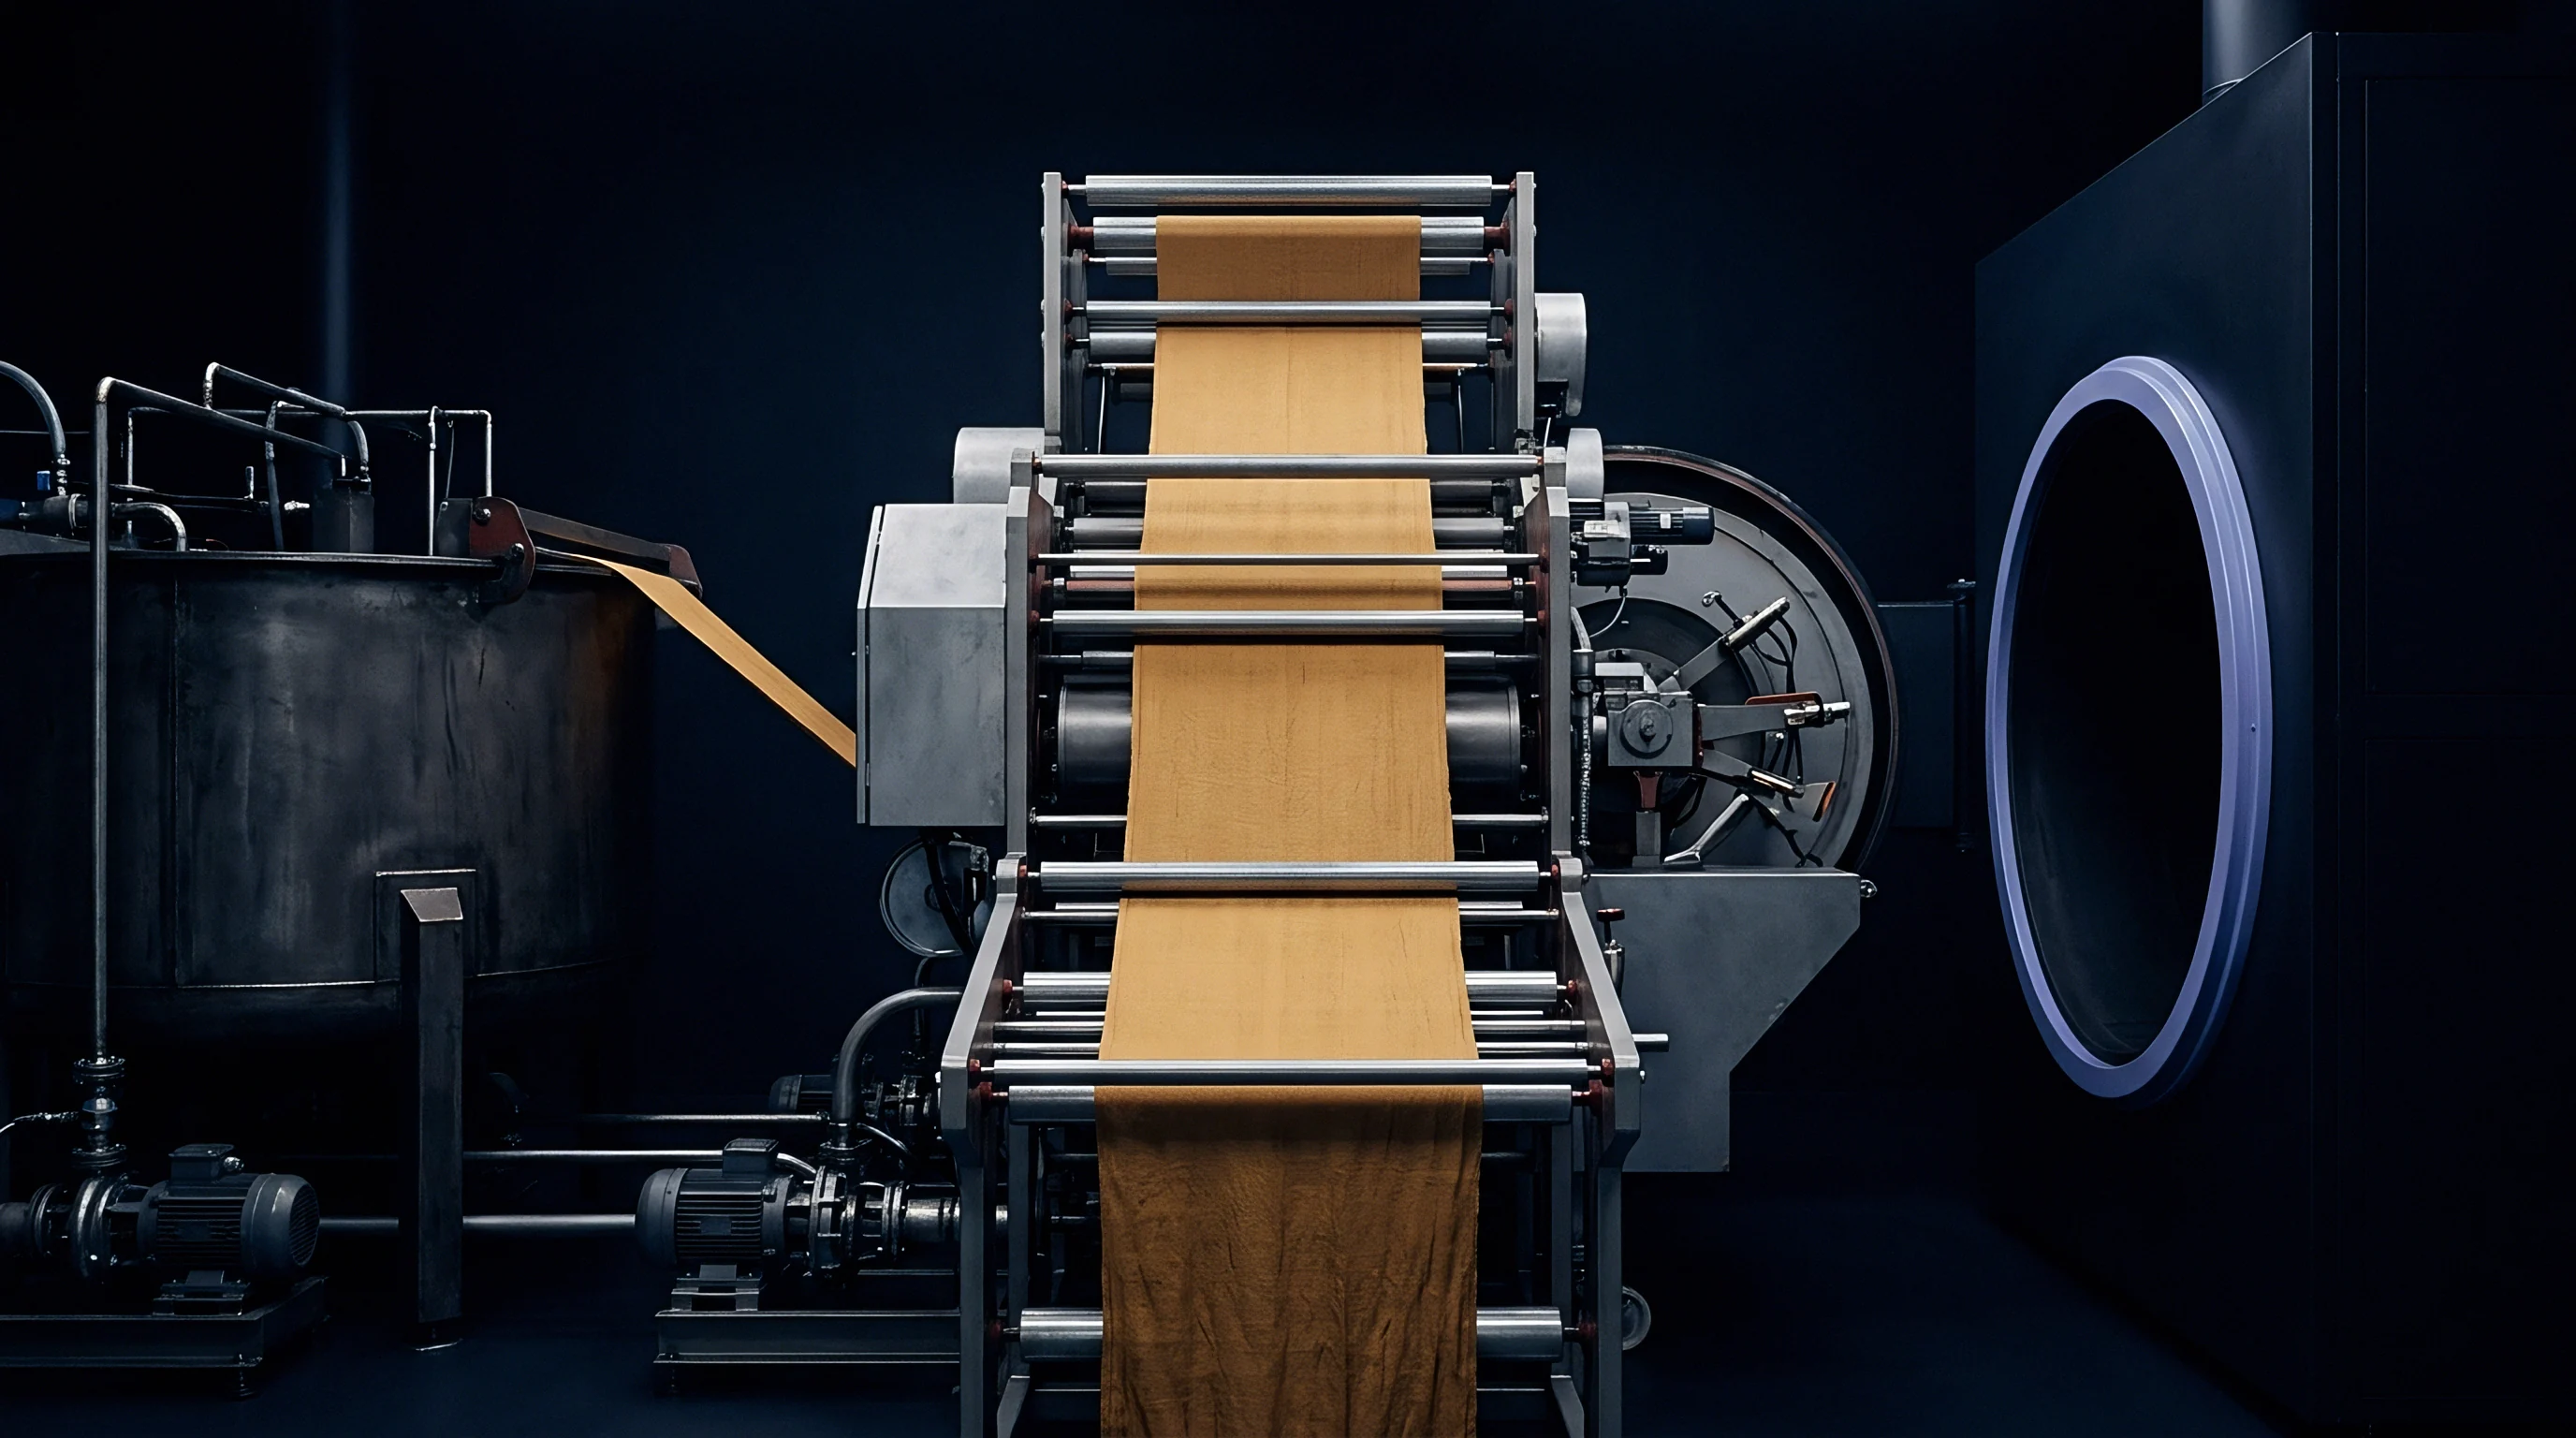
Continuous pad-dyeing operations experience progressive shade drift when the rate of dye molecule adsorption onto moving textile substrate exceeds the mass addition rate of fresh dye liquor entering the pad trough. This mechanism produces tailing, a systematic alteration in color depth and chromaticity from the head of the production run to the tail. In pad-steam or pad-dry continuous dyeing of cotton, polyester, or blended woven fabrics, dye molecules migrate from the bath onto the wet fiber matrix at rates governed by individual chemical affinity.
High-affinity dyestuffs exit the bath rapidly during initial fabric contact. Lower-affinity dyes remain in the liquor phase longer. Without precise mathematical calibration of the feed dye liquor concentration, the pad trough liquor becomes progressively depleted of high-substantivity components, causing the fabric to exit the nip at a lighter depth or altered hue over long continuous yardages.
High Substantivity Adsorption Dynamics
Substantivity defines the thermodynamic affinity of a dye molecule for the textile fiber relative to its solubility in the surrounding aqueous padding medium. In direct and reactive dyeing of cellulosic fibers, dyestuffs exhibiting elevated substantivity transfer onto the fabric faster than the wet pickup volume would suggest. The ratio of dye concentration on the fiber to dye concentration in the bath exceeds unity during the initial wet-out phase.
Wet pickup measures the mass of liquor retained per unit mass of dry cloth after passing through the pad nip, typically set between 50 percent and 70 percent for woven cotton. If a dye solution has high substantivity, the fabric strips dye from the bath faster than it consumes the water volume. Consequently, the remaining padding bath concentration drops continuously over time.
Dye affinity drives pick-up. Tail end fabric swatches show measurable loss of color strength when measured on a spectrophotometer relative to head swatches cut within the first one hundred meters of the run.
Initial pad bath volume must turn over three times before dye liquor concentration reaches steady-state equilibrium during continuous padding operations.

Differential Affinity in Trichromatic Systems
Dyeing commercial shade matches requires combination recipes containing three distinct dyestuffs to achieve targeted target coordinates. In a trichromatic mix containing yellow, red, mebrance, or blue components, each dyestuff molecule possesses a unique chemical structure, molecular weight, and substantivity profile. Sulfonated reactive dyes, for instance, display varying degrees of salt sensitivity and thermal reactivity.
If the blue dye component exhibits a higher substantivity index than the yellow and red components, the blue dye exhausts into the substrate at a faster rate inside the trough. The pad liquor becomes enriched with yellow and red dyes while lacking adequate blue dye concentration. The fabric exhibits a visible color shift along the roll length, moving from a balanced target hue at the head to a warmer, yellowish-red hue at the tail.
Color tailing is therefore both a depth defect and a directional hue shift across three-dimensional color space.
Quantifying mass balance inside the pad trough requires solving the differential balance equation governing dye replenishment. Let V represent the fixed volume of liquor in the pad trough measured in liters. Let C0 represent the initial concentration of dye in the trough at startup, expressed in grams per liter.
Let Cf represent the concentration of the feed dye liquor continuously pumped into the trough during operation. Let M represent the dry fabric speed in meters per minute, W represent fabric weight in grams per linear meter, and P represent wet pickup percentage. The volumetric rate of liquor consumption R in liters per minute equals:
R = fracM × W × P100000
When dye molecules undergo preferential absorption, an affinity factor K modifies the rate of dye removal. For dyes where K > 1, the dye concentration in the trough C(t) at run time t obeys the continuous mass balance relationship:
V fracdC(t)dt = R · Cf – R · K · C(t)
Solving this differential equation yields the time-dependent bath concentration profile:
C(t) = fracCfK + left( C0 – fracCfK right) expleft( -fracR · KV t right)
To eliminate tailing entirely across a run of length T, the concentration in the trough must remain constant (C(t) = C0). Setting the derivative to zero yields the required feed liquor concentration adjustment ratio:
Cf = K · C0
A dye bath exhibiting an affinity factor of 1.25 requires a feed liquor concentration 25 percent higher than the initial trough concentration. Tail swatches reveal depletion. Failure to adjust feed concentration causes the trough concentration to asymptote down to C0 / 1.25, representing a 20 percent loss in bath strength at equilibrium state.
Dyehouses frequently explain end-to-end shade shifts as inevitable variations in raw fabric absorbency or moisture regain across grey cloth rolls.

Bath
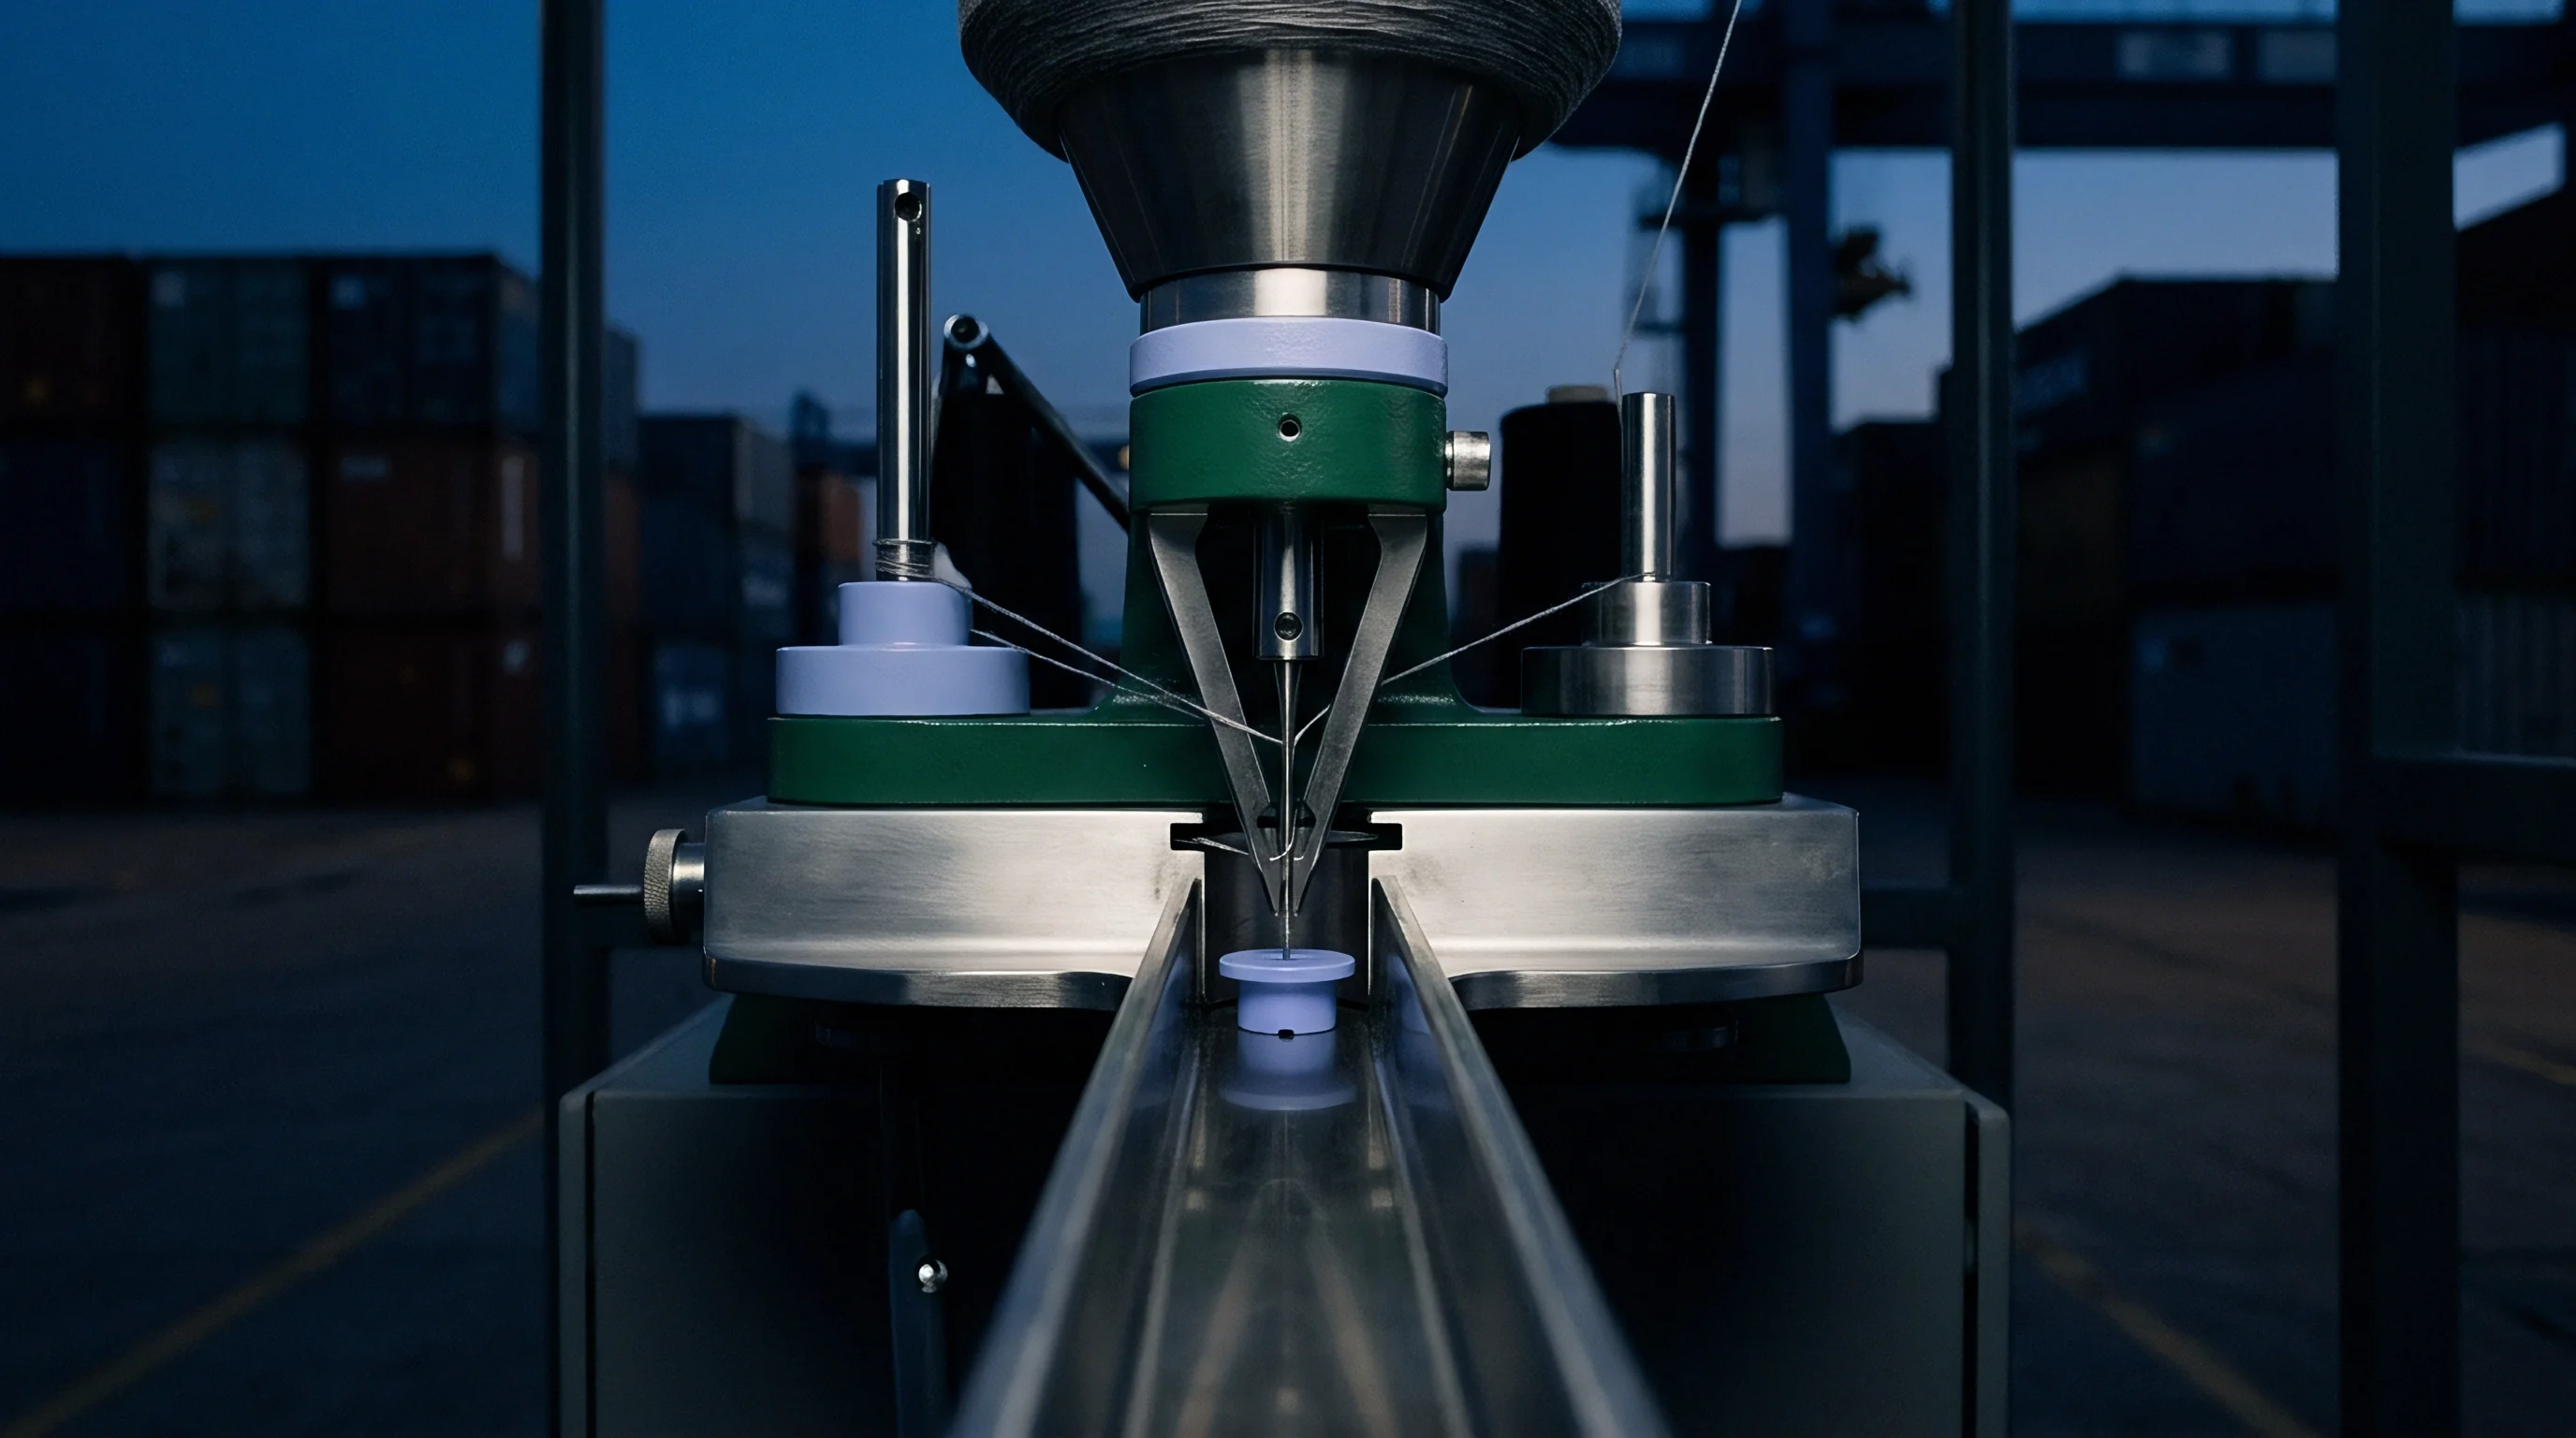
Maintaining color consistency along continuous runs of several thousand meters demands steady-state liquor concentration inside the padding trough. The mechanical volume of the trough dictates how rapidly the liquor turns over during production. Minimizing pad trough volume reduces the total time required to reach thermodynamic equilibrium between the incoming feed solution and the bath.
Modern low-volume pad troughs hold between 5 and 15 liters of dye liquor, equipped with displacement units to prevent stagnant zones. Fast feeds increase tailing. Smaller trough capacities permit rapid exchange of liquor, minimizing the physical length of fabric dyed under non-equilibrium transitional conditions.
Large volume troughs holding 50 to 100 liters amplify tailing defects by extending the transitional tailing phase across thousands of fabric meters before concentration stabilizes.
Pad Trough Design and Turn over Time
Turnover time represents the duration required for the moving fabric to consume a volume of dye liquor equal to the full capacity of the padding trough. Calculating turnover time involves dividing total trough liquor volume by volumetric consumption rate. Shorter turnover times compress the tailing zone to the immediate lead end of the batch.
High-speed continuous lines running at 80 meters per minute through an 8-liter displacement trough achieve turnover times under 45 seconds. Under these mechanical conditions, steady-state padding conditions establish within the first 150 meters of fabric pass. Conversely, slow continuous ranges operating at 20 meters per minute with a 40-liter trough require up to 10 minutes for a single turnover, extending the unstable tailing zone past 800 meters.
Cold troughs slow diffusion.
Dosing Feed Concentration Factor Math
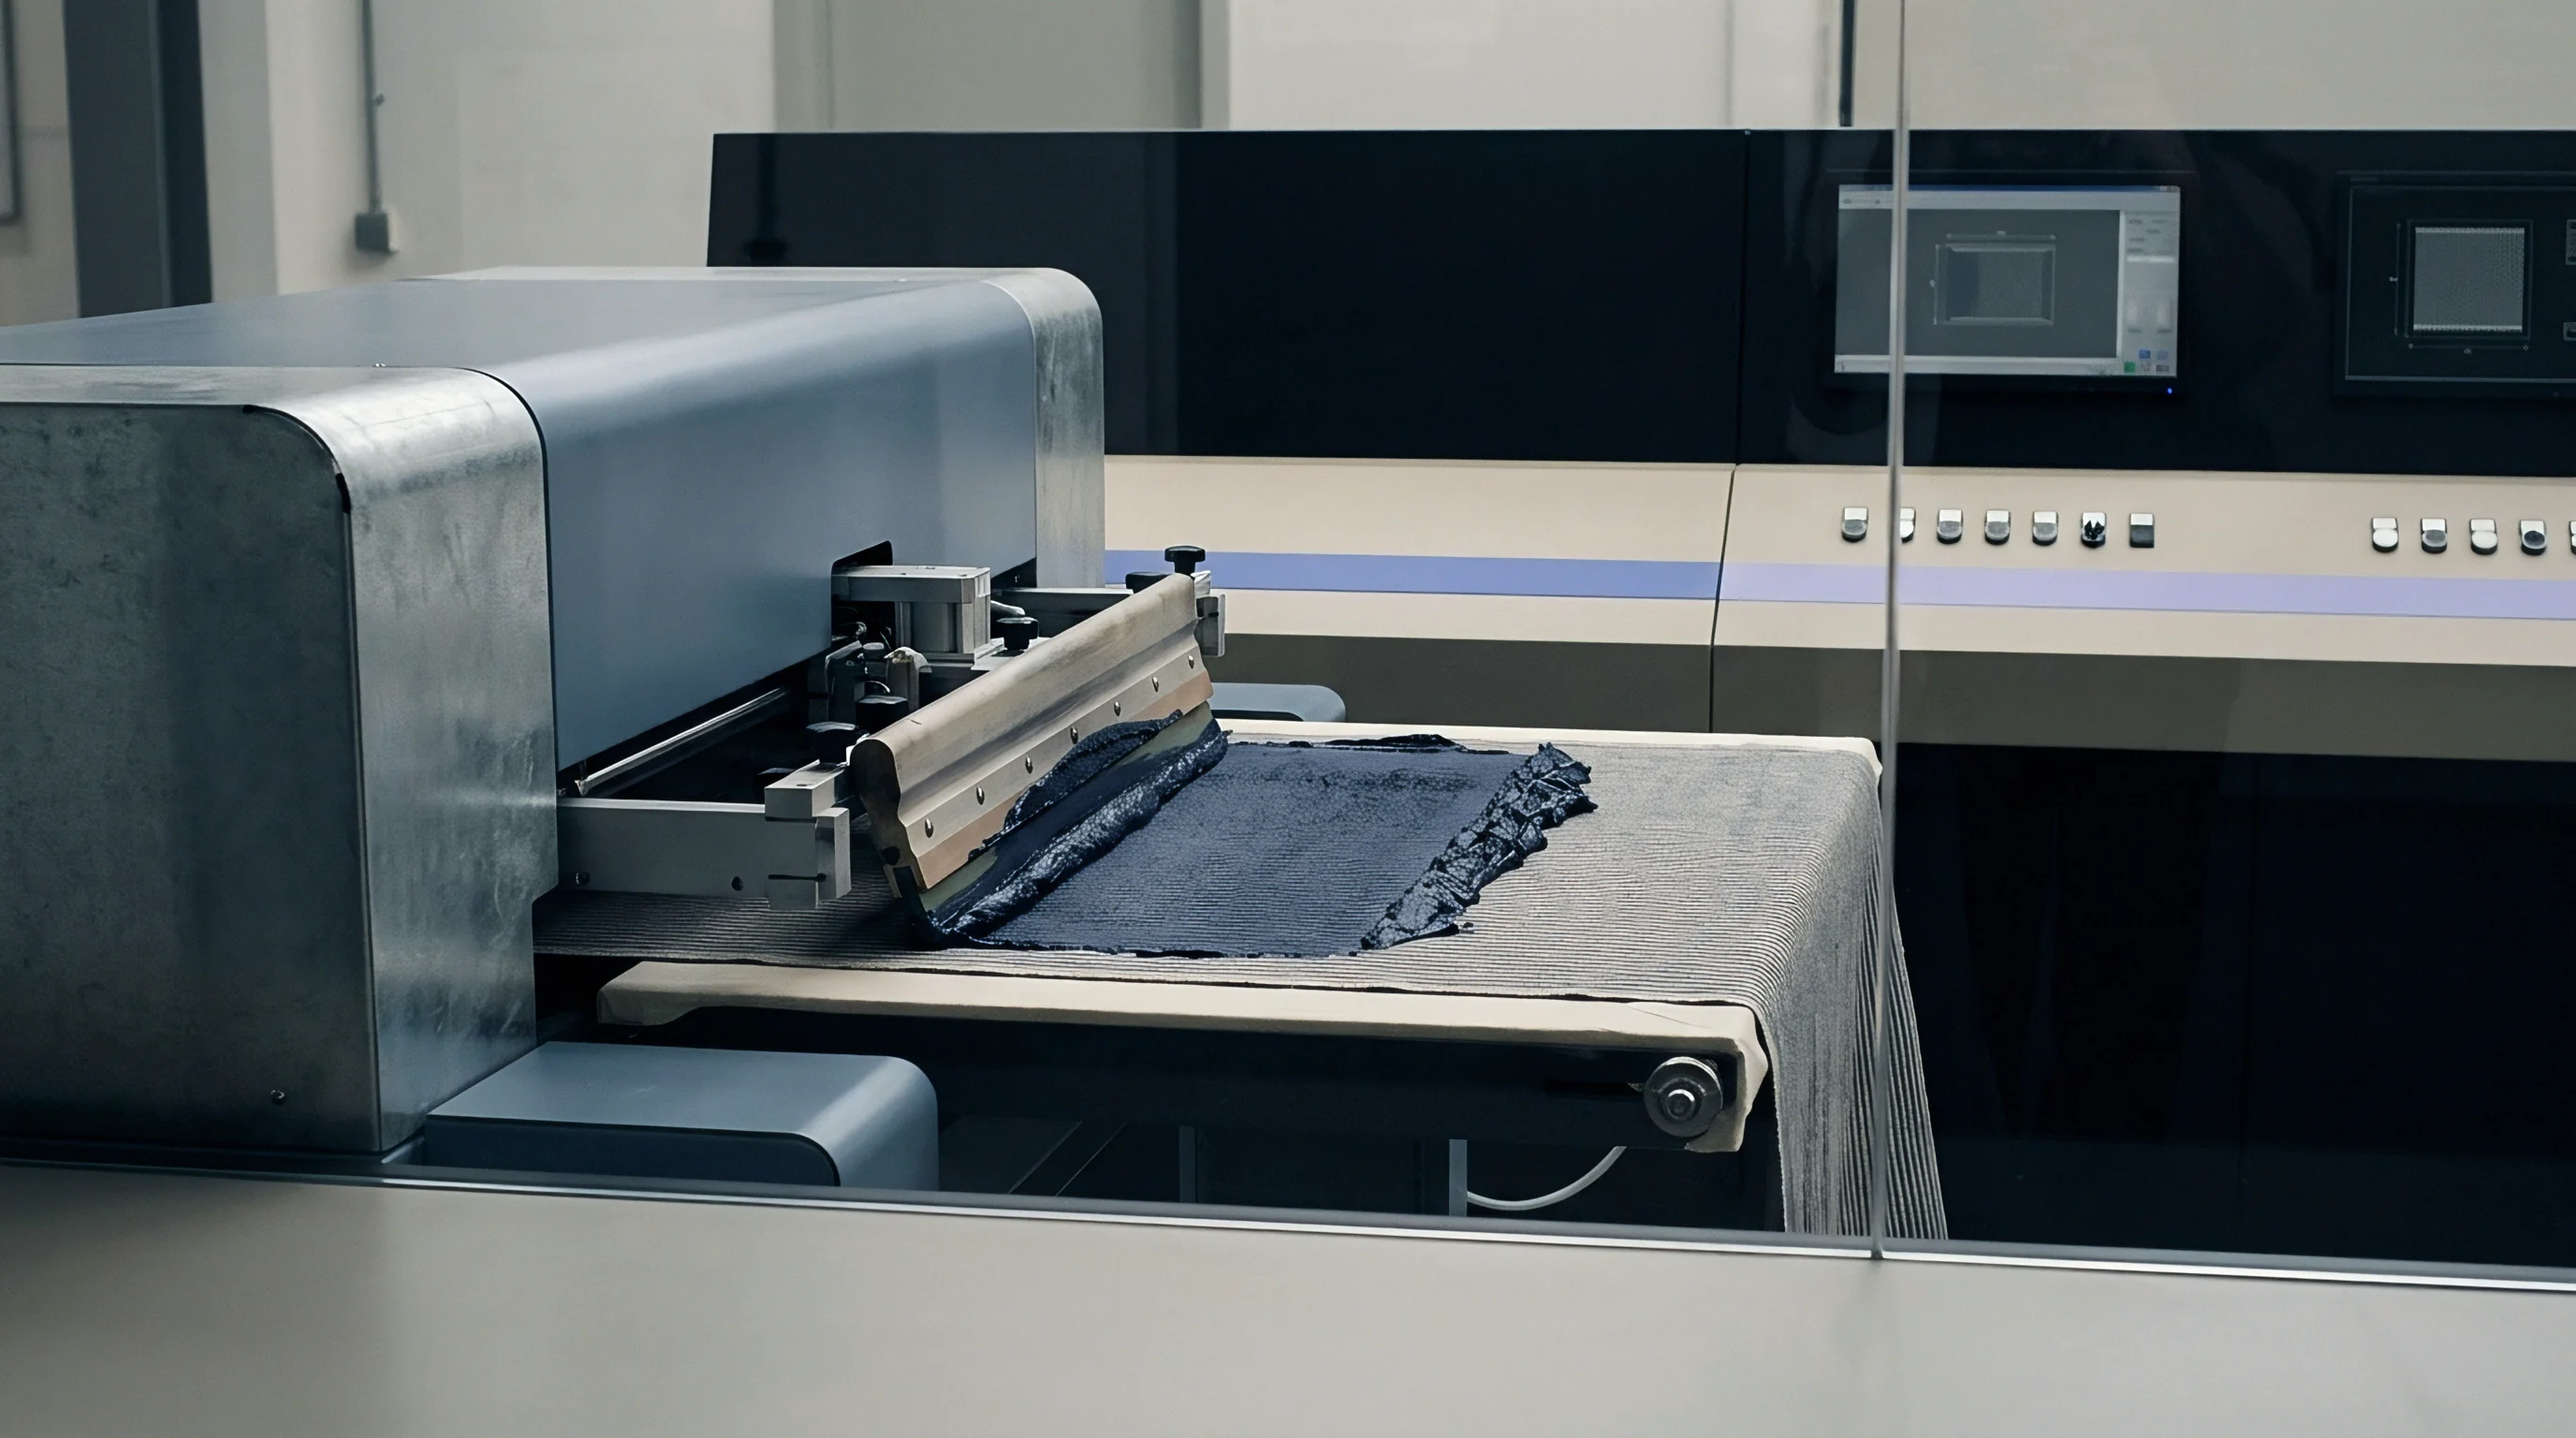
Dyes are categorized by their propensity to tail into low, medium, and high substantivity groupings. Determining the feed factor requires empirical lab testing or historical database lookup for specific dye combinations on target fabric constructions. Dosing pumps deliver feed liquor from preparation tanks directly into the pad trough based on level sensor triggers.
The level sensor maintains precise volume control, preventing dilution or overfilling during long continuous shifts.
| Dye Class | Substantivity Index (K) | Equilibrium Turnover (L) | Required Feed Ratio (Cf/C0) | Tailing Drift without Feed Factor |
|---|---|---|---|---|
| Low-Affinity Reactive (Vinyl Sulfone) | 1.02 – 1.08 | 15 – 25 | 1.05 | ΔE < 0.4 (Negligible) |
| Medium-Affinity Reactive (Bi-Functional) | 1.10 – 1.22 | 30 – 45 | 1.15 | ΔE 0.8 – 1.4 (Moderate) |
| High-Affinity Vat (Indanthrone Class) | 1.25 – 1.45 | 60 – 90 | 1.35 | ΔE 1.8 – 3.2 (Severe Rejection) |
| Disperse Dyes (High Molecular Weight) | 1.01 – 1.05 | 10 – 15 | 1.03 | ΔE < 0.3 (Acceptable) |
| Acid Dyes (Polyamide Substrates) | 1.18 – 1.35 | 40 – 70 | 1.25 | ΔE 1.5 – 2.6 (Severe Rejection) |
Implementing targeted corrections during padding preparation prevents systematic color drift across large commercial shipments.
- Concentration Stepping Protocols require preparing two separate dye tanks: a starting bath tank charged at nominal concentration C0 and a replenishment feed tank charged at elevated concentration Cf.
- Trough Level Calibration Failures occur when level probes drift, altering active trough volume and distorting calculated liquor turnover rates.
- Substrate Temperature Variations introduce liquor absorption spikes when hot fabric from pre-dryers enters cold pad bath channels.
- Chemical Feed Line Clogging starves the pad trough of high-concentration replenishment liquor, triggering immediate tailing drift toward lighter shades.
Low trough volume combined with calculated feed concentration factors prevents visible shade tailing across continuous runs.
A narrow pad trough running high velocity fabric under continuous level control delivers consistent color depth across thousands of meters without manual operator adjustment.
Metrics
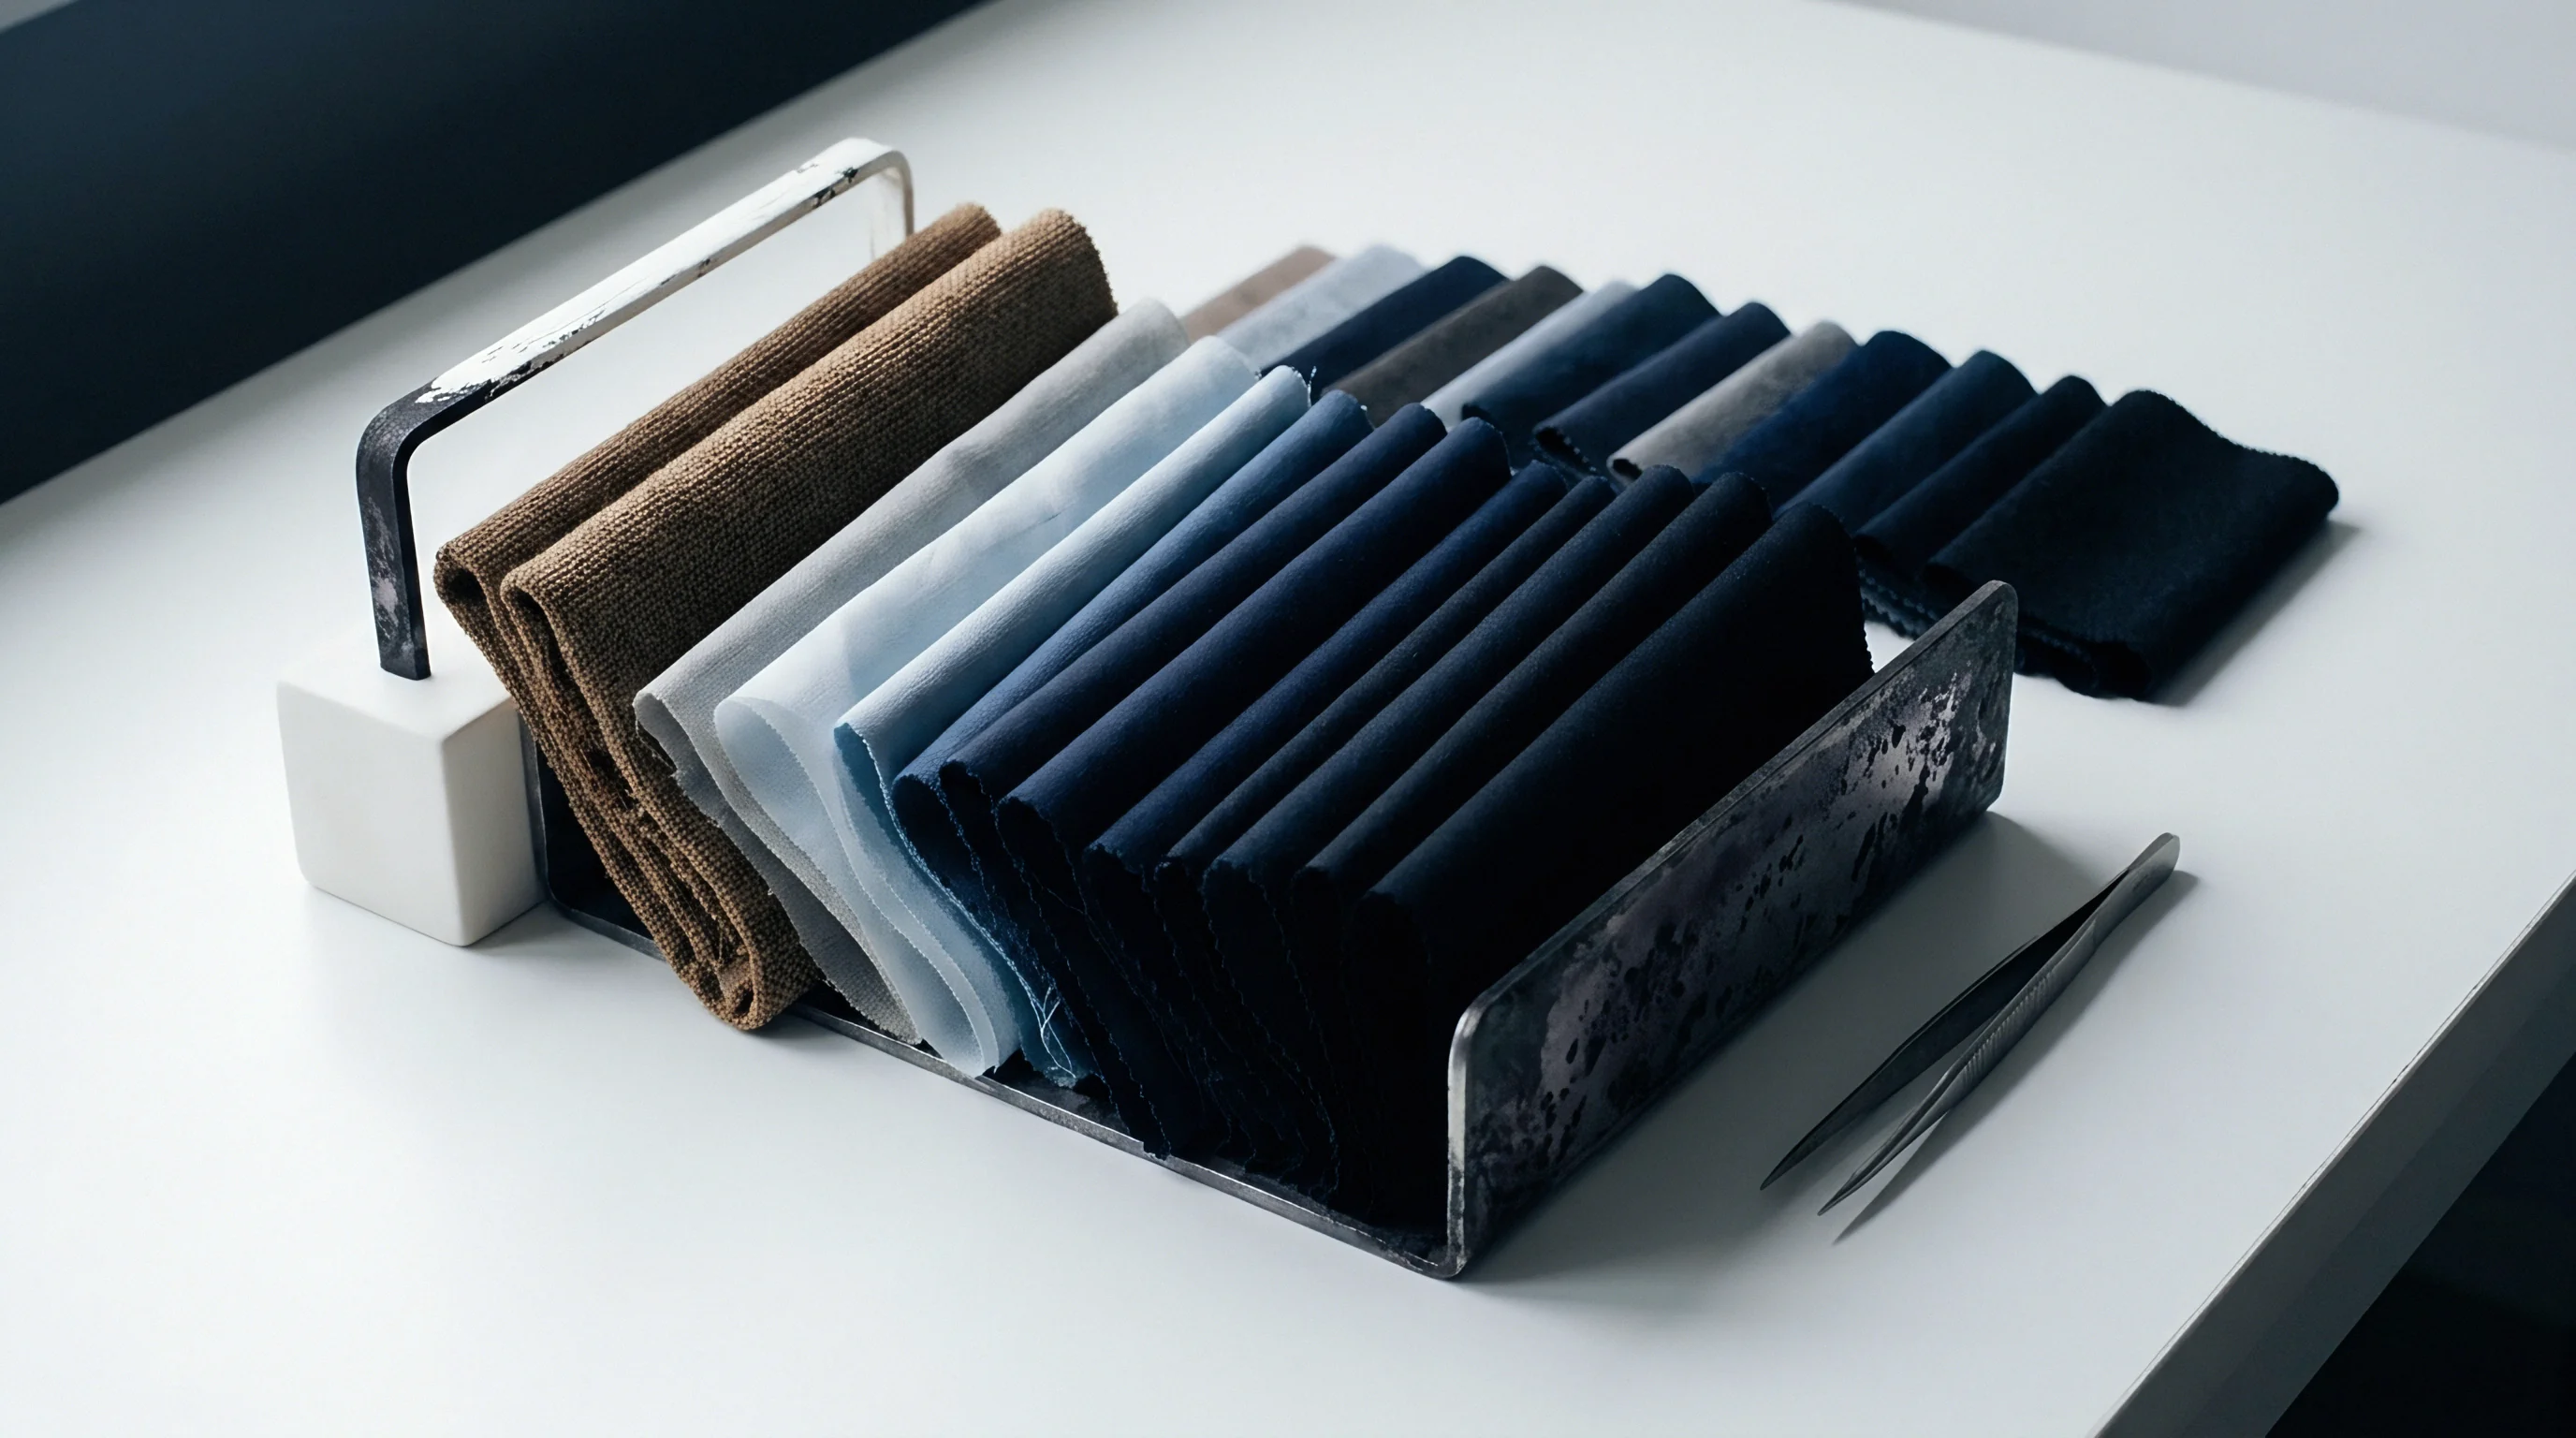
Quantifying head-to-tail color shifts along a continuous roll requires spectrophotometric evaluation at defined linear intervals rather than isolated end-piece swatch checks. Color measurement equipment must capture spectral reflectance data across the visible spectrum from 400 nm to 700 nm. Standard quality control protocols require cutting physical swatches at the 10-meter mark, 50-meter mark, and subsequently every 500 meters until the end of the dye run.
Spectrophotometer geometry must utilize spherical d/8circ or 45circ/0circ optical configurations with D65 illuminant settings and a 10circ standard observer angle. Evaluating color difference relies on calculating chromatic coordinate deltas within standard color spaces defined by the International Commission on Illumination.
Spectrophotometric Sampling and CIELAB Color Geometry
Color coordinates in CIELAB space represent light-dark values as L , red-green shifts as a , and yellow-blue shifts as b. Comparing a tail swatch against a head swatch yields individual delta values: Δ L , Δ a , and Δ b. Total color difference Δ E ab combines these directional vectors into a single scalar metric:
Δ E ab = sqrt(Δ L )2 + (Δ a )2 + (Δ b )2
Relying solely on total color difference can obscure directional tailing issues. A roll exhibiting a Δ E ab of 0.8 might carry a light-dark drift that is acceptable to garment cutters, or a hue shift that causes panel mismatch during apparel assembly. Fixation yield governs depth.
Spectrophotometric software must isolate lightness change Δ L from chroma change Δ C and hue change Δ H. Progressive increases in Δ L across a production run signal systemic dye bath exhaustion.
Evaluation via CMC and CIE2000 Equations
Modern textile compliance standards mandate non-linear color tolerance formulas that align closely with visual human perception. The CMC(l:c) equation establishes an ellipsoidal tolerance space around target coordinates, adjusting acceptable boundaries based on position in color space. For commercial apparel fabric acceptance, CMC set at a 2:1 ratio allows twice the tolerance for brightness variations as for hue shifts.
The CIE2000 color difference formula (Δ E00) incorporates specific rotation terms to resolve perceptual discontinuities in blue and neutral gray regions.
| Metric Equation | Head-to-Tail Pass Limit | Tolerated Hue Shift (Δ H) | Primary Application Scope | Border Clearance Failure Risk |
|---|---|---|---|---|
| CIELAB (Δ E ab) | ≤ 0.80 units | ≤ 0.30 units | Legacy industrial specifications | High false-rejection rate on bright shades |
| CMC (2:1) | ≤ 0.75 units | ≤ 0.25 units | Retail apparel and brand sourcing | Moderate risk on strict shade matching contracts |
| CIE2000 (Δ E00) | ≤ 0.65 units | ≤ 0.20 units | Military, automotive, high-spec textiles | Low risk; reflects human eye perception |
| 555 Shade Index Shift | Single box (e.g. 555 to 555) | Zero box leap | High-volume garment panel cutting | High risk of cut-panel shading if unsegregated |

When Does 555 Shade Sorting Fail Continuous Runs?
Shade sorting systems categorize continuous fabric rolls into discrete numerical bins to facilitate uniform garment assembly. The 555 sorting protocol assigns a three-digit code representing lightness, chroma, and hue relative to an established standard. The central target shade receives the code 5-5-5.
Rolls falling into adjacent bins such as 5-5-4 or 5-6-5 pass inspection provided garment factories assemble cut parts from matching shade numbers. Shade sorting flags rolls. However, 555 sorting breaks down when internal roll tailing exists within a single continuous roll.
If the head of a 1000-meter roll measures 5-5-5 while the tail drifts to 5-4-6, assigning a single shade number to the entire roll guarantees panel shading when markers span the full length of the bolt. Continuous automated inline spectrophotometers monitor fabric edge-to-edge and head-to-tail during rewinding to detect intra-roll tailing before shipping.
Contractual purchase orders specifying ISO 105-J03 color calculation methods bind dyehouses to objective CIE2000 tolerances over subjective visual approvals.
Standard purchase order terms incorporating ISO 105-J03 force mills to replace out-of-spec rolls whenever tailing exceeds specified CIE2000 thresholds.

Migration
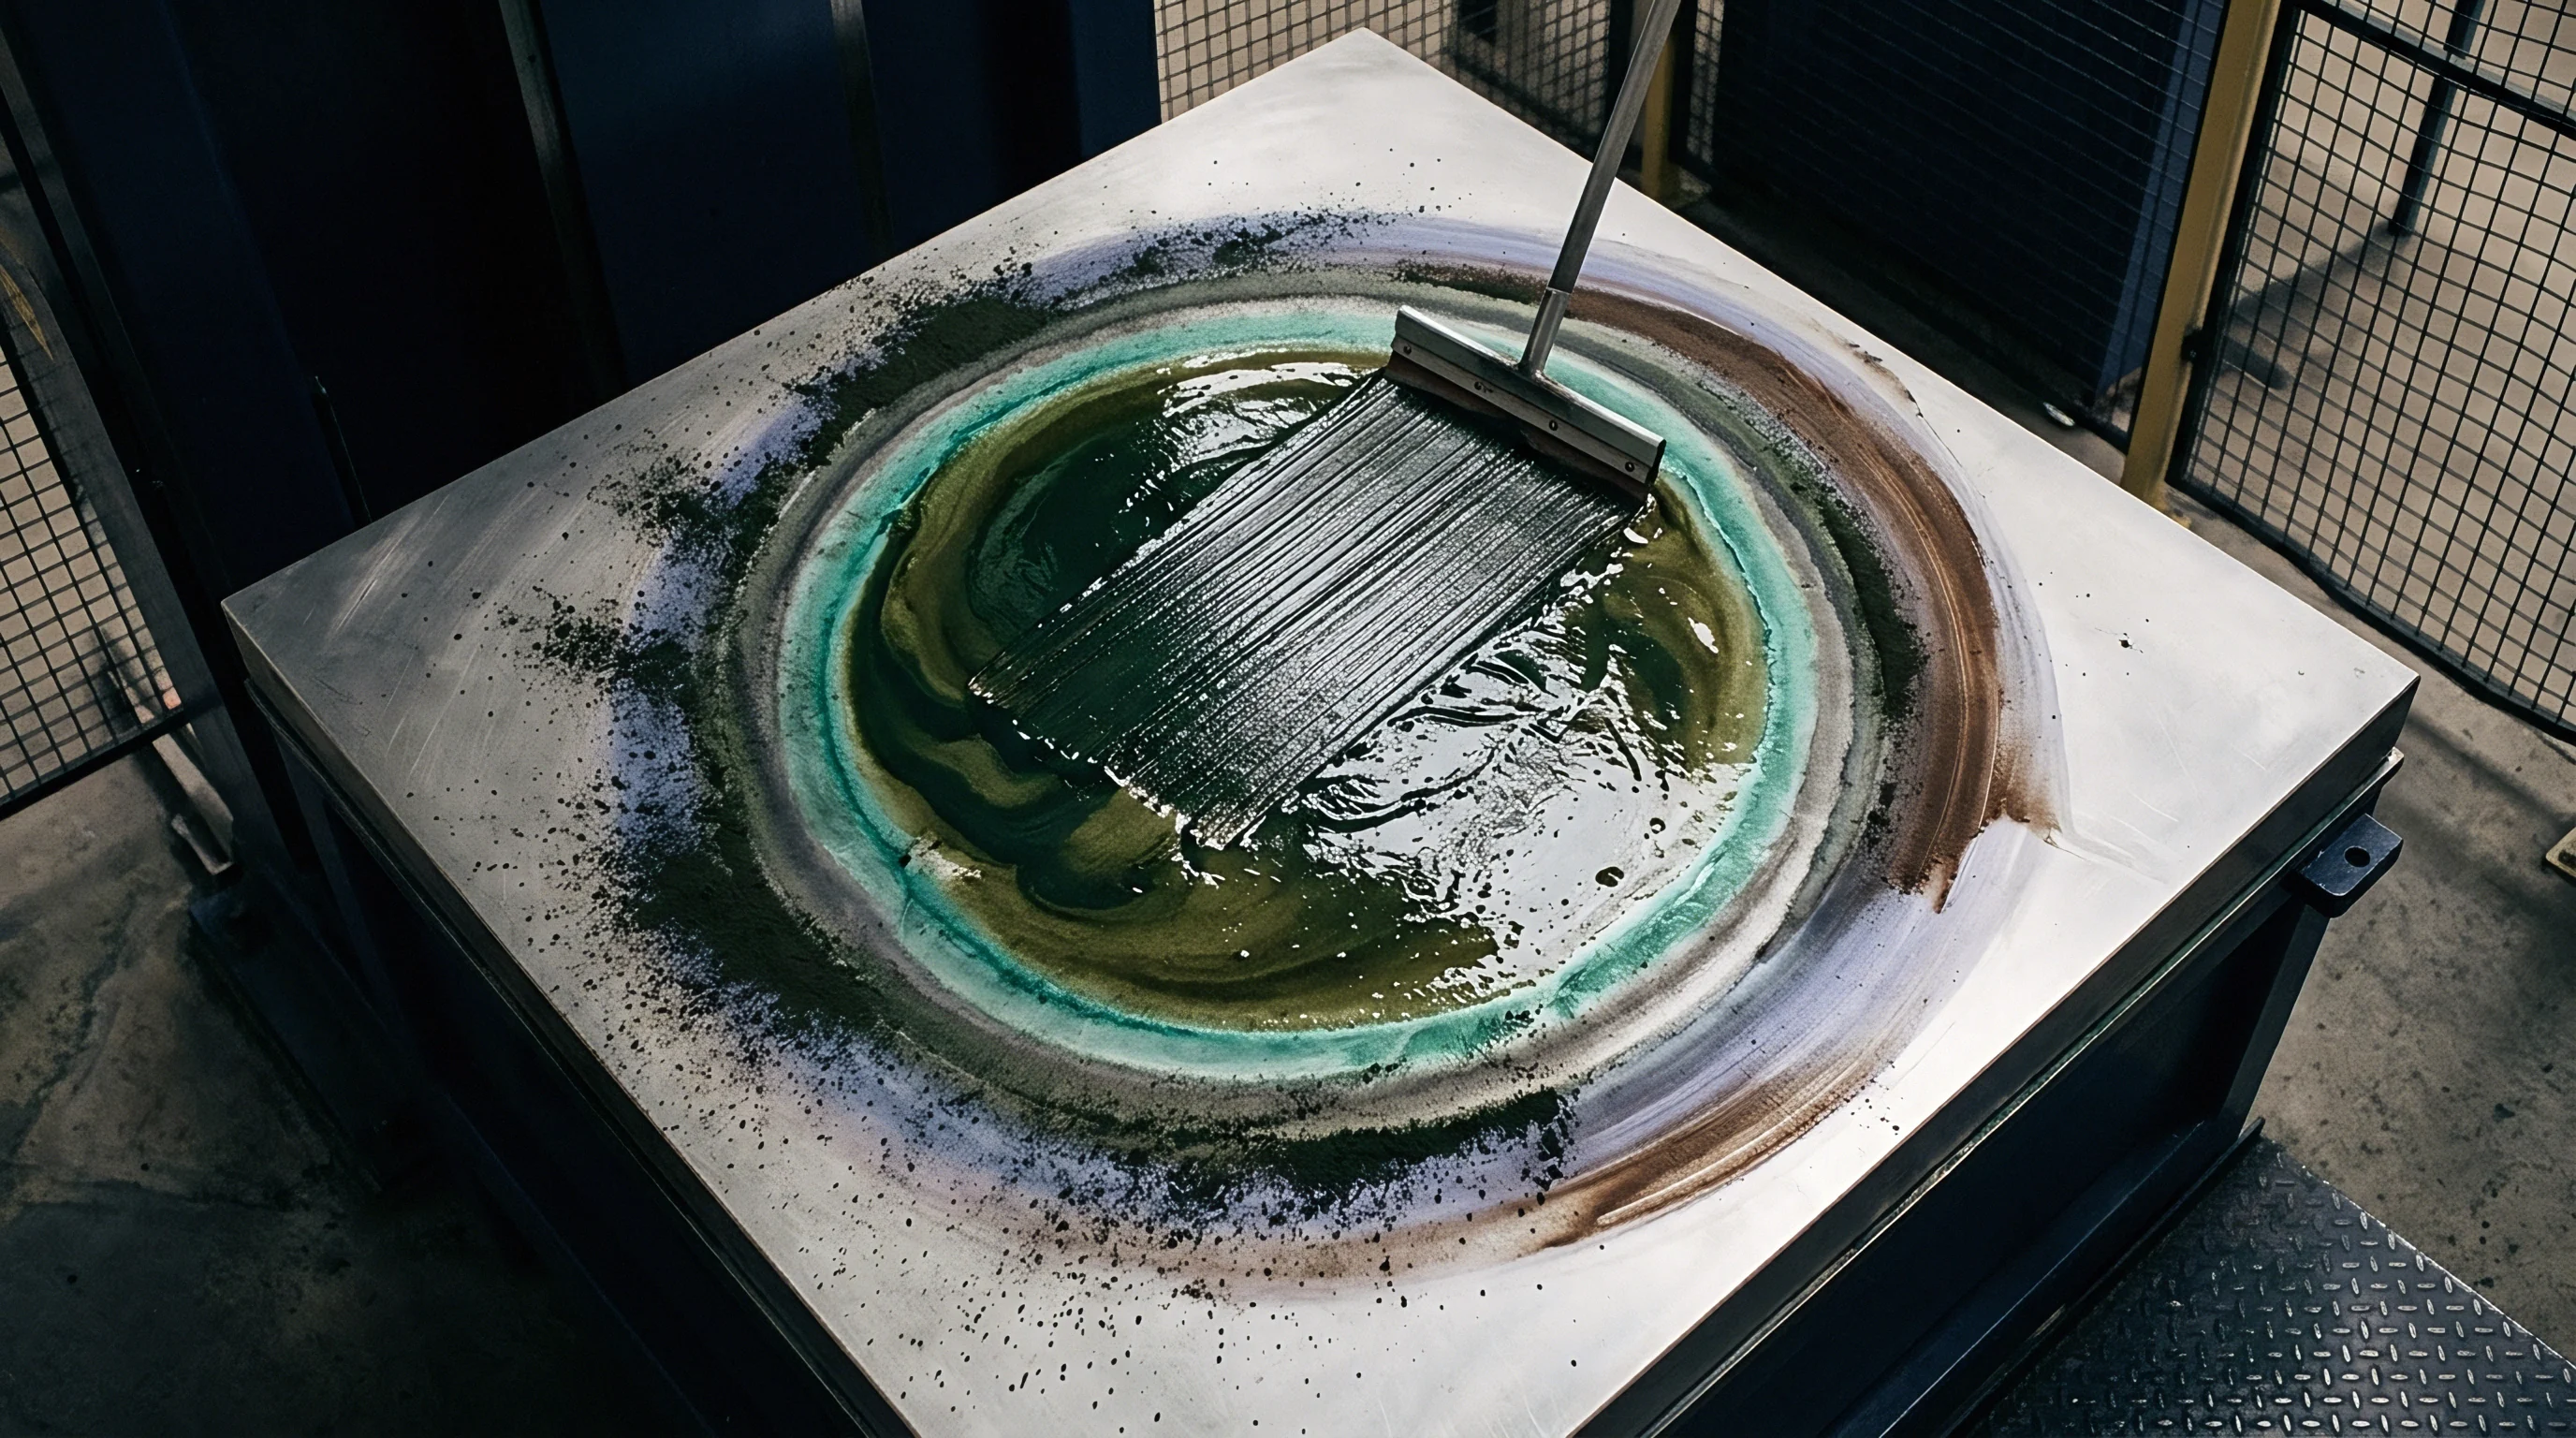
Intermediate thermal processing introduces secondary shade variations along the length of continuous fabric runs. Following the padding stage, wet fabric passes through intermediate pre-dryers to reduce moisture content before chemical fixation or thermofixation. Infrared (IR) pre-dryers and hot flues evaporate water from the wet substrate.
Pad pressure shifts wet pickup. If evaporation occurs too rapidly or unevenly, water carrying dissolved dye moves by capillary action toward heat zones on the fabric surface. Uncontrolled particulate transport alters the distribution of dye across the cross-section and along the length of the fabric.
Liquid movement during drying can induce severe color tailing even when pad bath concentration remains perfectly balanced.
Infrared Pre-Drying and Capillary Moisture Flux
Evaporative drying creates liquid transport channels within the yarn bundle. Water flows from interior fiber regions toward external surface boundaries where evaporation takes place. Unbound dye washes out.
Dissolved or dispersed dye particles travel alongside the migrating solvent stream. When airflow velocities or thermal radiation exposure vary across the length of the continuous drying range, migration dynamics change dynamically over time. Fluctuations in steam pressure, burner output, or line speed alter the drying rate along the run.
Pilling masks shade delta. Consequently, dye concentration on the fiber surface shifts continuously, simulating classic chemical pad tailing on the finished fabric surface.
Anti Migration Agent Performance and Particulate Parting
Chemical anti-migration agents added directly to the dye pad bath mitigate liquid transport during intermediate drying. Polyacrylamides, sodium alginates, and purified natural gums increase bath viscosity at low shear rates. As water evaporates in the IR pre-dryer, the local concentration of the anti-migration polymer increases rapidly, triggering a gelation network that locks dye particles in place.
Evaluating anti-migration efficiency follows standardized testing procedures like AATCC Test Method 140 or ISO 105-Z06.
Managing pad-dry-steam parameters requires establishing physical boundary conditions across key machinery zones.
- Infrared Power Balance requires maintaining symmetric radiation output across front and back lamps to prevent face-to-back shading while keeping total drying load below 35 percent moisture reduction.
- Hot Flue Air Velocity demands balancing nozzle blowers between upper and lower ducting channels to eliminate air-streak migration during the constant-rate drying phase.
- Substrate Wet Pickup Control necessitates keeping liquor retention at the lowest stable percentage for the specific fiber blend to minimize free water volume susceptible to capillary movement.
- Viscosity Monitoring requires measuring pad liquor viscosity at operating temperature every two hours using a rotational viscometer to ensure anti-migrant polymer integrity.
What residual moisture percentage must the fabric hold upon exiting the infrared zone to eliminate particulate migration without causing migration marks in the subsequent hot flue?

Dossier
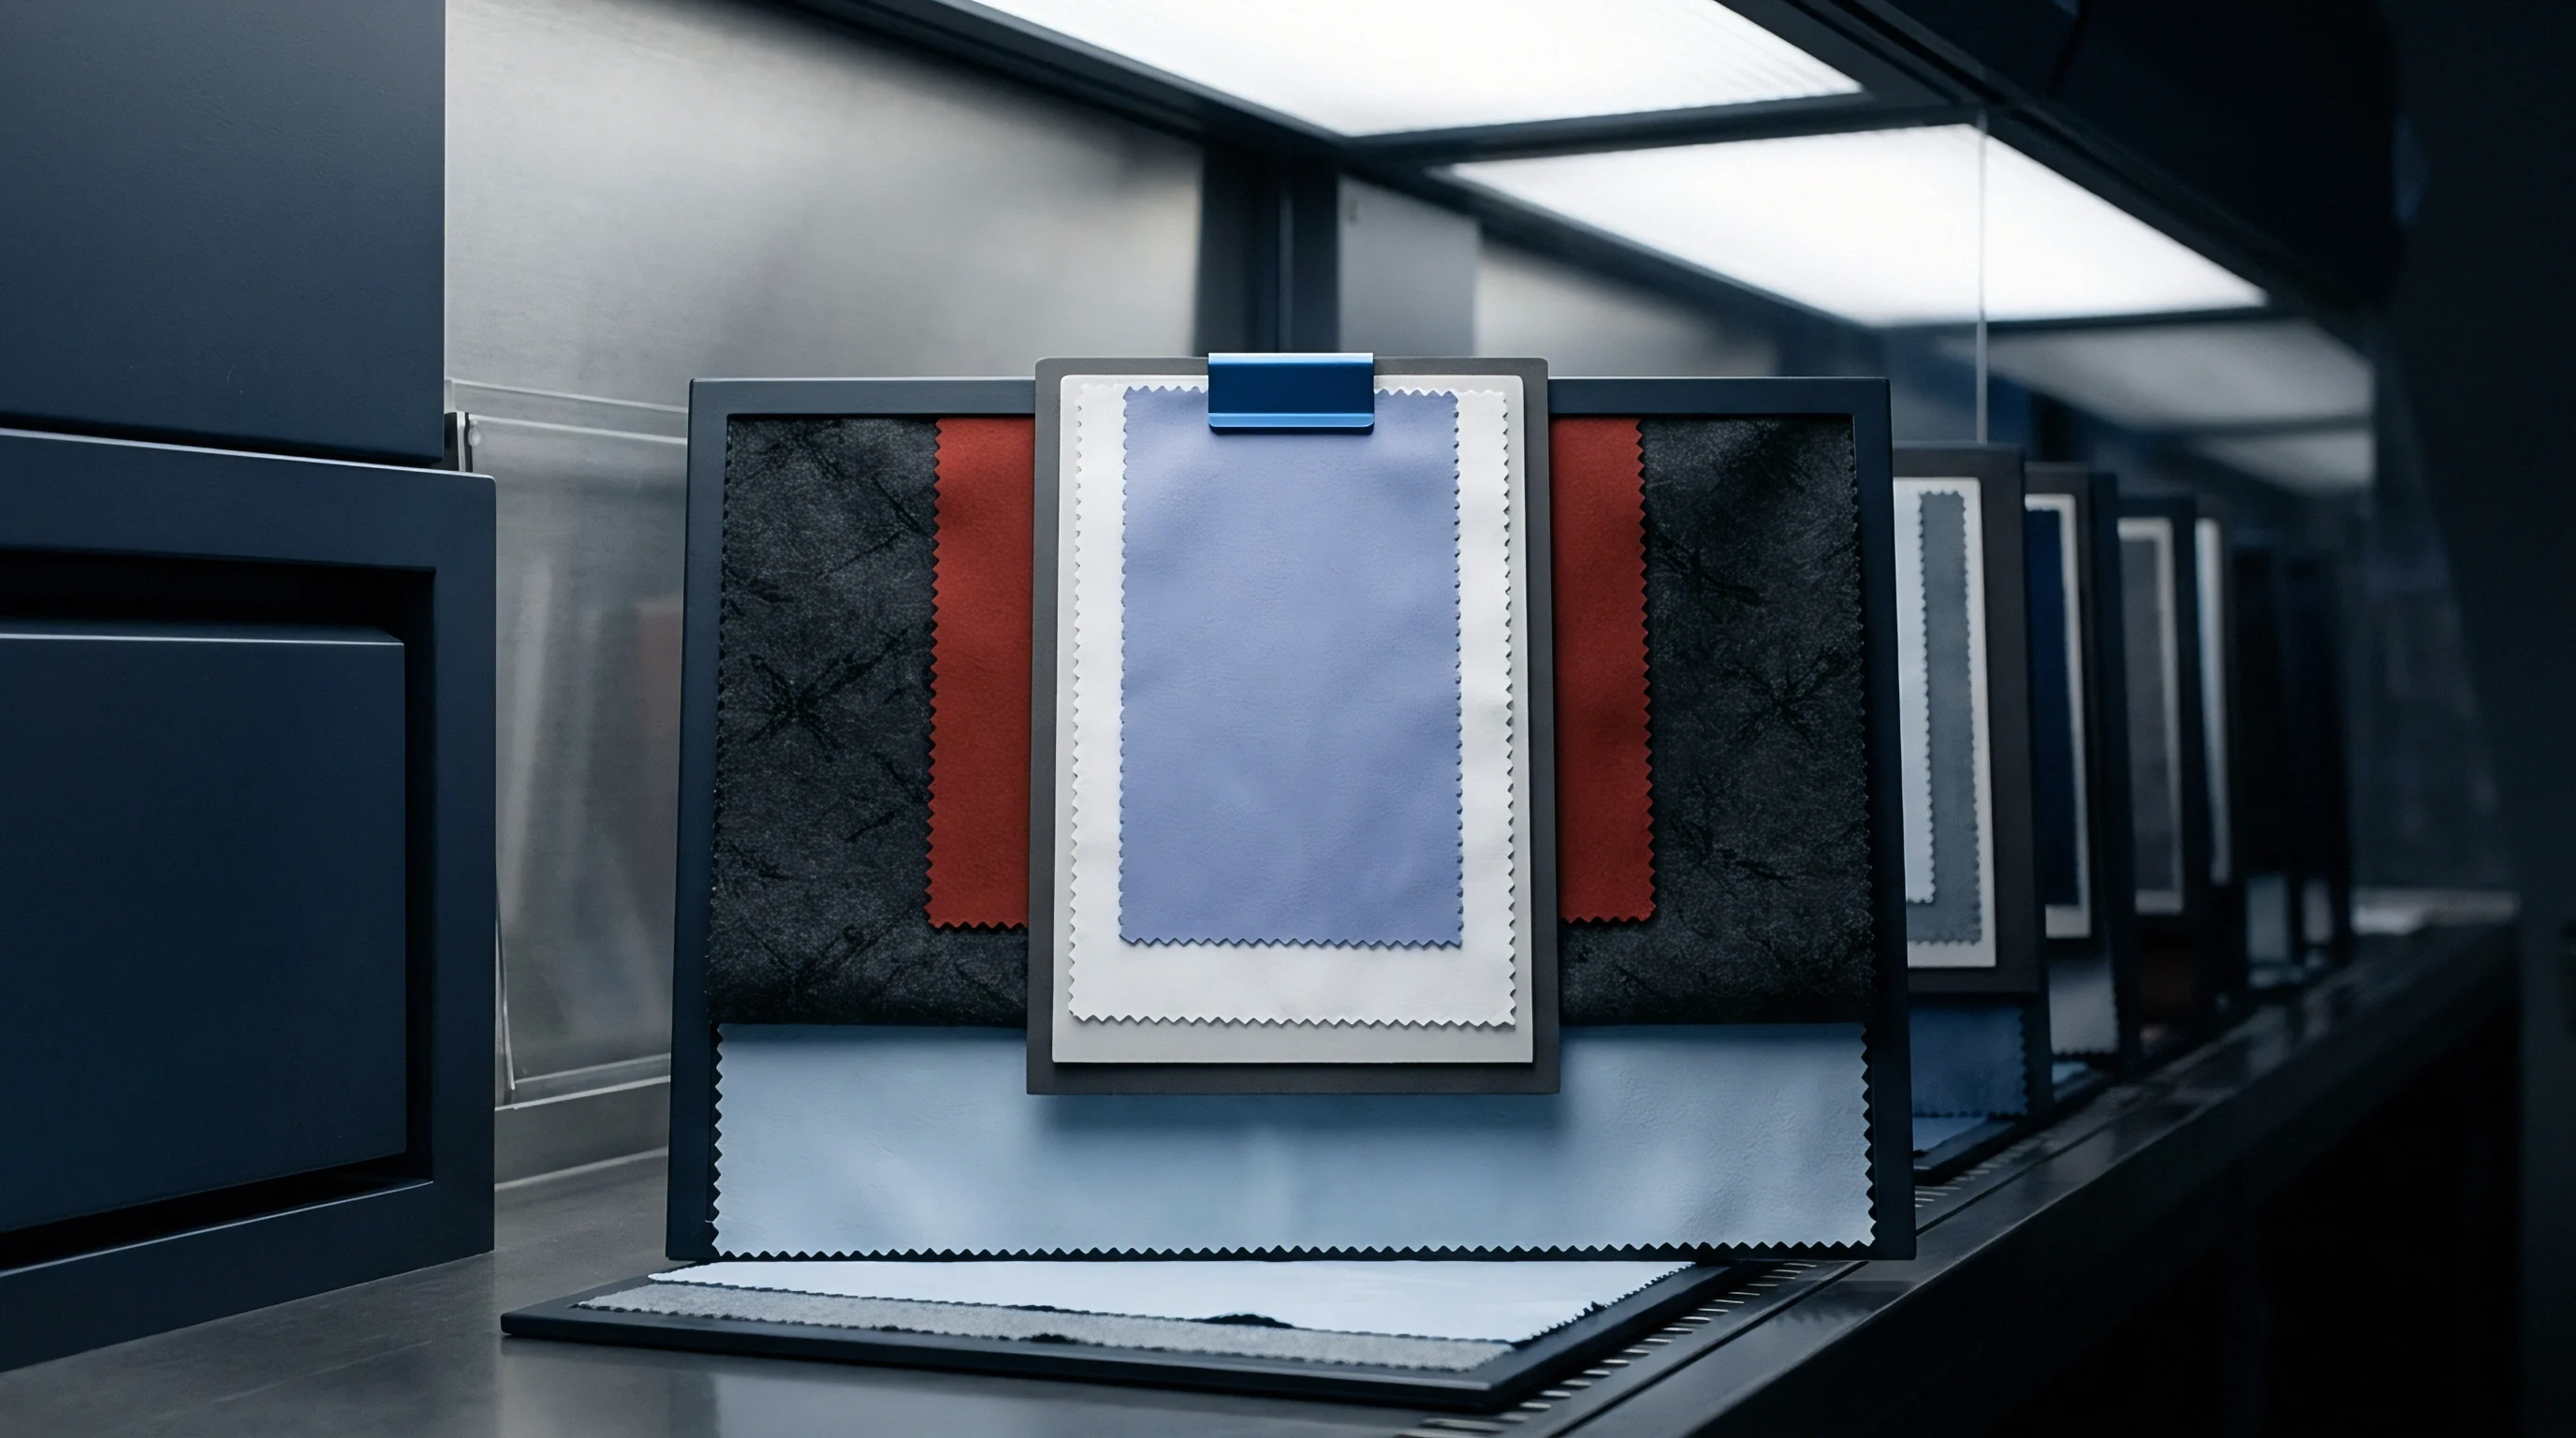
Documenting batch conformity for continuous dye runs requires verified head, center, and tail swatch spectro-data tied directly to specific roll identification numbers. A comprehensive compliance file links chemical input certifications, continuous process log charts, and spectrophotometric lab reports. Sourcing practices auditing continuous dyeings verify that test swatches originate from actual physical production roll ends rather than pre-production laboratory dips.
Scope certificates for GOTS or OEKO-TEX STANDARD 100 prove raw material chemical compliance but fail to guarantee physical shade uniformity down the production line. Verification relies on raw batch data files generated at the mill inspection table.
Sampling Protocols across Lot Transitions
Systematic sampling protocols demand harvesting physical swatches at designated linear checkpoints during batching. For continuous runs exceeding 5,000 meters, technicians must extract swatches from the first roll (head), the middle roll, and the final roll (tail). Each swatch undergoes conditioning at 20 degrees Celsius and 65 percent relative humidity per ISO 139 before spectrophotometric reading.
Generating a verified inspection dossier requires compiling individual coordinate delta charts illustrating color trajectories across the entire lot.
Single-point end swatches fail to capture non-linear color drift occurring inside continuous dye runs.
- Cut full-width swatches measuring 30 centimeters in length from the head, middle, and tail rolls of each continuous dye batch.
- Condition all swatches in an accredited testing environment for a minimum of four hours prior to measurement.
- Calibrate the laboratory spectrophotometer using certified white tile and black trap standards under current calibration certificates.
- Record four spectral reflectance measurements per swatch across the left edge, center, and right edge to capture both tailing and side-to-center variation.
- Calculate Δ E00 color difference metrics comparing middle and tail readings against the approved head master swatch.
- File raw numerical reflectance data and generated PASS/FAIL reports into the shipment quality dossier alongside transaction certificates.

Integrating ISO 105 Standards into Batch Acceptance
Laboratory reports verifying color fastness and color measurement must reference accredited testing methods. ISO 105-J01 outlines general principles for color measurement, while ISO 105-J03 defines numerical color difference calculation formulas. Batch acceptance criteria must specify the exact equation, illuminant, observer angle, and numerical tolerance limit.
Submitting an unverified shade report lacking clear method parameters exposes the buyer to rejected shipments upon import, as border customs authorities and brand audit teams enforce strict conformity checks against purchase order technical files.
Failing to mandate head-to-tail spectro-dossiers in purchase contracts transfers full financial liability for cut-panel shade defects onto the garment importer.

Settlement
Commercial disputes stemming from progressive end-to-end color variation resolve through precise contractual tolerance limits and quantified strip-and-redye liabilities. When continuous fabric lots exhibit head-to-tail color differences exceeding contract specifications, buyers face immediate supply chain disruptions. Garment factories cannot execute marker laydowns when shade drifts across roll lengths, leading to unusable cut panels, delayed assembly, and missed delivery windows.
Defining clear technical thresholds within the original purchase order establishes enforceable grounds for financial recourse, lot rejections, or mill-funded remediation.
Calculating Financial Exposure on out of Tolerance Lots
Financial exposure on defective continuous dye runs extends beyond the raw fabric invoice value. Once fabric enters the cutting room, value-added manufacturing steps escalate non-conformity claims significantly. If a 10,000-meter lot valued at 4.50 per meter exhibits severe tailing ($Δ E00 > 1.5), rejecting un-cut cloth yields a direct fabric loss claim of $45,000.
However, if the garment factory lays and cuts the fabric before shade tailing is identified during panel sorting, total exposure includes cutting labor, marker paper, factory overhead, and lost freight windows, pushing total claim liabilities past $120,000.
| Remediation Route | Process Mechanics | Direct Cost per Meter | Tensile Strength Loss | Commercial Feasibility |
|---|---|---|---|---|
| Chemical Strip and Redye | Reductive/oxidative stripping followed by full continuous re-dyeing | $1.80 – $2.40 | 12% – 18% loss | High risk of fabric degradation; shade match difficult |
| Over-Dyeing to Darker Shade | Direct padding of secondary dark shade (e.g. olive to black) | $0.75 – $1.10 | 2% – 5% loss | Economically viable if customer accepts alternative shade |
| Garment Panel Sorting | Manual 555 sorting of cut panels to match shades within garments | $0.40 – $0.85 | 0% loss | Labor intensive; increases garment production time |
| Total Batch Scrap | Complete lot rejection and disposal of out-of-spec fabric | $4.50 (Full loss) | N/A | Maximum financial claim against mill invoice |
Technical Remediation versus Scrap Recourse
Remediating color tailing through chemical stripping introduces substantial technical risks. Reductive stripping using sodium hydrosulfite or thiourea dioxide breaks dye chromophores but weakens cellulosic fibers, risking failure on subsequent tear strength and burst strength tests under ISO 13937 protocols. Over-dyeing tailed fabric into darker shades like navy or black presents a lower-risk technical alternative, provided the commercial contract allows shade substitution.
Where technical remediation proves unviable, purchase order indemnity terms dictate full lot rejection, requiring the mill to replace the full yardage at zero cost while absorbing freight and border duty fees.
Enforcing strict quality assurance protocols at the mill level prevents out-of-spec fabric from reaching border ports. Importers holding complete batch spectro-dossiers resolve color tailing disputes rapidly by presenting clear laboratory evidence of non-conformity before payment release terms mature.