CIEDE2000 Parametric Weighting Calibration for Textured Woven Goods Sourcing
Calibrate CIEDE2000 parametric weighting to 2:1:1 with d:8 SPIN rotational averaging to isolate true dye shifts from textured surface shadowing on woven goods.


Scale
Color difference evaluation on structured goods fails when mathematical models assume an optically flat surface. Standard industrial inspection relying on the CIEDE2000 total color difference formula applies default parametric weighting factors of 1:1:1 for the lightness, chroma, and hue scalar coefficients, denoted as kL, kC, and kH. When applied to textured spun dobby textiles, corduroys, or slub-yarn oxford constructions, this unity setting triggers false production rejections.
The micro-topography of raised yarns and recessed interlacings creates localized light absorption pits. Shadowing depresses measured L-star values. An automated spectrophotometer reading registers these structural cavities as genuine pigment deficiency, driving Delta E values well past typical tolerance boundaries of 0.8 to 1.0 even when the chemical dye concentration matches the master formulation.
The textile coloration sector adopted a 2:1:1 weighting factor under older CMC formulas to align instrumental data with human eye perception. ISO 105-J03 outlines CIEDE2000 calculation methods for textiles, recommending a kL factor of 2.0 while keeping kC and kH at 1.0 for standard apparel substrates. High-relief structured piece goods demand an empirical calibration beyond these baseline allowances.
Raising the lightness parameter dampens the mathematical contribution of structural yarn shadows without blinding the instrument to authentic dyestuff shifts.
Standard planar colorimetry equations consistently overstate perceived shade differences on three-dimensional textile surfaces.
Calibrating these parameters demands balance. Over-relaxing kL beyond 2.2 introduces unacceptable panel-to-panel shade divergence during garment assembly. Cut panels from different dyeing lots blend seamlessly under diffused inspection lights yet exhibit noticeable shading under directional retail illumination.
A buyer calibrating incoming goods inspection sets clear limits for each scalar factor based on geometric yarn count, float length, and pick density.
| Surface Classification | Representative Construction | kL Factor | kC Factor | kH Factor | Target Delta E Threshold |
|---|---|---|---|---|---|
| Flat Filament Plain | 50D x 50D Polyester Taffeta | 1.0 | 1.0 | 1.0 | 0.60 |
| Combed Cotton Twill | 40s/1 x 40s/1 3/1 Chino | 1.5 | 1.0 | 1.0 | 0.75 |
| Heavy Slub Dobby | 10s/1 x 8s/1 Cotton Dobby | 2.0 | 1.0 | 1.0 | 0.90 |
| Waffle Thermal | 20s/2 x 20s/2 Honeycomb | 2.2 | 1.1 | 1.0 | 1.10 |
| Cut Pile Corduroy | 12-Whale Cotton Velveteen | 2.4 | 1.0 | 1.0 | 1.25 |
Yarn crimp amplitude dictates how incident light scatters across the surface. When testing twill or dobby textiles with prominent diagonal ribs, the lightness variance dominates total difference calculations. Adjusting kL redistributes the sensitivity ellipse along the L-star axis, allowing commercial lots to clear verification without masking genuine off-shade bath conditions.
Higher yarn elevations always demand broader lightness allowances.


Grain
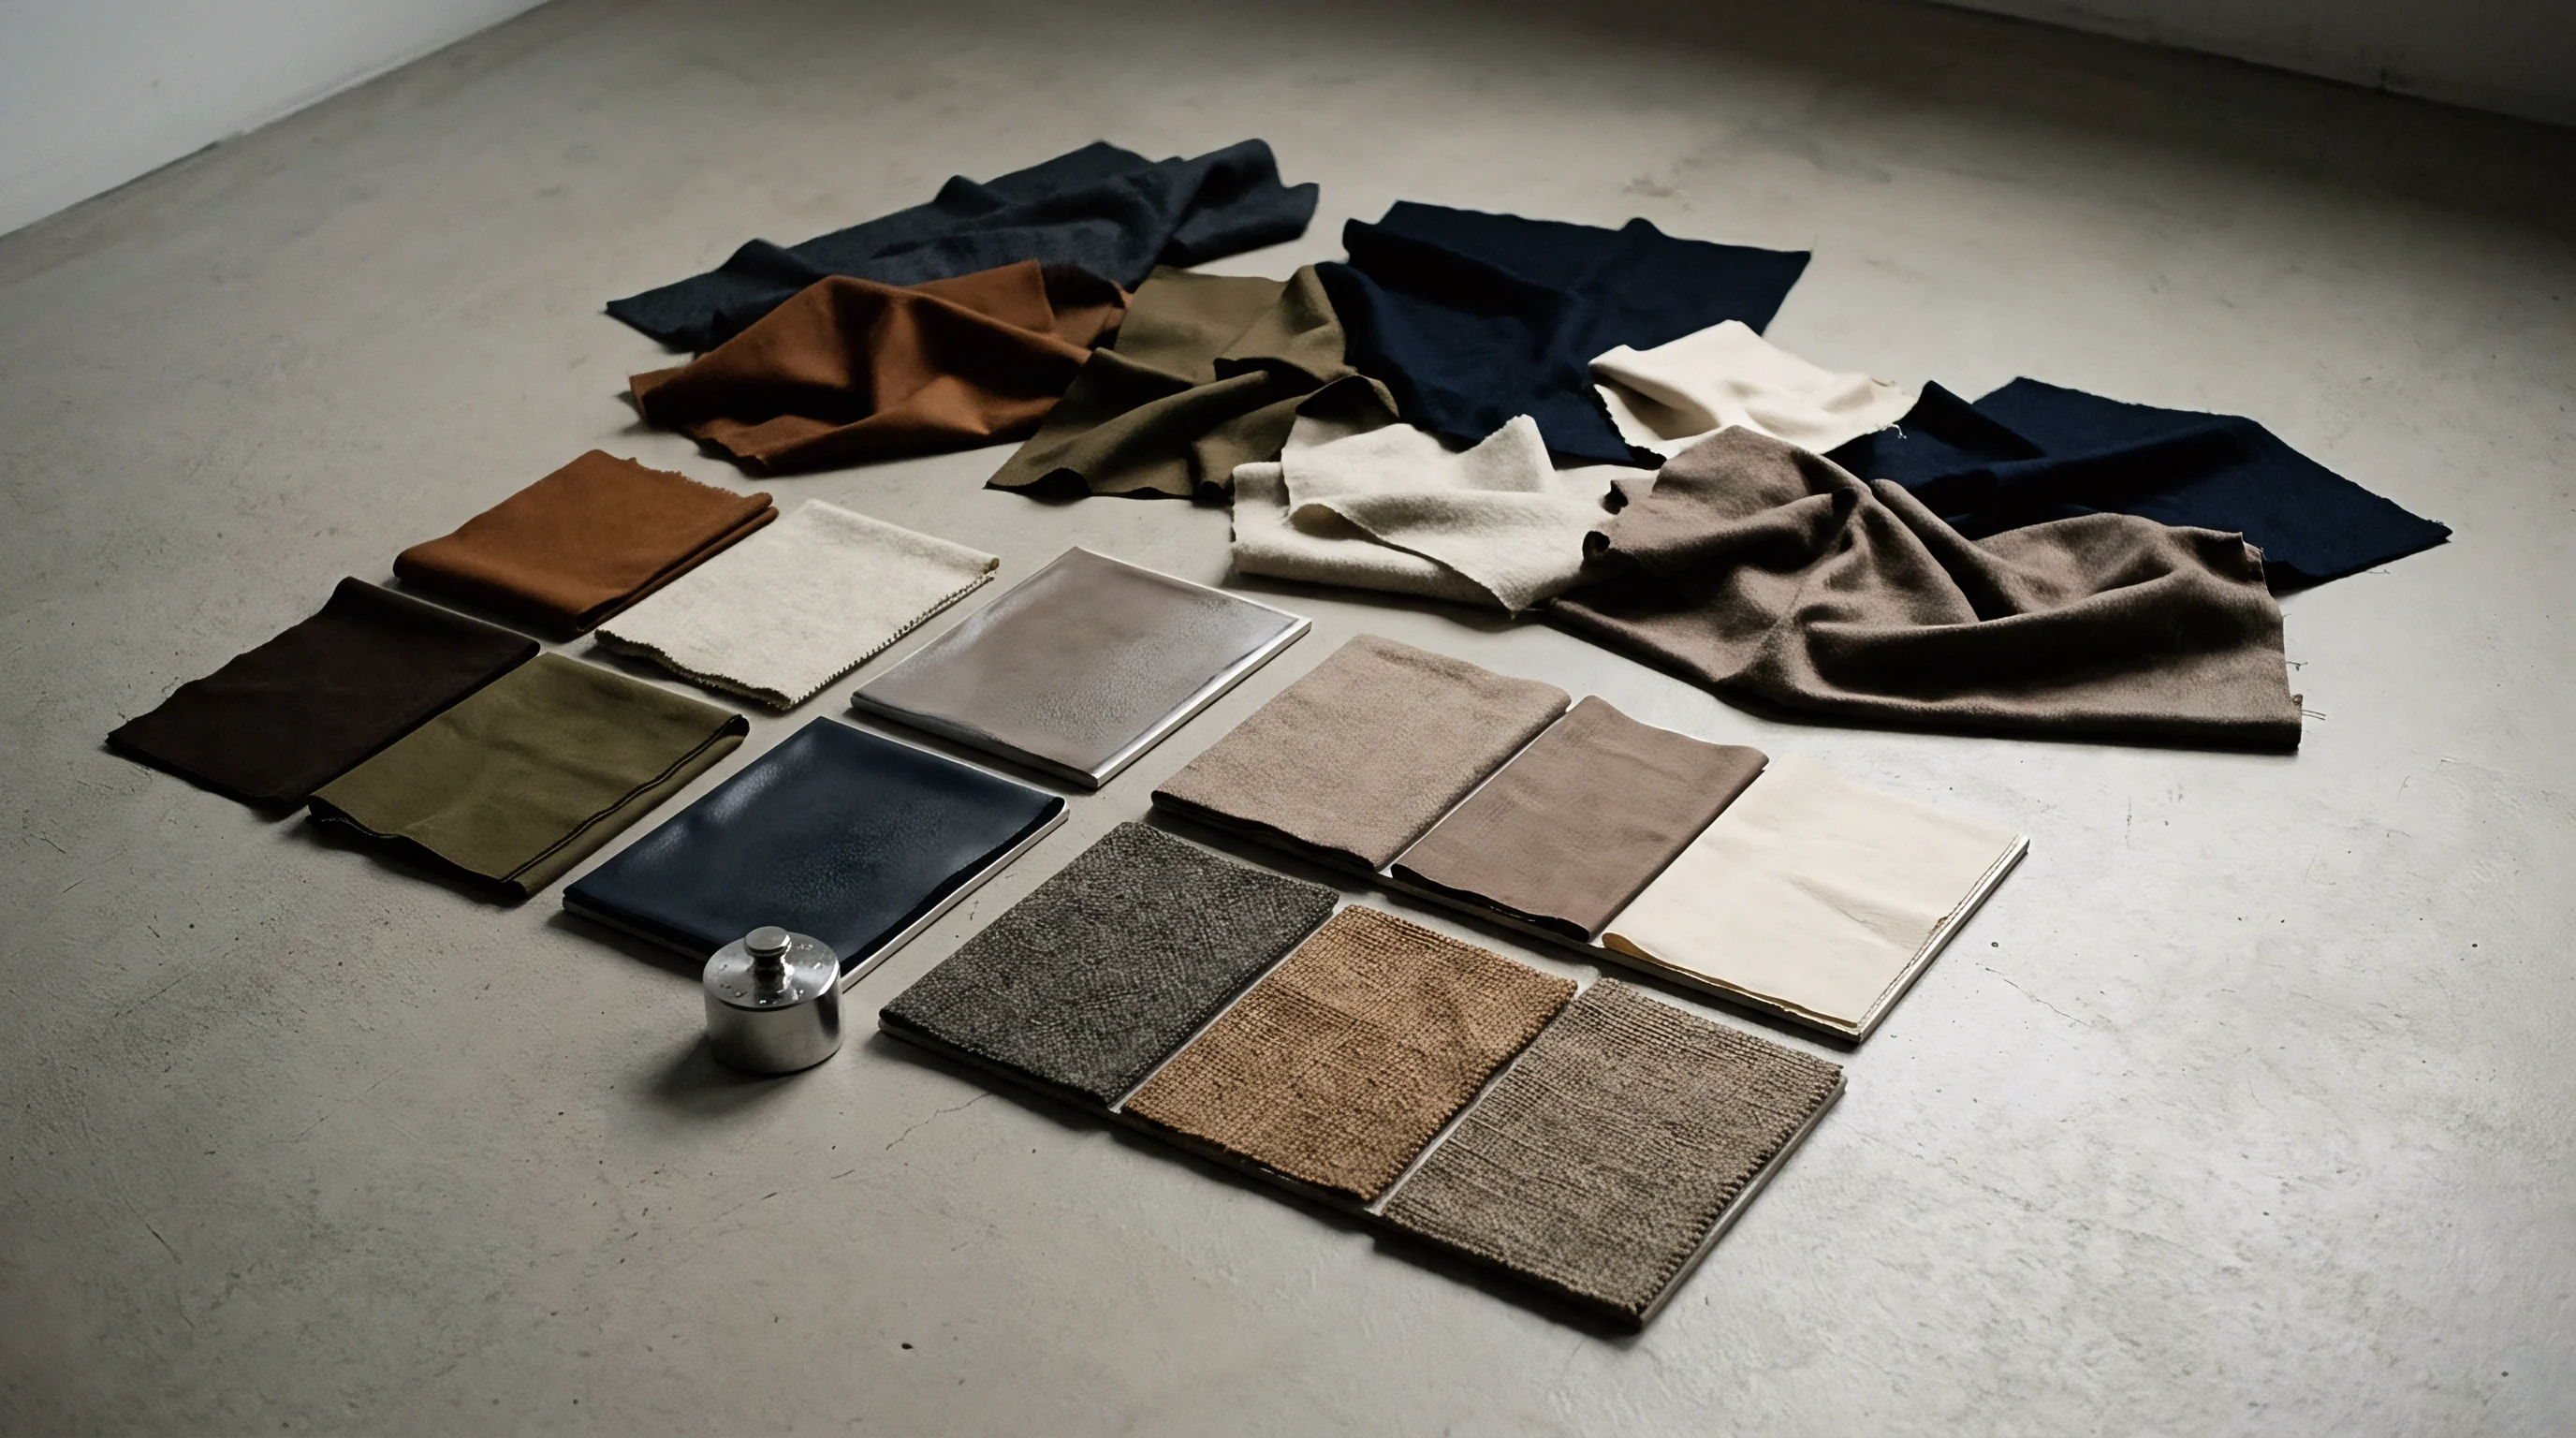
Surface anisotropy dictates how light reflects off finished goods. The spatial arrangement of warp ends over filling picks produces directional reflectance peaks that vary when a swatch rotates inside the spectrophotometer port. When an operator places a sample on the measuring port without controlling orientation, the instrument captures shifting ratios of specular highlight and self-shadowing.
The resulting color coordinates show artificial drift between consecutive reads of the exact same spot.
Why Do Directional Surface Floats Skew Spectrophotometers?
Long yarn floats generate directional sheen alongside deep parallel shadow valleys. In a 4/1 satin or an uneven broken twill, light striking parallel to the float axis enters the fiber bundle and scatters internally, generating high chromatic intensity. Rotating the sample 90 degrees causes the incident light beam to hit the yarn transverse to its longitudinal axis, reflecting off outer fiber ridges and generating surface glare that desaturates the color signal.
Orientation shifts colorimetric coordinates rapidly. Without a standardized rotational method, a single bolt yields conflicting verification passes.
- Rotational Averaging Protocol establishes four consecutive 90-degree measurements per test location to cancel out directional float reflections across anisotropic surfaces.
- Aperture Diameter Selection defines whether the sensor samples sufficient surface peaks to normalize local yarn irregularities during data acquisition.
- Specimen Compression Tension controls sample deformation against the measurement glass, maintaining uniform pile and float height across tested lots.
- Multi-Point Field Sampling distributes measurements across left, center, and right positions of the bolt width to catch stenter drying imbalances.
Uncalibrated measurements often provoke contentious communications between production facilities and buying offices. The finishing house typically claims that the shipment matches the approved lab standard under visual evaluation inside the light box, blaming instrument aperture positioning for unrepresentative readings.


Sensor
Optical geometry dictates how an instrument processes light returning from three-dimensional surfaces. A benchtop spectrophotometer operating on diffuse eight-degree geometry utilizes an integrating sphere coated with barium sulfate to illuminate the specimen uniformly from all angles. Conversely, a 45/0 instrument projects directional light beams at forty-five degrees to the sample normal, reading reflections at zero degrees.
Surface relief traps incident rays. On heavily textured goods, a 45/0 geometry magnifies physical yarn shadowing, exaggerating perceived color differences far beyond what a human observer registers.

Is Specular Component Inclusion Mandatory for Crepe?
Specular component included modes neutralize physical gloss differences by collecting both diffuse reflection and mirror-like surface highlights inside the sphere. Specular component excluded modes discard the gloss signal, measuring purely scattered color light. For textured crepes, high-twist crepe yarns shrink irregularly during wet finishing, producing pebble effects with varied micro-facets.
Spectrophotometers integrate total reflected flux.
Specular component inclusion is required under ASTM D2244 when evaluating textured surfaces to prevent micro-gloss variations from corrupting chromaticity coordinates.
Switching from specular excluded to specular included modes drops measured lightness discrepancy by 30 to 45 percent on high-twist crepe goods. This drop does not represent an improvement in dyeing quality; it eliminates optical interference generated by surface sheen. Aperture area dictates sampling confidence.
Measuring textured goods through a Small Area View aperture of 6 millimeters isolates individual yarn crowns and inter-yarn voids, generating wide measurement spreads. Employing a Large Area View aperture of 25 millimeters or greater averages multiple pattern repeats into a unified reflection profile.
| Optical Configuration | Aperture Size | L-Star Value | a-Star Value | b-Star Value | Measured Delta E00 |
|---|---|---|---|---|---|
| d/8 SPIN (Averaged 4x) | LAV 25 mm | 42.15 | 12.40 | -8.60 | 0.38 (Pass) |
| d/8 SPEX (Averaged 4x) | LAV 25 mm | 40.80 | 12.85 | -8.15 | 0.89 (Marginal) |
| d/8 SPIN (Single Read) | SAV 6 mm | 43.50 | 11.90 | -9.20 | 1.24 (Fail) |
| 45/0 Geometry | Standard 12 mm | 39.20 | 13.10 | -7.80 | 1.62 (Fail) |
Mismatched sensor parameters between purchasing offices and processing mills generate expensive shipping rejections, unnecessary laboratory disputes, and costly delays while containers sit held at import terminals awaiting secondary inspection clearance.

Batch
Dye lot consistency on textured yardage requires balancing dyestuff uptake and mechanical finishing controls. In jet dyeing vessels, textured substrates absorb liquor unevenly if relaxation temperature gradients climb faster than 1.5 degrees Celsius per minute. Uneven shrinkage distorts the surface weave profile, producing optical differences across the roll even when chemical dye molecules distribute evenly throughout the fiber core.
Inspectors log physical panel differences. If the inspection department applies default CIEDE2000 settings to evaluate these goods, mathematical reject flags appear continuously.
Consider a practical bulk scenario. A sourcing organization orders 30,000 meters of a 280 gsm cotton-poly broken twill across five individual dye lots. The target master color is a deep military olive.
Three lots emerge from the finishing line with identical chemical formulations and liquor ratios, but distinct tension variations on the stenter frame alter the final pick count by plus or minus 4 picks per centimeter. These pick density variations alter the angle of the twill ridge, shifting the surface shadow volume.
A density shift of three picks per centimeter alters measured L-star values by 0.6 units on heavy twill substrates.
When evaluated using standard 1:1:1 weighting factors, two of the five lots fail incoming quality inspection with Delta E values of 1.15 and 1.28 against an agreed threshold of 1.00. Recalibrating the weighting factors to a 2:1:1 setup adjusts the calculation to discount the shadow-induced lightness shift. The recalibrated values drop to 0.72 and 0.81, placing both lots safely within commercial tolerance while maintaining strict control over red-green and yellow-blue chromatic drift.
| Lot Identifier | Delta L-Star | Delta a-Star | Delta b-Star | Default Delta E00 (1:1:1) | Calibrated Delta E00 (2:1:1) | Visual Panel Status |
|---|---|---|---|---|---|---|
| Lot A (Standard Run) | +0.32 | -0.12 | +0.18 | 0.38 | 0.29 | Approved |
| Lot B (Stenter Tight) | -0.95 | +0.22 | -0.15 | 1.15 | 0.72 | Approved |
| Lot C (Stenter Loose) | +1.12 | -0.18 | +0.25 | 1.28 | 0.81 | Approved |
| Lot D (Dye Imbalance) | +0.25 | +0.85 | -0.78 | 1.45 | 1.38 | Rejected |
| Lot E (Nominal Run) | -0.20 | +0.15 | +0.10 | 0.28 | 0.24 | Approved |
| Test parameters: D65 illuminant, 10-degree observer, d/8 spherical geometry, LAV 25 mm aperture with SPIN and 4x rotational averaging. | ||||||
The calculation demonstrates that Lot D fails under both formula configurations. Dyestuff concentration remains perfectly stable. The divergence in Lot D stems from chromatic imbalances along the a-star and b-star vectors, signaling genuine chemical batching errors in the dyehouse rather than mechanical surface phenomena.
Calibrating the lightness parameter filters out structural noise while catching genuine formulation errors.
Commercial contracts prevent delivery disputes by integrating explicit technical controls:
- Instrumental Geometry Specification sets diffuse d/8 spherical optics with specular component inclusion and large area view aperture as the sole legal basis for lot pass criteria.
- Sample Preparation Procedure defines mechanical conditioning at standard textile atmosphere for twenty-four hours alongside mandatory four-fold sample backing thickness.
- Rotational Averaging Execution establishes that every colorimetric data point comprises the mean of four orthogonal readings rotated at ninety-degree intervals.
- Parametric Factor Designation fixes the mathematical formula explicitly to CIEDE2000 with kL, kC, and kH weights agreed at 2.0, 1.0, and 1.0 respectively.
Section 8.2 of the master supply agreement establishes that instrumental color measurements conducted without four-fold backing and rotational averaging hold zero legal standing during commercial arbitration.
Settlement
Commercial friction over shaded rolls resolves through shared instrumental boundaries. When an offshore converter delivers dyed yardage, downstream apparel cutting rooms encounter real yield losses if adjacent panels mismatch. The financial consequence of uncontrolled shading appears on the sewing floor.
Re-cutting shaded front panels from substitute rolls inflates consumption markers, eroding the garment manufacturing margin. Converters challenge single-position readings. Uncalibrated equations multiply production losses.
A rigorous quality agreement specifies every element of the color verification workflow before signing bulk commitments. The sourcing team establishes clear protocol boundaries covering spectrophotometer make, model, sphere diameter, lamp type, calibration tile frequency, and software version. Four measurements prevent false rejects.
Subtle differences in calculation algorithms between older legacy software and modern packages can alter CIEDE2000 outputs by several hundredths of a unit, turning a pass into an expensive production stall.
Landed costs increase by three to seven percent across textured programs when shade dispute protocols lack pre-agreed mathematical weighting definitions.
Tolerances should reflect downstream reality. When goods feature deep surface structures like jacquard weaves or honeycomb textures, establishing a single universal Delta E boundary fails. The technical package defines separate boundaries for within-roll side-to-side shading, roll-to-roll consistency, and bulk-to-standard alignment.
Commercial tolerances enforce tight boundaries.
Whether regional industrial laboratories will harmonize on dynamic parametric calibrations that calculate weighting factors automatically from scanned yarn elevation profiles remains an open question for sourcing teams worldwide.