Variables Acceptance Sampling Plans for Greige Woven Fabric Sett Verification
Variables acceptance sampling under ISO 3951-1 cuts greige sett verification roll swatches by sixty percent while mathematically securing downstream yields.


Tension
Loom take-up gears and electronic let-off mechanisms dictate the physical spacing of warp and filling elements during greige production. While technical specifications fix nominal yarn counts and linear sett targets, mechanical drift across thousands of running metres alters structural density. Warp let-off sensors adjust beam rotation as yarn packages deplete, yet variations in yarn lubrication, ambient mill humidity, and winding tension yield measurable shifts in pick density.
Let-off motions regulate warp delivery. A lot arriving at a receiving depot contains hidden deviations that compound throughout wet processing, altering dimensional stability, finished weight, and dyeing kinetics.
Greige inspection at incoming receiving serves as the gatekeeper for subsequent wet operations. Traditional receiving routines rely on manual counting glasses placed arbitrarily across outer roll wraps, an approach that exposes conversion operations to severe commercial risk. When a mill under-picks a construction by three or four picks per centimetre across fifty thousand metres, yarn mass consumption drops while loom output accelerates.
The buyer pays for missing fibre mass, and the finisher inherits a structural imbalance that cannot be corrected by chemical or mechanical means.
A drop of two picks per centimetre lowers greige areal weight by four percent in standard plain printcloth.
Variations along the length of a single roll present an equal operational hazard. Loom start marks, beam change transitions, and humidity swings between shift handovers create cyclic density waves throughout a production run. Take-up gears dictate filling density. Relying on single-swatch attribute verification blinds the sourcing team to the underlying distribution of the production lot.
Continuous variables inspection captures the dispersion of structural density across rolls, providing early notice of lot failure before greige lots are desized, scoured, or dyed.
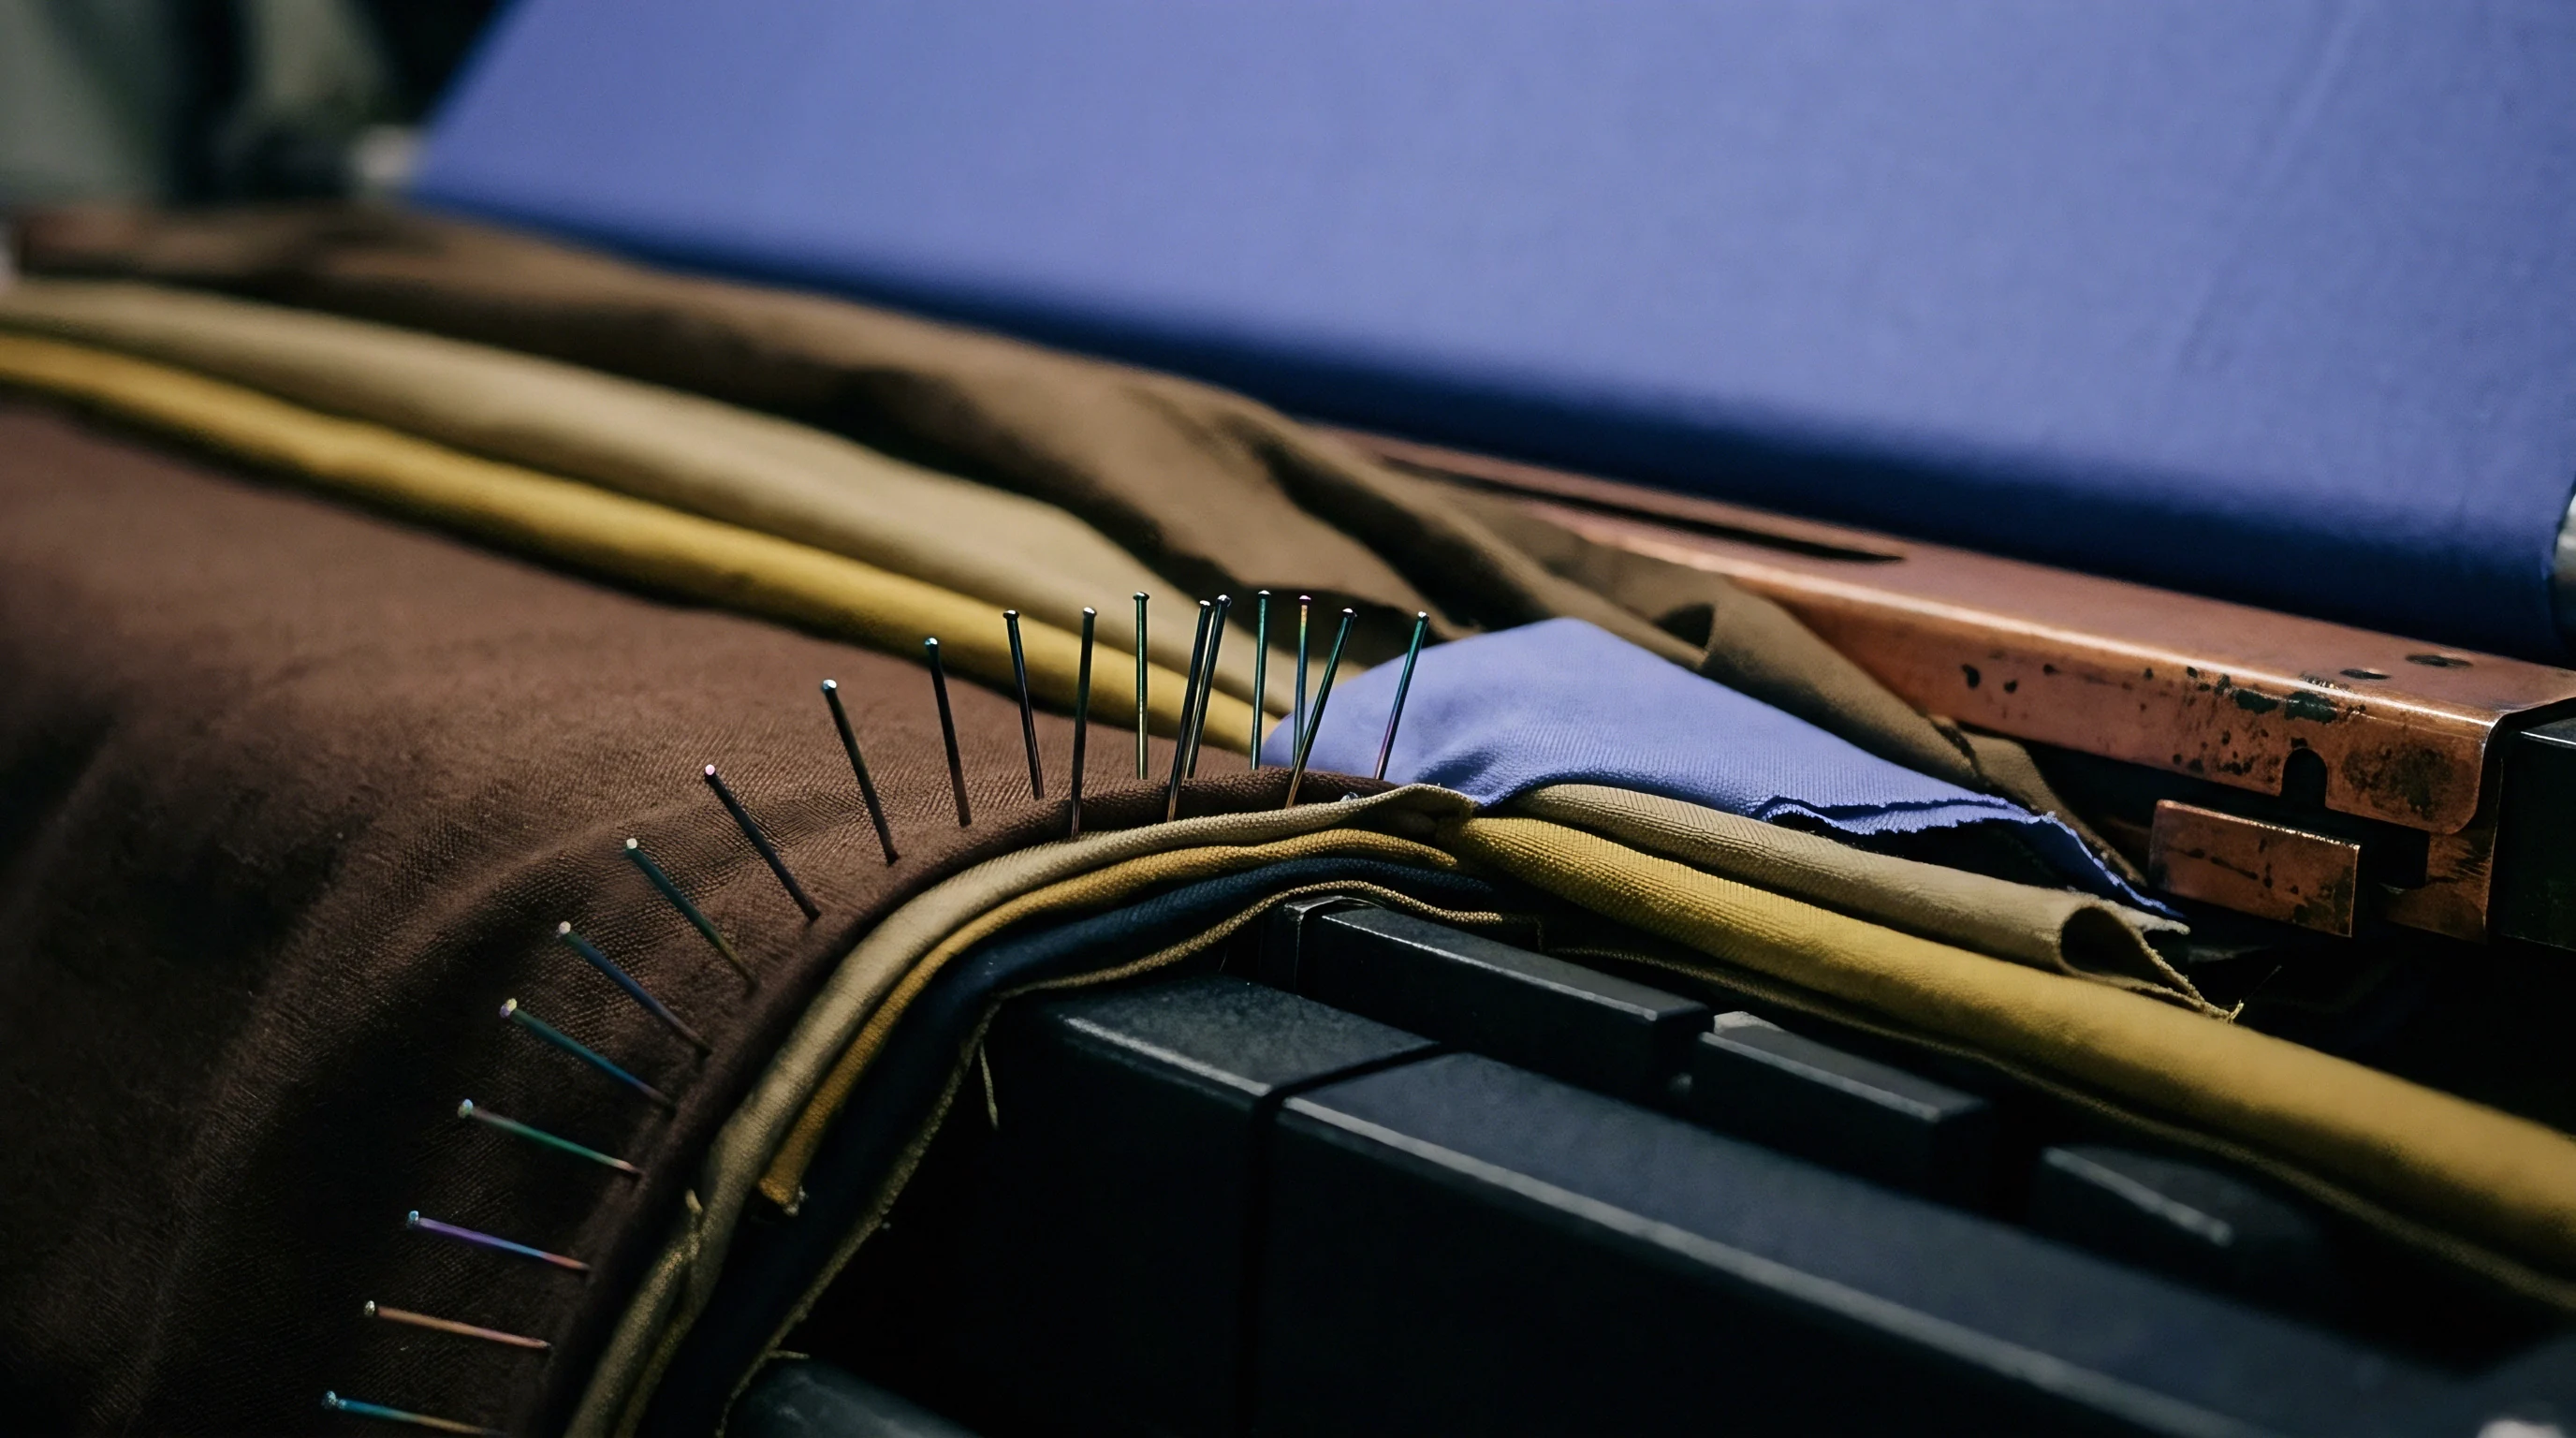
Mechanical Sources of Sett Dispersion
Loom mechanisms induce both cross-width and lengthwise density gradients during active manufacturing. Air-jet profiling nozzles exert differential drag across the filling insertion line, producing looser pick counts near the catching selvedge than near the main nozzle side. Similarly, uneven warp beam winding creates lateral bands of differential crimp that manifest as local pick gathering.
Reed dents position individual ends. These mechanical behaviors mean that thread density is never a static constant, but a distributed variable governed by machinery dynamics.
Ambient conditions in the loom shed exacerbate these mechanical variances. Cotton and cellulosic fibres exhibit immediate hygroscopic expansion under varying relative humidity, altering yarn diameter and inter-yarn friction at the beat-up point. Synthetic yarns such as polyester or polyamide react to ambient temperature changes, showing altered elongation under loom tension.
Moisture regain alters measured thread spacing. Without conditioning samples under standard atmospheric conditions before verification, incoming inspection data merely records momentary environmental distortion rather than true loom sett.


Reed
Direct verification of yarn density in loom-state goods demands strict alignment with standardized counting procedures. ASTM D3775 and ISO 7211-2 govern the determination of thread count per unit length, establishing the physical boundaries within which inspection counts occur. A technician cannot merely place an optical counter at an arbitrary point near the roll head; counts taken within one metre of a cut edge or within ten percent of the selvedge width reflect distorted yarn tensions rather than stable construction parameters.
Counting pick density demands optical magnification.
Optical pickup methods vary according to structural density and yarn construction types. Continuous filament yarns of fine denier demand travelling microscopes or high-resolution digital projection systems, whereas coarse ring-spun staple yarns permit verified optical graticule measurement. Dissecting the cloth into individual elements represents the ultimate arbitration method whenever optical counting yields ambiguous boundaries.
- Counting distance threshold dictates that any construction with fewer than ten yarns per centimetre mandates a minimum measuring length of ten centimetres to control counting uncertainty.
- Selvedge exclusion zone requires technicians to position measurement frames at least five centimetres inward from the outer pin marks or woven borders.
- Atmospheric conditioning window prescribes that all cut test swatches remain exposed to twenty degrees Celsius and sixty-five percent relative humidity for four continuous hours.
- Specimen distribution pattern establishes that consecutive measurements along a single sample roll must not share identical longitudinal warp ends or horizontal pick paths.
Standardized test routines require meticulous mechanical isolation of individual yarn paths. Technicians pull out yarns across the measurement frame, verifying that distorted yarn paths do not artificially inflate the visual sett. Manual yarn removal remains the benchmark procedure during commercial disputes, eliminating the refraction artifacts caused by slub yarns, irregular sizing, or heavy oil application.

Distinguishing Constructional Variants
Heavy twills, satins, and high-density plain constructions interact differently with optical verification equipment. Floating yarns in five-end satin arrangements cast shadows across interlacing points, complicating automated camera detection on high-speed inspection benches. In dense oxford constructions, paired warp ends seat tightly against adjacent dents, leading casual inspectors to count two ends as a single structural element.
Discrepancies in counting methods translate directly into adversarial claims between converters and weaving mills. Weavers dispute low pick counts by claiming that excessive storage tension elongated the roll or that off-loom relaxation had not yet concluded when the buyer executed incoming sampling.

Variance
Continuous measurement data allows acceptance decisions based on mathematical distribution rather than binary pass-fail tallies. Normality tests precede sample evaluation. When evaluating greige sett, thread density follows a Gaussian distribution across properly managed loom sheds. Variables sampling plans governed by ISO 3951-1 and ANSI/ASQ Z1.9 exploit this continuous distribution to quantify the risk of lot acceptance with extreme statistical power, drawing accurate inferences from small sample sizes.
An attribute plan under ISO 2859-1 requires twenty to fifty cut rolls to verify a lot against an Acceptable Quality Limit of one percent. Extracting fifty laboratory swatches from a container shipment damages valuable yardage and creates unsustainable labor overhead in receiving facilities. A variables plan evaluates identical risk with ten or fifteen sampled rolls, analyzing both the sample mean and the sample standard deviation against upper and lower specification limits.
Smaller sample sizes cut laboratory expenses.
Contractual adoption of ISO 3951-1 with an Acceptable Quality Limit of one percent reduces required roll cut samples by sixty percent relative to attribute counting.

Can Variables Plans Reduce Destructive Roll Testing?
Transitioning from attribute counting to variables plans preserves valuable yardage while improving detection of out-of-specification lots. Cutting a full-width swatch from thirty rolls consumes sixty running metres of cloth and leaves multiple rolls as remnant inventory. Evaluating fifteen rolls under a continuous variables plan preserves inventory integrity while delivering higher mathematical confidence regarding lot dispersion.
| Standard And Scheme | Inspection Level | Sample Size (n) | Acceptance Criterion | Roll Swatch Consumption (m) |
|---|---|---|---|---|
| ISO 2859-1 Attribute Plan | General Level II | 315 | Ac = 7, Re = 8 | 315.0 |
| ISO 2859-1 Attribute Plan | Special Level S-4 | 32 | Ac = 1, Re = 2 | 32.0 |
| ISO 3951-1 Variables Plan (s-method) | General Level II | 50 | k = 1.93 (Q ≥ k) | 50.0 |
| ISO 3951-1 Variables Plan (s-method) | Special Level S-4 | 10 | k = 1.41 (Q ≥ k) | 10.0 |
The operational gain of variables sampling hinges on the calculation of the quality statistic. For a two-sided specification where both minimum and maximum yarn densities govern wet processing performance, the evaluation assesses lower and upper parameters independently. Sample standard deviation scales the risk.
- Calculate the arithmetic mean of measured ends or picks across the complete set of drawn sample swatches.
- Determine the sample standard deviation using Bessel correction for unbiased variance estimation across the sampled rolls.
- Compute the quality statistic for lower and upper specification limits using the standard deviation divisor.
- Compare calculated quality indices against the tabulated acceptability constant k corresponding to the chosen inspection level and sample size.
When the quality statistic exceeds the acceptability constant, the lot demonstrates an acceptable fraction nonconforming. Conversely, if either index falls below the constant, the lot faces rejection due to excessive spread or significant target offset.

Worked Verification Case
Consider a sourcing scenario involving a 5,000-roll shipment of 20 tex cotton plain printcloth. The contract specifies a nominal greige filling sett of 28.0 picks per centimetre, with an Upper Specification Limit of 29.0 picks per centimetre and a Lower Specification Limit of 27.0 picks per centimetre. Sourcing terms dictate ISO 3951-1, Inspection Level S-4, normal inspection, with an Acceptable Quality Limit of 1.0 percent.
The corresponding plan specifies a sample size of ten rolls (n = 10) and an acceptability constant k equal to 1.41.
Ten sample swatches conditioned according to ISO 139 yield the following pick counts: 27.8, 27.4, 28.1, 27.6, 27.3, 27.9, 27.5, 27.7, 28.0, and 27.2 picks per centimetre. The resulting sample mean equals 27.65 picks per centimetre. The sample standard deviation equals 0.295 picks per centimetre.
The upper quality index calculation yields Q_U = (29.0 – 27.65) / 0.295 = 4.58. The lower quality index calculation yields Q_L = (27.65 – 27.0) / 0.295 = 2.20. Both indices exceed the acceptability constant k of 1.41.
The lot meets acceptability limits. However, if the standard deviation had reached 0.50 picks per centimetre due to loom instability, the lower quality index would have dropped to 1.30, triggering immediate lot rejection.
Whether incoming lots with non-normal sett distributions can be safely evaluated using Box-Cox transformations remains an open debate among textile inspection bureaus.


Batch
Managing variables acceptance sampling across continuous mill production requires rigorous tracking of production batches. A single weaving shed may assign twenty looms to a specific contract, yet warp sizing variations, loom mechanical conditions, and distinct yarn lot assignments create distinct sub-populations within a single delivery. Blending distinct loom batches into a single sampling lot invalidates the normality assumption required by variables calculations.
Tightened inspection doubles the sampling rate.
Inspection managers organize sampling units based on loom allocation and beam changes. When drawing five rolls from a delivery, each roll must originate from a distinct loom frame and warp sizing set. Selecting five consecutive rolls from one loom creates severe autocorrelation, misrepresenting the broader lot dispersion and artificially deflating the standard deviation.

Switching Rules and Risk Management
Variables sampling protocols feature mandatory switching mechanics that protect buyers against creeping supplier degradation while granting inspection relief to stable producers. Under ISO 3951-1, incoming shipments enter under normal inspection. When five consecutive batches satisfy acceptance thresholds, the receiving depot qualifies for reduced inspection, halving the required swatch sample size.
Conversely, when two out of five consecutive lots fail variables verification, inspection immediately shifts to tightened rules. Tightened inspection increases the acceptability constant k, demanding tighter standard deviations or wider margins from specification boundaries. If five consecutive lots remain under tightened inspection without qualification for normal testing, commercial contracts permit immediate suspension of supplier acceptance lines.
- Normal inspection entry governs all unproven supply chains and initial purchase order commitments until historical stability metrics emerge.
- Reduced inspection qualification takes effect when ten consecutive lots gain acceptance under normal parameters without process interruptions.
- Tightened inspection escalation activates immediately whenever two lots within five consecutive incoming batches fail to meet acceptance constant thresholds.
- Acceptance suspension clause terminates receiving activities when five consecutive tightened lots fail to achieve acceptance status.
Applying these switching rules prevents gradual construction erosion. Weavers operating under tight margins face strong incentives to adjust loom let-off to the lowest tolerable limit. Systematic variables inspection catches downward mean migration long before individual rolls violate absolute commercial thresholds.
ISO 3951-1 Clause 19 establishes that any lot failing the normality criterion must automatically revert to attribute sampling under ISO 2859-1, eliminating mathematical shortcuts when sample distributions exhibit multi-modal clustering.

Stenter
Greige yarn density directly determines the downstream processing window inside the dyehouse. Dyehouses absorb upstream yardage variations. When loom-state goods enter preparation ranges for desizing, scouring, and bleaching, wet relaxation releases latent tensions imparted by warp winding and filling insertion. Warp yarns crimp, drawing weft picks closer together, while weft relaxation widens or contracts the total sheet width depending on yarn twist and tension profiles.
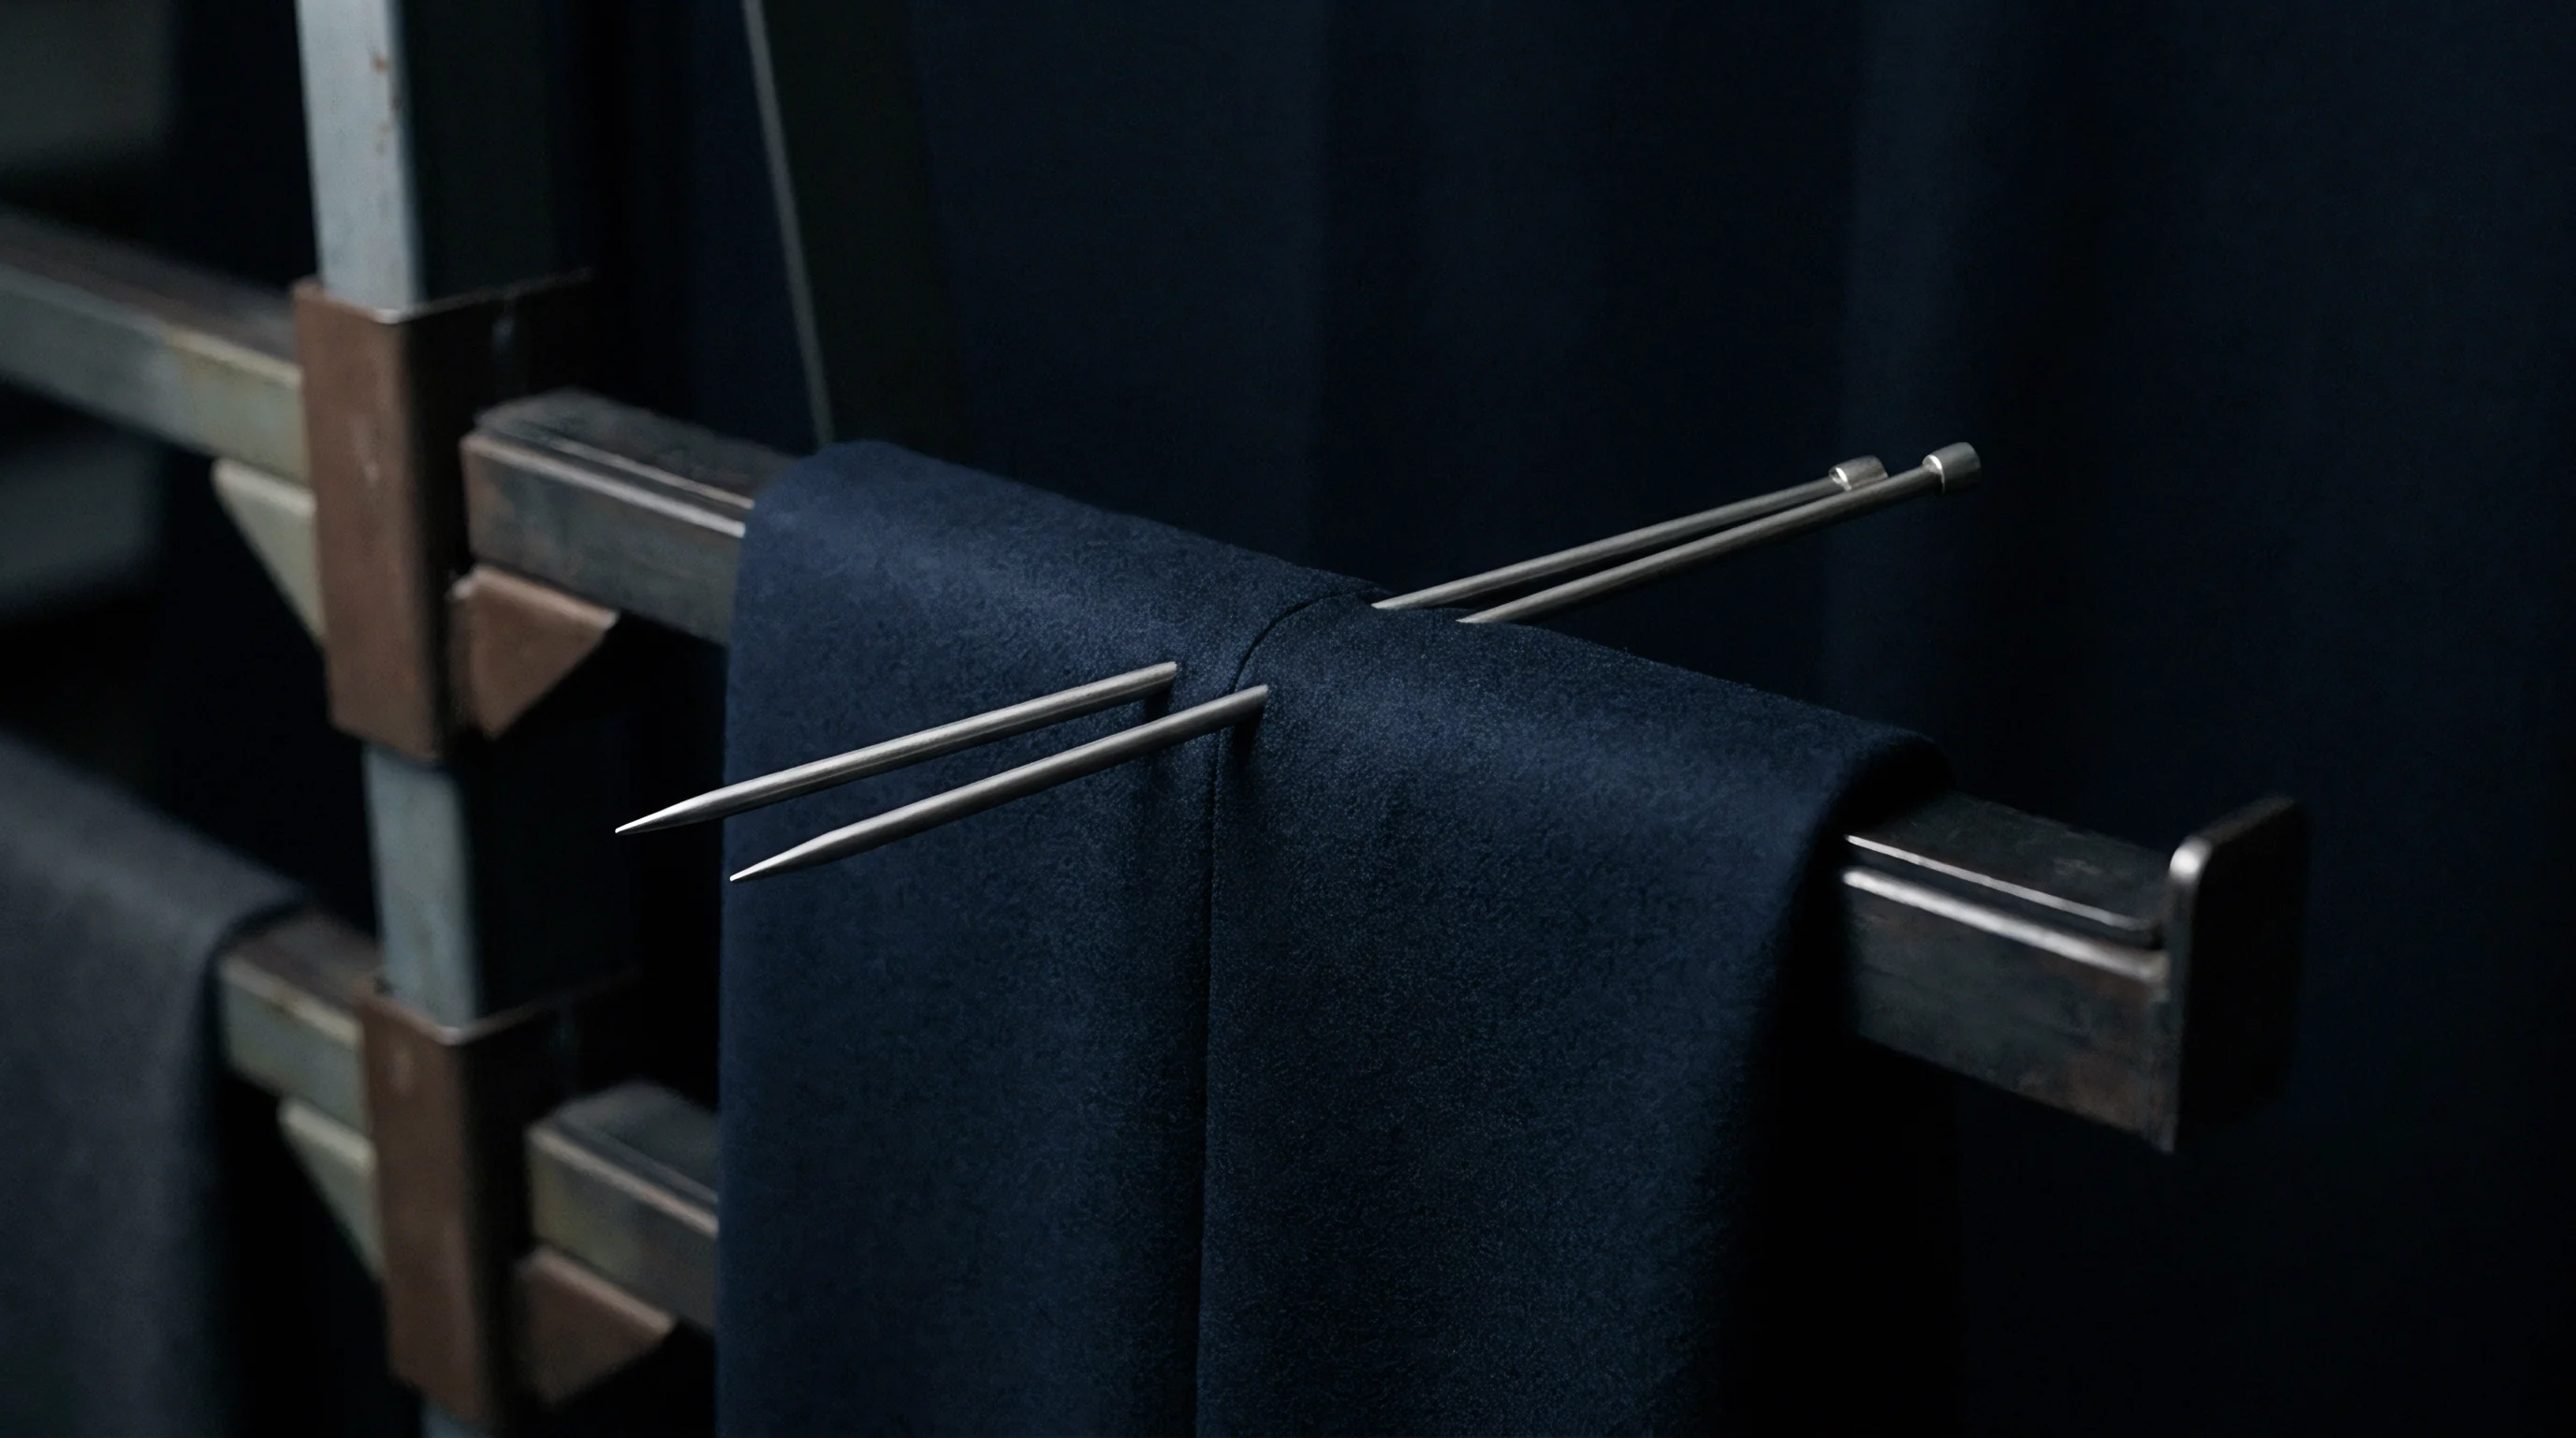
Finishing ranges use pin stenters to establish finished width, mass per unit area, and residual shrinkage. If a greige lot arrives with filling counts below specification, the finisher must overfeed the cloth longitudinally into the stenter pins to pack extra picks per centimetre into the finished structure. Overfeed settings manipulate lengthwise relaxation. Excess longitudinal overfeed shortens total finished output yardage, transferring financial loss directly to the conversion ledger.
Greige cloth delivered with loose pick counts forces the finisher to compress width to salvage areal mass.

Where Do Finishing Shrinkage Discrepancies Originate?
Discrepancies in finished dimensions stem from compensation maneuvers executed during stenter drying and heat setting. When greige pick counts are deficient, stretching the cloth to contract width artificially increases filling density, but stores severe elastic strain within the filling yarns. The customer receives cloth at the specified weight and width, but the first domestic laundering cycle releases the stored strain, generating unacceptable filling shrinkage.
| Base Construction Name | Nominal Greige Sett (ends x picks / cm) | Finished Sett Target (ends x picks / cm) | Areal Weight Gain Factor | Maximum Tolerable Greige Pick Deviation |
|---|---|---|---|---|
| Cotton Poplin (40s x 40s) | 52.0 x 28.0 | 55.5 x 29.5 | + 7.5% | ± 0.6 picks/cm |
| Cotton Twill 2/1 (20s x 16s) | 42.5 x 22.0 | 46.0 x 23.5 | + 9.2% | ± 0.5 picks/cm |
| Polyester Microfiber Plain | 64.0 x 36.0 | 67.0 x 37.0 | + 4.1% | ± 0.8 picks/cm |
| Viscose Plain Sheeting | 30.0 x 24.0 | 33.5 x 26.5 | + 12.0% | ± 0.4 picks/cm |
The transformation factors listed above reflect steady-state finishing under five percent warp overfeed and standard pad-steam dyeing ranges. Off-spec greige inflates finished shrinkage. Viscose and cellulosic staple goods exhibit pronounced wet relaxation, making them exceptionally vulnerable to small greige pick deficits. A deficit of 0.8 picks per centimetre on greige viscose poplin forces the dyehouse to accept either an eight percent reduction in delivered metres or a finished article that fails international retail shrinkage audits.
Finishing floors that attempt to mask low greige pick densities by applying excessive chemical resin cross-linkers incur severe losses in tear strength and flex abrasion resistance, resulting in finished goods rejections at the garment cutting facility.

Settlement
Commercial contracts govern how buyers and weaving mills resolve lot nonconformities identified through variables verification. When an incoming lot fails an ISO 3951-1 plan, the buyer holds verified numerical proof that the lot’s nonconforming fraction exceeds contractual thresholds. Missing picks reduce total cloth weight. Sourcing organizations must possess clear, contractually binding settlement frameworks to manage nonconforming materials without disrupting the broader apparel manufacturing schedule.
A failed variables inspection triggers three potential operational routes: lot rejection with supplier replacement, commercial price renegotiation based on missing fibre mass, or conditional acceptance with finishing process modifications funded by the weaver. Commercial invoices reflect certified construction values. If garment delivery deadlines preclude awaiting replacement greige goods, the conversion team accepts the lot under a formal debit memo structure.
Commercial claims on yarn density fail when receiving yards are measured before moisture equilibrium is reached.

Commercial Debit Mechanisms
Quantifying financial adjustments for deficient greige sett involves structural and operational parameters. When pick density falls two percent below contract nominals, raw fibre consumption decreases proportionately across the total linear delivery. The buyer calculates the raw material savings retained by the weaver and debits that amount directly from the commercial invoice.
Secondary costs incurred by the dyehouse compound this material adjustment. If the finisher must slow the stenter line from forty metres per minute to twenty-eight metres per minute to execute radical overfeeding, the weaver absorbs the resulting line-time surcharge. Similarly, if overfeeding reduces finished yield from ten thousand metres to nine thousand seven hundred metres, the lost conversion margin forms an explicit component of the settlement claim.
Establishing clear sampling parameters in the master purchase agreement ensures that variables calculations govern financial recovery rather than subjective disputes. Fabric sourcing teams that anchor their purchase orders to standardized variables sampling plans secure total operational and legal authority over their raw material pipelines.
Weavers will routinely concede minor debit charges on yarn mass while resisting any commercial accountability for downstream finishing yield losses.