Inter-Laboratory Precision Limits and Statistical Error Allocation in Transatlantic Textile Commercial Claims
Transatlantic textile claims resolve by applying critical difference calculations to inter-laboratory test variances before declaring commercial non-conformity.
Gauge
Atmospheric Control Standards across Ocean Limits
Disputes over cross-border textile shipments often originate inside the conditioning chamber rather than on the dock. ISO 139 sets test conditioning at 20 degrees Celsius and 65 percent relative humidity, whereas ASTM D1776 calls for 21 degrees Celsius and 65 percent relative humidity. That single degree difference shifts moisture regain rates in hygroscopic natural fibers like wool and viscose.
For regenerated celluloses, even slight ambient relative humidity shifts alter baseline mass and tensile breaking force. Still, laboratory humidity logs regularly record drift well past the plus or minus two percent relative humidity window permitted under accredited standards.
Reaching moisture equilibrium depends entirely on fiber chemistry. Hydrophobic synthetics settle within four hours, but cellulosics often require twenty-four hours in the chamber, and wool demands forty-eight hours of low-humidity pre-conditioning before entering the standard atmosphere. Laboratories rushing turnaround times routinely cut these intervals short.
When cotton is tested before it fully conditions, dry mass, burst strength, and dimensional stability figures drift. A lot cleared in Europe under ISO 139 will therefore diverge when re-tested in North America under ASTM D1776 if the specimen never reached full moisture equilibrium.
Errors in mass follow through every subsequent calculation. Dry mass determinations governed by ISO 6330 or ASTM D2654 set the denominator for chemical concentrations expressed on a mass-per-mass basis; if residual moisture skews the starting weight, those concentration figures move with it. Free formaldehyde, reported in milligrams per kilogram of fabric, climbs if ambient humidity inflates specimen mass prior to solvent extraction.
When baseline mass drifts between facilities, solvent extraction assays lose consistency, and commercial claim disputes end up turning on whether a non-conformance reflects an actual fabric defect or simply incomplete specimen conditioning.

Instrumental Calibration and Calibration Artifacts
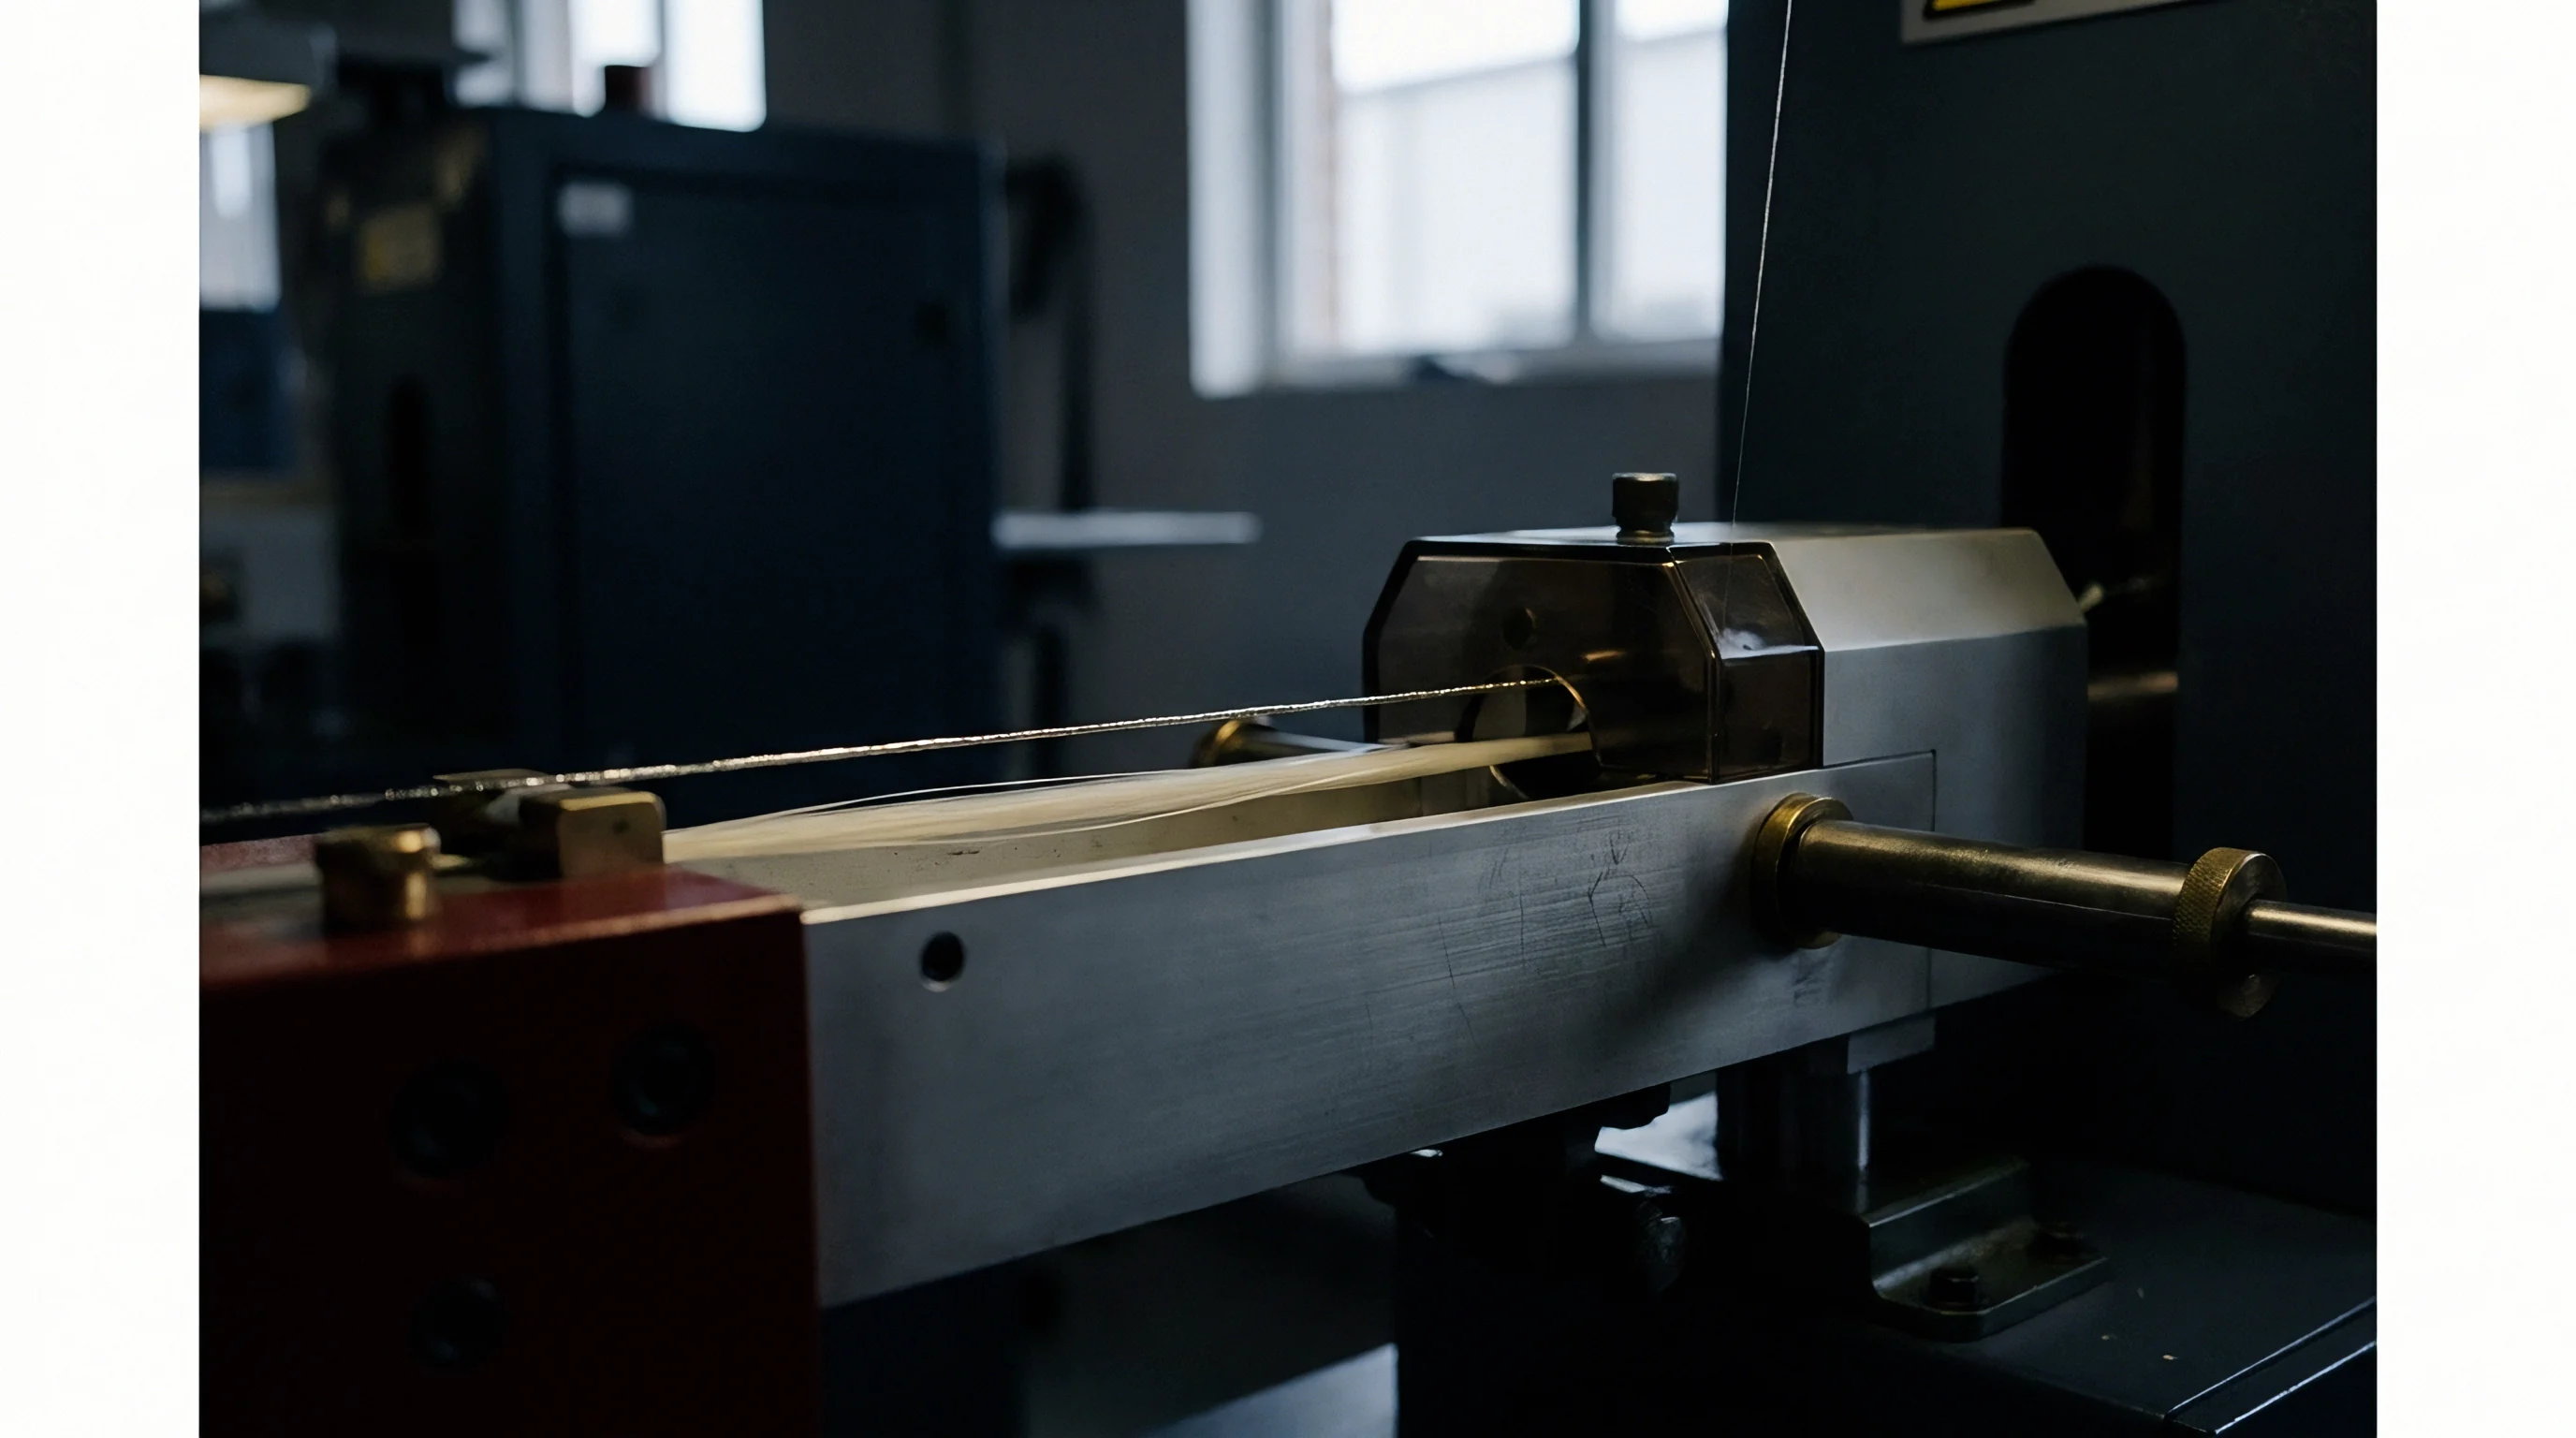
Tensile frame performance varies across load cell capacities and manufacturer designs. Both ISO 13934-1 and ASTM D5034 require constant-rate-of-extension instruments to measure breaking force, but calibrating zero points during ambient temperature swings causes load cell responses to drift across a shift. Grip pressure introduces its own errors: excessive pneumatic clamping crushes yarns at the jaw line and produces artificially low breaking strengths, while insufficient pressure lets the fabric slip, rounding off the load-elongation peak and distorting the modulus.
| Physical Parameter | ISO Test Method | ASTM Test Method | Environmental Standard | Typical Inter-Lab Variation |
|---|---|---|---|---|
| Tensile Strength (Strip) | ISO 13934-1 | ASTM D5035 | 20°C / 65% RH vs 21°C / 65% RH | 6.5% to 11.2% |
| Tear Strength (Elmendorf) | ISO 13937-1 | ASTM D1424 | 20°C / 65% RH vs 21°C / 65% RH | 8.1% to 14.0% |
| Bursting Strength (Pneumatic) | ISO 13938-1 | ASTM D3786 | Direct diaphragm pressure calibration | 4.2% to 9.8% |
| Abrasion Resistance (Martindale) | ISO 12947-2 | ASTM D4966 | Standard abradant fabric batch variance | 12.0% to 22.5% |
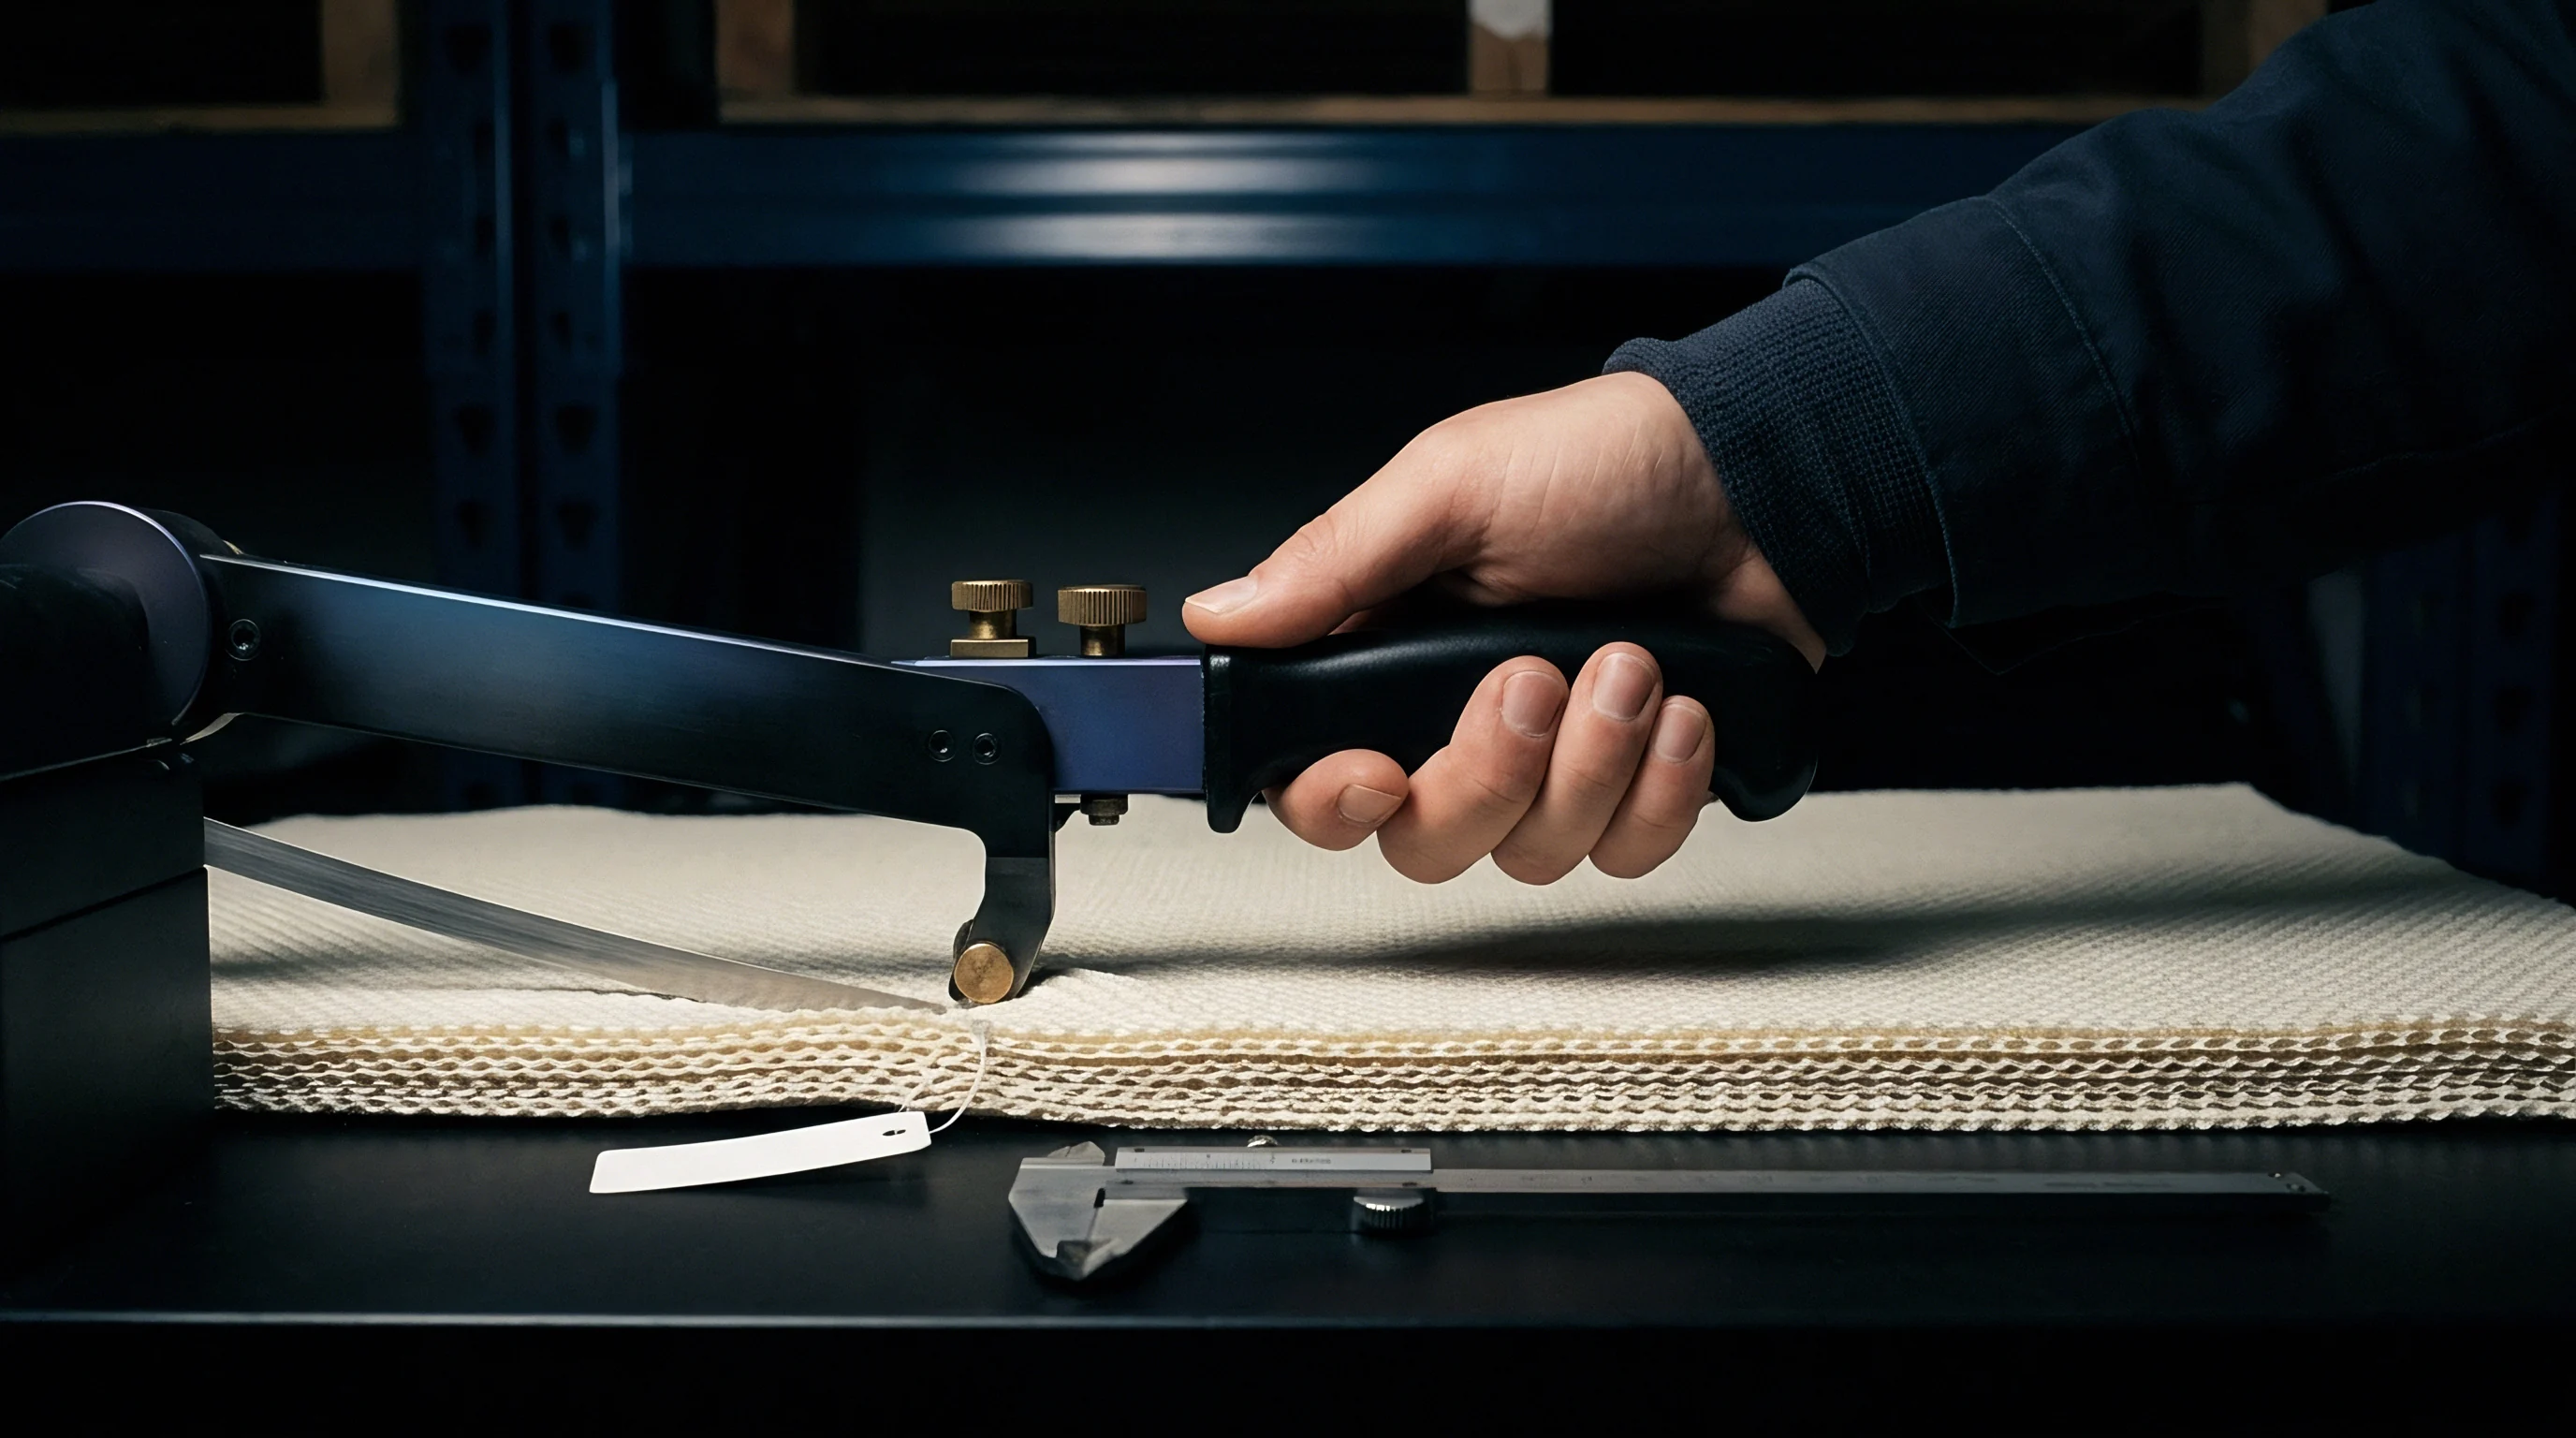
Sample geometry brings its own systemic spread to tensile data. Strip testing under ISO 13934-1 specifies a 50 millimeter gauge width, while ASTM D5035 allows 25 millimeter or 50 millimeter options alongside different gauge lengths. Edge preparation matters just as much: hand shears leave jagged notches that trigger premature tearing under tension.
Die cutting or automated laser tables resolve that edge variability, but laser cutting melts synthetic selvages together, creating a bead that reinforces the specimen along the axis of pull. Differentiating between actual yarn failure and preparation damage requires inspecting the cut edge under magnification.
Standard testing conditions must maintain strict atmospheric stability to prevent moisture-induced variance in hygroscopic fiber tensile evaluations.
Colorfastness ratings are a persistent source of inter-laboratory conflict, mostly because instrumental reads and visual panels diverge. ISO 105-A05 calculates gray scale change instrumentally to eliminate observer subjectivity. Visual methods under ASTM rely on standardized D65 lighting booths, where observer metamerism and aging interior paint finishes regularly skew human grades.
Even spectrophotometers measuring crocking under ISO 105-X12 or AATCC Method 8, which yield quantitative CIELAB differences, shift significantly depending on specular gloss inclusion or exclusion settings on micro-denier goods. A half-step variance on a five-grade scale can trigger the rejection of a shipment whose dye fixation meets every practical requirement.
Acceptance sampling plans tied to ANSI/ASQC Z1.4 rest entirely on the precision statements published in individual method annexes. ISO 5725-2 sets the statistical basis for establishing repeatability standard deviation sr and reproducibility standard deviation sR. Repeatability reflects the variance seen within a single laboratory under identical conditions over a short run; reproducibility measures the spread across different facilities, operators, equipment, and ambient setups.
If a purchase order fails to specify acceptable inter-laboratory reproducibility limits, disputes default to generic precision tables that seldom reflect high-speed modern manufacturing.
Under international sales law, contracts that incorporate standard test methods by reference bind buyer and seller directly to the precision statements published within those standards.

Scatter

Variance Partitioning in Multi-Laboratory Datasets
Interpreting multi-laboratory test results requires breaking total observed variance down into its constituent parts: fabric non-uniformity, specimen preparation, operator habits, load cell offsets, and ambient noise. Analysis of variance (ANOVA) separates the total sum of squares into within-laboratory and between-laboratory components. The within-lab portion reflects the inherent repeatability of the procedure, while between-lab variance captures systematic differences caused by calibration offsets, chamber drift, or technician technique.
Quantifying these components relies on nested random-effects models. High material variance points to unstable yarn spinning or uneven dye liquor application across the fabric width, whereas elevated between-laboratory variance flags instrument misalignment or diverging procedural interpretations. In tearing strength round-robin evaluations, between-laboratory variance accounts for sixty-four percent of total observed deviation.
Allocating liability between mill and buyer requires isolating these variance components before declaring a lot non-conforming.
Specimen location across the roll profile heavily influences baseline variance. Cutting near the selvedge picks up distortion from loom temple pins, edge tension, and uneven stenter airflow. ISO 13937 requires taking swatches at least 150 millimeters in from the selvedge along a stepped diagonal.
ASTM D1424 specifies a comparable pattern, though technicians still pull swatches from the outer roll wrap where fabric has absorbed or lost moisture in transit. Because moisture gradients along the roll distort tear values, standard sampling protocols mandate stripping and discarding the outer three wraps before taking test specimens.
Blended textiles add further variability. Elastomeric core-spun yarns deform non-linearly, and viscose-elastane constructions are notoriously sensitive to mounting tension. Clamping an elastomeric specimen by hand inevitably pre-stretches the core before the crosshead moves, depressing the recorded breaking force.
Standardizing on pneumatic grips with regulated clamping pressure removes this manual pre-tensioning error; without pneumatic control, within-laboratory standard deviation can double, masking the true physical properties of the fabric.
Failure Modes in Precision Estimation Protocols
Reproducibility studies run under ISO 5725-2 or ASTM E691 rely on consistency statistics to isolate problematic testing sites. Mandel’s h tracks between-laboratory consistency across materials, while Mandel’s k monitors within-laboratory consistency to uncover erratic internal repeatability. A laboratory exceeding critical h values is typically running with an uncorrected calibration offset.
Spikes in the k statistic point toward inconsistent technician technique or fluctuating chamber controls.
Failing to screen for outliers allows uncalibrated facilities to warp published precision benchmarks. For example, laboratories operating in humid environments without continuous dehumidification generate skewed data on hydrophilic materials; cotton abrasion resistance measured by ISO 12947-2 drops sharply as elevated humidity softens the fiber surface. Applying Grubbs’ or Cochran’s tests to identify and eliminate these anomalies protects baseline precision figures.
When evaluating commercial claims, parties must verify whether the laboratories involved maintain active ISO/IEC 17025 accreditation for the exact test method under dispute.
- Specimen Edge Damage occurs when dull cutting dies crush yarn ends, creating micro-cracks that reduce measured tear resistance by up to eighteen percent.
- Clamp Slippage Defects manifest as non-linear load-elongation curves, flattening force peaks and artificially inflating recorded elongation at break values.
- Atmospheric Moisture Drift alters moisture regain in cellulosic fibers, changing structural yarn friction and skewing tensile parameters.
- Observer Metamerism Bias distorts visual color rating scores when laboratory technicians evaluate fastness swatches under non-standard light sources.
- Solvent Extraction Saturation reduces chemical extraction efficiency when laboratory technicians reuse saturated extraction solvents across multiple analytical runs.
The total error budget in textile testing contains material variability that calibration cannot eliminate. Inherent density shifts across a lot produce an irreducible baseline of noise: woven goods vary in filling density by plus or minus two picks per centimeter across the beam, while knits show loop length variation caused by dynamic yarn feed tension. Commercial contracts that disregard this underlying material variance create unavoidable friction between mills and buyers.
Calculating the standard deviation of reproducibility sR allows for realistic commercial tolerance bands. The reproducibility limit R represents the maximum expected absolute difference between two single test results obtained on identical material across different laboratories at a ninety-five percent confidence level. The relationship is expressed as:
R = 2.77 times s_R
If the absolute difference between a buyer’s test result and a seller’s test result falls below the calculated reproducibility limit R, the two outcomes are statistically indistinguishable. Rejecting a shipment over a test difference smaller than R violates basic measurement principles.
Inter-laboratory differences falling within calculated reproducibility limits represent normal statistical variation rather than material non-conformity.
Laboratory proficiency programs provide empirical data on real-world inter-laboratory reproducibility. Blind round-robin testing across accredited transatlantic facilities shows that tear strength, abrasion resistance, and formaldehyde content exhibit wide reproducibility distributions. Formaldehyde quantification by water extraction under ISO 14184-1, for instance, demonstrates reproducibility coefficients of variation ranging from fifteen to twenty-five percent across certified facilities.
Expecting single-point agreement between buyer and seller laboratories under these precision limits is statistically unfeasible.
Failing to establish joint testing protocols before commercial shipment leaves the buyer exposed to full re-testing expenses when secondary laboratory results fall well within normal reproducibility bounds.

Vat
Chemical Extraction Dynamics and Limits of Detection
Testing for wet processing residues presents complex analytical challenges driven by extraction kinetics and matrix interference. Restricted substance regulations set zero or ultra-low concentration limits for hazardous chemicals. Azo colorant analysis under EN ISO 14362-1 requires reductive cleavage of azo bonds to release aromatic amines, followed by solvent extraction and gas chromatography-mass spectrometry quantification.
Standard cleavage protocols use sodium dithionite at elevated temperatures; slight variations in reaction vessel temperature or cleavage duration alter aromatic amine yield, causing inter-laboratory quantification to diverge.
Matrix effects in dyed synthetic fibers also hinder complete solvent extraction. Disperse dyes applied to polyester sit deep within the polymer matrix. Complete extraction of residual disperse dyes under DIN 54231 requires dimethylformamide or tetrahydrofuran solvents at elevated temperatures.
Incomplete solvent penetration yields falsely compliant low dye values. Conversely, prolonged extraction at high temperatures degrades delicate organic analytes, producing false negatives. Laboratories that alter extraction times to accelerate sample throughput introduce significant measurement error relative to standard reference methods.
| Chemical Target Analyte | Test Standard | Analytical Instrument | Limit of Detection (LOD) | Limit of Quantification (LOQ) | Reproducibility CV (%) |
|---|---|---|---|---|---|
| Cleaved Aromatic Amines | EN ISO 14362-1 | GC-MS / LC-MS | 5.0 mg/kg | 20.0 mg/kg | 18.5% |
| Extractable Heavy Metals | EN ISO 16711-1 | ICP-MS / ICP-OES | 0.1 mg/kg | 1.0 mg/kg | 12.2% |
| Free Formaldehyde | ISO 14184-1 | UV-Vis Spectrophotometry | 2.0 mg/kg | 16.0 mg/kg | 22.0% |
| Per- and Polyfluoroalkyl Substances | EN 17681-1 | LC-MS/MS | 0.02 mg/kg | 0.10 mg/kg | 28.4% |
| Organotin Compounds | ISO 22744-1 | GC-MS | 0.01 mg/kg | 0.05 mg/kg | 16.8% |
Instrument noise dictates the boundary between limit of detection (LOD) and limit of quantification (LOQ). LOD represents the lowest analyte concentration producing a signal-to-noise ratio of three to one, whereas LOQ represents the concentration yielding a ten to one ratio. Quantitative commercial claims must be evaluated strictly against LOQ thresholds.
Reporting trace concentrations below LOQ introduces severe statistical uncertainty, as instrument baseline drift easily mimics the presence of an analyte. Transatlantic chemical compliance disputes often trace back to one laboratory reporting numerical values between LOD and LOQ while another correctly reports the result as below quantification limits.
Calibration curve construction dictates analytical linearity. Mass spectrometry calibration requires multi-point standard curves across target concentration ranges. Matrix-matched standards are necessary to suppress signal enhancement or ion suppression from extracted textile auxiliaries; using pure solvent calibration curves instead leads to quantitative errors exceeding thirty percent on complex dyed finishes.
Accredited testing facilities must demonstrate a linear calibration response with correlation coefficients exceeding 0.995 across target concentration bands.

Residual Chemical Partitioning and Substrate Variability
Dyehouse finishing operations introduce spatial chemical variations across fabric lots. Stenter frame bath concentration drops over long production runs if chemical replenishment lags fabric throughput. Padding operations also show pick-up variance from side to center across mangle rolls: a swatch taken from the left selvedge might hold 120 milligrams per kilogram of fluorinated water-repellent finish, while the center section carries only 80 milligrams per kilogram.
Evaluating lot conformity based on a single swatch leads to misleading non-compliance findings.
Analytical chemical quantification below established limits of quantification introduces high measurement uncertainty that cannot support commercial breach claims.
Extracting hexavalent chromium in leather trims under EN ISO 17075 demands strict pH control. Chromate extraction relies on phosphate buffer solutions maintained between pH 7.5 and 8.0. Shifts in buffer pH alter chromium species equilibrium, causing interconversion between trivalent and hexavalent chromium.
Ambient sunlight or thermal drying after sampling also converts trivalent chromium to hexavalent chromium, skewing analytical results. Sampling, packaging, and shipping swatches in UV-opaque foil wraps prevents these post-sampling photo-oxidation artifacts.
Analysis of per- and polyfluoroalkyl substances (PFAS) under EN 17681-1 highlights extreme inter-laboratory variance caused by background contamination. Laboratory glassware, PTFE tubing, and liquid chromatography components leach trace perfluorinated compounds into analytical blanks. Eliminating this requires specialized instrument retrofits, fluoropolymer-free extraction apparatus, and ultra-pure reagents.
Without strict contamination controls, a laboratory will report false-positive PFAS detections, triggering regulatory non-compliance claims under European REACH Annex XVII or North American state-level bans.
Non-conforming chemical findings frequently conflict with transit contamination or un-gloved handling at receiving docks.
Chemical compliance audits require composite sampling across multiple rolls alongside strict chain-of-custody documentation to withstand legal scrutiny during commercial disputes.

Divergence

Transatlantic Error Allocation Models
Resolving commercial non-conformity claims requires a mathematical framework for allocating statistical error between buyer and seller laboratories. ISO 5725-6 and ASTM D4855 offer structured methodologies to evaluate agreement between two facilities testing identical material. The core metric is the Critical Difference (CD), which sets the maximum allowable gap between two laboratory averages that can still be attributed to random testing error alone.
Calculating the Critical Difference between two single test results from different laboratories relies on the reproducibility standard deviation sR of the test method:
CD = 1.96 times sqrt{2} times s_R = 2.77 times s_R
When comparing the average of n1 test specimens from Laboratory 1 with the average of n2 test specimens from Laboratory 2, the formula incorporates both the repeatability standard deviation sr and the between-laboratory variance component sL2:
CD = 1.96 times sqrt{2 times s_L^2 + left( frac{s_r^2}{n_1} + frac{s_r^2}{n_2} right)}
If the observed difference between Laboratory 1 (buyer) and Laboratory 2 (seller) is less than or equal to CD, the discrepancy is statistically insignificant at the ninety-five percent confidence level. Under standard commercial sales agreements, the buyer must accept the lot without financial adjustment whenever test discrepancies remain within that CD threshold.
Which Statistical Model Resolves Inter-Laboratory Variance Claims?
Evaluating commercial claims under transatlantic sales frameworks requires choosing between the ASTM D4855 hypothesis testing model and the ISO 14224 acceptance sampling model. ASTM D4855 applies a two-tailed t-test to determine whether laboratory means differ significantly relative to historical precision estimates. The ISO model, by contrast, integrates producer risk (α, the probability of rejecting a conforming lot) and consumer risk (β, the probability of accepting a non-conforming lot) directly into acceptance operating characteristic curves.
- Formulate Hypothesis Statements establishing the null hypothesis that the true lot property meets specification and the observed laboratory difference is zero.
- Determine Method Precision Parameters by extracting validated sr and sR values from international standard precision annexes or joint proficiency study data.
- Calculate Sample Size Coefficients adjusting critical difference boundaries based on the exact number of replicate specimens tested at each site.
- Compute Critical Difference Threshold applying the nested variance component equation at the designated ninety-five percent confidence level.
- Compare Absolute Observed Difference against calculated CD; if the observed difference exceeds CD, reject the null hypothesis and attribute the discrepancy to material non-conformity or systemic lab bias.
Consider a commercial dispute involving cotton duck fabric breaking strength under ASTM D5034. The contract specifies a minimum warp breaking strength of 800 Newtons. The seller’s certified mill laboratory reports a mean breaking strength of 825 Newtons based on five specimens (n1 = 5).
The buyer’s port-of-entry testing laboratory reports a mean breaking strength of 770 Newtons based on five specimens (n2 = 5). Citing non-conformity, the buyer issues a rejection claim for 50,000 meters of fabric.
Evaluating the validity of the buyer’s claim requires historical precision parameters for ASTM D5034 woven fabric testing. Published repeatability standard deviation is sr = 18.5 Newtons, and between-laboratory standard deviation is sL = 28.2 Newtons. Applying the Critical Difference formula for sample averages yields:
CD = 1.96 times sqrt{2 times (28.2)^2 + left( frac{(18.5)^2}{5} + frac{(18.5)^2}{5} right)}
CD = 1.96 times sqrt{2 times 795.24 + left( frac{342.25}{5} + frac{342.25}{5} right)}
CD = 1.96 times sqrt{1590.48 + 136.9} = 1.96 times sqrt{1727.38} = 1.96 times 41.56 = 81.46 text{ Newtons}
The observed difference between the seller’s laboratory and the buyer’s laboratory is 825 – 770 = 55 Newtons. Because this 55 Newton difference is smaller than the Critical Difference of 81.46 Newtons, the discrepancy is entirely attributable to expected inter-laboratory test variability. The buyer’s rejection claim lacks statistical validity, and the material must be accepted under standard commercial contract terms.
Contractual specifications setting hard upper or lower compliance thresholds without critical difference bands create unquantifiable rejection risks for textile mills.
When test results trigger commercial disputes, allocating re-testing costs depends on statistical power calculations. Testing additional specimens narrows the confidence interval around the mean, reducing within-laboratory variance contributions. Increasing sample size from five specimens to twenty cuts the repeatability component of the CD equation by more than half, yet the between-laboratory component sL2 remains unchanged.
Consequently, multi-laboratory disputes cannot be resolved simply by increasing specimen counts inside a single laboratory if systemic between-laboratory bias dominates the overall error budget.
How can commercial contracts effectively partition measurement risk when international testing standards report widely divergent reproducibility values for identical physical parameters?
Defense
Evidentiary Requirements for Re-Testing Protocols
Defending against an invalid commercial rejection requires systematically assembling analytical evidence that proves laboratory competency and sample integrity. Certificates of Analysis issued by seller laboratories must present complete raw testing data, including environmental room logs, equipment identification numbers, software algorithm versions, and individual specimen failure modes. Conclusory summary certificates omitting raw data carry little evidentiary weight in international arbitration proceedings under UNCITRAL rules.
Independent third-party referee laboratories provide the standard mechanism for resolving inter-laboratory deadlocks. Dispute clauses in cross-border supply contracts should mandate selecting an accredited referee facility agreed upon by both parties prior to production. That referee laboratory must receive sealed, undisturbed retained samples taken simultaneously with original test specimens, packaged in vacuum-sealed moisture-barrier bags to prevent ambient degradation during storage.
- Verify ISO/IEC 17025 accreditation scope and calibration certificates for all instruments involved in both initial testing rounds.
- Audit environmental control logs of both buyer and seller laboratories for the specific twenty-four-hour period surrounding specimen pre-conditioning and testing.
- Extract retained, vacuum-sealed fabric swatches from original mill production rolls under joint buyer-seller witness supervision.
- Dispatch retained swatches to a pre-designated third-party referee laboratory for blind testing using identical specimen count protocols.
- Apply Critical Difference equations to compare referee laboratory output against original buyer and seller datasets.
Blind testing protocols prevent cognitive confirmation bias during referee analysis. The referee facility receives coded swatches stripped of any identification regarding origin, buyer identity, or prior test outcomes. If the referee laboratory result falls within the Critical Difference range of the seller’s original certified outcome, the buyer absorbs all referee testing expenses and accepts the shipment.
If the referee result aligns with the buyer’s non-conforming report, the seller covers referee costs and replaces the lot.
Contractual risk allocation improves when purchase orders define a two-tier precision buffer around specification limits. Specification limits should incorporate a statistical guardband equal to half the standard reproducibility limit R. For example, a fabric specification requiring 200 kPa bursting strength should mandate a mill release target of 200 kPa plus 0.5R. Operating with this guardband prevents normal testing scatter from pushing compliant production lots into non-conforming territory upon buyer re-testing.
As a rule of thumb, no commercial claim should be paid without third-party referee verification whenever the observed property deviation is smaller than the published inter-laboratory reproducibility limit.
Chain-of-custody documentation failures frequently invalidate otherwise sound technical defenses. Swatches shipped for re-testing without tamper-evident packaging or clear environmental logging risk contamination or moisture damage in transit. Customs delays at transatlantic ports expose unsealed samples to elevated temperatures and fluctuating humidity inside freight containers.
Demonstrating an unbroken, environmentally monitored chain of custody ensures that referee test outcomes reflect true lot performance rather than transit degradation.
Colorfastness rejections frequently conflict with inspection conditions, such as discrepancies in light source color temperature during visual evaluation.

Resolution

Drafting Precision-Literate Commercial Contracts
Preventing cross-border commercial claims requires drafting purchase agreements that explicitly address inter-laboratory precision boundaries. Traditional supply contracts rely on single-point physical property thresholds, such as minimum tensile strength or maximum residual chemical concentration. These single-point specifications invite disputes because they ignore the inherent variability of standardized test methods.
Modern sourcing contracts avoid this by incorporating statistical tolerance limits directly into product specifications.
Contract clauses must define the governing test standard, required specimen count, environmental conditioning criteria, and the statistical decision rule applied to test discrepancies. Decision rules based on ISO 10576-1 provide clear mathematical guidelines for declaring conformity or non-conformity in the presence of measurement uncertainty. Specifying an explicit Critical Difference calculation within the contract eliminates legal ambiguity when buyer and seller test reports conflict.
- Governing Test Standards Clause specifying exact year-version editions of ISO or ASTM test methods, resolving procedural conflicts between divergent international standard versions.
- Specimen Sampling Protocol defining precise sampling locations, selvedge offset distances, roll selection counts, and specimen cutting methodologies.
- Environmental Pre-Conditioning Mandate detailing mandatory chamber temperature, relative humidity tolerances, and minimum duration schedules prior to testing.
- Critical Difference Decision Rule setting explicit mathematical formulas for evaluating inter-laboratory discrepancies before formal rejection rights trigger.
- Referee Laboratory Selection Mandate pre-naming accredited independent facilities and binding both parties to blind referee test outcomes.
Customs duty adjustments and border detentions add legal urgency to chemical compliance accuracy. European REACH enforcement authorities apply strict screening thresholds for restricted hazardous substances. If a port inspection laboratory detects 35 milligrams per kilogram of an aromatic amine against a 30 milligram per kilogram legal limit, the container faces immediate detention.
Defending against that detention requires submitting verified inter-laboratory reproducibility data proving that the 5 milligram per kilogram excess lies within the method’s analytical measurement uncertainty band.
Financial liability clauses in transatlantic purchase agreements should cap commercial claim damages relative to lot value. Rejection claims triggering secondary losses, such as cut-make-trim factory downtime or missed retail delivery windows, present severe financial risk to textile converters. Contractual indemnification provisions ought to limit seller exposure to replacement of non-conforming fabric or refund of landed purchase price, provided observed property values fall within the established inter-laboratory Critical Difference band.
Standard commercial sales terms published by international textile federations incorporate explicit inter-laboratory precision allowances, defining maximum permissible property deviations before a buyer may lawfully reject delivered goods.